. 2017 May;29(5):1119-1136.
doi: 10.1105/tpc.17.00071. Epub 2017 Mar 31.

Lateral Segregation of Photosystem I in Cyanobacterial Thylakoids

Affiliations

Lateral Segregation of Photosystem I in Cyanobacterial Thylakoids

Craig MacGregor-Chatwin et al. Plant Cell. 2017 May.

Erratum in

  • CORRECTION.
    [No authors listed] [No authors listed] Plant Cell. 2017 Jul;29(7):1794. doi: 10.1105/tpc.17.00535. Epub 2017 Jul 6. Plant Cell. 2017. PMID: 28687654 Free PMC article. No abstract available.

Abstract

Photosystem I (PSI) is the dominant photosystem in cyanobacteria and it plays a pivotal role in cyanobacterial metabolism. Despite its biological importance, the native organization of PSI in cyanobacterial thylakoid membranes is poorly understood. Here, we use atomic force microscopy (AFM) to show that ordered, extensive macromolecular arrays of PSI complexes are present in thylakoids from Thermosynechococcus elongatus, Synechococcus sp PCC 7002, and Synechocystis sp PCC 6803. Hyperspectral confocal fluorescence microscopy and three-dimensional structured illumination microscopy of Synechocystis sp PCC 6803 cells visualize PSI domains within the context of the complete thylakoid system. Crystallographic and AFM data were used to build a structural model of a membrane landscape comprising 96 PSI trimers and 27,648 chlorophyll a molecules. Rather than facilitating intertrimer energy transfer, the close associations between PSI primarily maximize packing efficiency; short-range interactions with Complex I and cytochrome b6f are excluded from these regions of the membrane, so PSI turnover is sustained by long-distance diffusion of the electron donors at the membrane surface. Elsewhere, PSI-photosystem II contact zones provide sites for docking phycobilisomes and the formation of megacomplexes. PSI-enriched domains in cyanobacteria might foreshadow the partitioning of PSI into stromal lamellae in plants, similarly sustained by long-distance diffusion of electron carriers.


Figures

Figure 1.
Figure 1.
AFM Imaging and Analysis of a Thylakoid Membrane Patch from T. elongatus That Contains Ordered Arrays of Trimeric Complexes. (A) AFM topograph of a membrane patch. (B) Zoom to a single complex, with the positions of three height profiles shown (red, pink, and green dashed lines), taken across the approximate positions of maximum height. (C) Height profiles corresponding to the lines in (B), with lateral distances shown. (D) Structure of the cytoplasmic face of the PSI complex taken from PDB:1JB0. The dashed yellow lines are drawn between proline 29 of the PsaC subunit on each monomer, shown in green, and represent a distance of 9.1 nm.
Figure 2.
Figure 2.
Analysis of the Heights of Topological Features in Relation to the Mica Substrate and the Thylakoid Membrane Surface. (A) Three-dimensional representation of a membrane patch from T. elongatus that contains ordered arrays of trimeric complexes. (B) Two-dimensional representation of the AFM data; the dashed white line shows the position of a section used for the height profile in (D). The black box represents the area shown in (C). (C) Detailed view of an area of membrane showing the position of a section taken across two trimers and an intervening membrane bilayer. The dashed white line shows the position of section used for the height profile in (E). (D) Height profile corresponding to the white dashed line in panel (B), showing the heights of the trimeric complexes with respect to the membrane bilayer. (E) Profile showing an approximate height of 3.2 nm from the membrane surface to the top of the protein features. (F) Histogram of height data compiled from an analysis of 287 complexes; the average height of the complexes above the mica is 9.3 ± 0.4 nm. (G) Model summarizing the height data, showing their consistency with the height of PSI measured from the crystal structure, and the positions of PSI cofactors in relation to the membrane bilayer (the dashed black line represents the apex of the PSI complex). The 1.1-nm protrusion of the complex from the lumenal surface of the membrane is in parentheses to indicate that it was deduced from the other measurements.
Figure 3.
Figure 3.
Structural Model of the Arrangement of Complexes within a PSI-Only Thylakoid Membrane. The PSI trimers are arranged according to the AFM topograph in Figure 1A, visible as an overlay on the right. The inset on the right shows the correspondence between the PsaC-D-E protrusions of each PSI trimer (red) and corresponding AFM topological features (white). The trimers are shown in surface representation. The pigments can be seen through the transparent surface on the left as the antenna (green) and RC (red) chlorophylls, represented as porphyrin rings, as well as the carotenoids (orange). The inset on the left shows the typical packing pattern around a trimer (see Figure 4). The model features a total of 96 PSI trimers and 27,648 chlorophylls.
Figure 4.
Figure 4.
Excitonic Connectivity between PSI Complexes within and across Trimers Corresponding to the Hexagonal Pattern in Figure 3. Shown in (A) are the couplings HMN,mn between pairs of pigments m,n of PSI monomers M,N, respectively, for MN; intramonomer couplings are not shown for clarity. The connections have cross sections proportional to the coupling |HMN,mn|; couplings below 1/cm are not shown. Due to the approximate symmetry displayed by the PSI grid (Supplemental Figure 7), only the couplings of immediate neighbors of one PSI monomer (red in [A], I in [B]) are considered; two of the neighbors are in the same trimer (green in [A], II in [B]; blue in [A], III in [B]) and two are corresponding symmetry-copies in neighboring trimers (purple in [A], II' in [B]; orange in [A], III' in [B]). Excitation sharing between monomers is shown in (C) in terms of the trapping probability formula image 
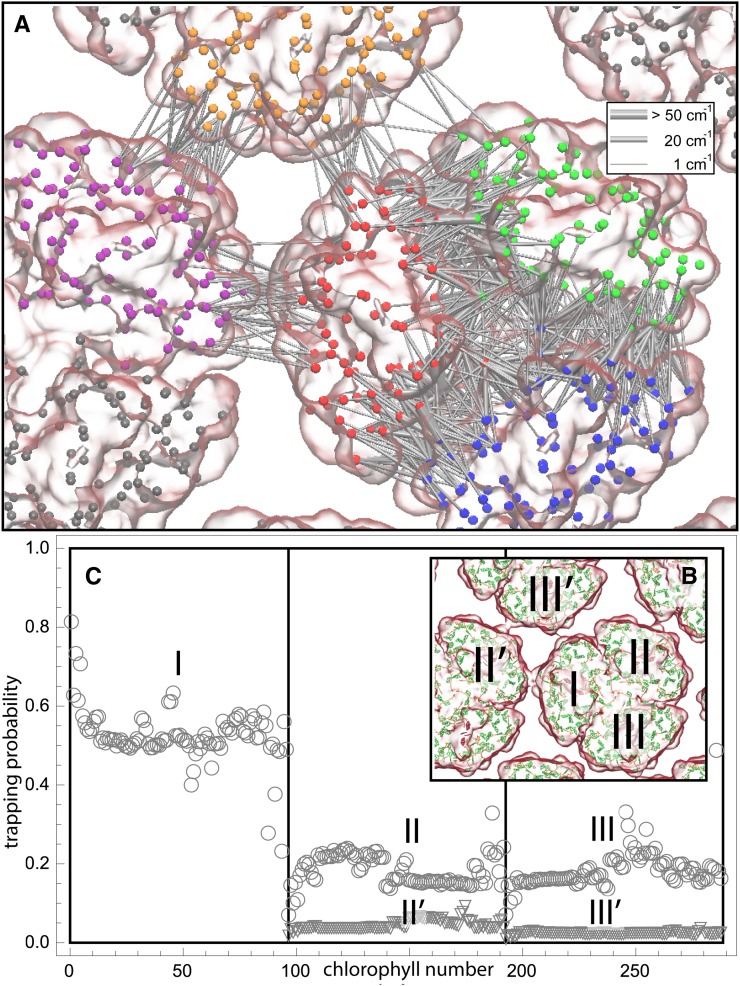
of excitation at RCI as a function of initial site across the PSI monomers M = I, II, III, II', III' as indicated in (B). Chlorophyll number m corresponds to the order given in PDB:1JB0. As suggested by the connections in (A), excitation sharing within the monomers of the same trimer is more prominent than across trimers.
Figure 5.
Figure 5.
AFM Imaging of a Membrane Patch from T. elongatus That Contains Trimeric Complexes in a Disordered Arrangement. (A) Random distribution of trimeric complexes (gray), with intervening complexes in green; the false color representation was used to emphasize the topographic features present in these regions between PSI complexes. (B) Two-dimensional representation of the AFM data; the dashed red line shows the position of a section used for the height profile in (C). Trimeric PSI complexes are outlined by black triangles, and monomeric and dimeric complexes are indicated by asterisks. (C) Height profile corresponding to the red dashed line in (B), showing the heights of trimeric complexes with respect to the mica substrate (h3, h4, h5) and in relation to the membrane bilayer (h2). h6 corresponds to the height of a neighboring complex, likely PSII, above the cytoplasmic surface of the membrane. (D) Diagram showing the heights of PSII (green), cytb6f (purple), and PSI (red) complexes in the thylakoid membrane bilayer, with the vertical positioning of the PSII and PSI complexes, and the thickness of the bilayer, assigned on the basis of AFM measurements. The red and green dashed lines define the respective apices of the PSI and PSII complexes on the cytoplasmic face of the thylakoid membrane. The black dashed line shows the apex of the PSI complex on the lumenal face of the thylakoid membrane which has a height of 1.1 nm. The PSI complex is suspended above the mica surface by 2.2 nm by the lumenal protrusions of the PSII and cytb6f complexes; these distances are shown in parentheses as they were not directly measured but rather calculated from the AFM data and the PSI crystal structure PDB:1JB0. The PSII structure shown is taken from PDB:3WU2 (Umena et al., 2011). See Supplemental Figure 4 for gallery of disordered membrane patches.
Figure 6.
Figure 6.
AFM of Putative PSII Complexes in a Thylakoid Membrane Patch from T. elongatus. (A) AFM of membrane patches from T. elongatus showing dimeric protein complexes. (B) Forty-three dimeric complexes have been outlined in white. (C) Zoomed-in view in which dimeric complexes can be seen. Red and blue dashed lines show the locations of the sections shown in (D). (D) Sections of dimeric complexes in (C) showing that the spacing between the constituent monomers is ∼12 nm. (E) The heights of 113 protein complexes above the surface of the lipid bilayer were measured; the average height is 4.3 ± 0.6 nm, which is consistent with the crystal structure of PSII PDB:3WU2 (Umena et al., 2011). (F) The heights of 129 complexes were measured from the mica surface giving an average height of 10.3 ± 0.6 nm above the mica. (G) The distance between the two halves of the dimeric complexes was measured giving an average separation of 11.7 ± 1.9 nm. (H) Diagram showing the height of the PSII complex (green) from the surface of the mica (blue band), lipid bilayer (gray band), and the distance between the water-oxidizing complexes of the two monomers in the dimeric PSII complex. The dashed black line shows the position of the apex of the PSII dimer on the lumenal face of the thylakoid membrane.
Figure 7.
Figure 7.
AFM of PSI in Thylakoids from Synechocystis sp PCC 6803. (A) Topograph of a PSI-rich region. (B) Zoomed image from the inset outlined in (A) with the positions of three height profiles shown (red, blue, and green dashed lines), taken across the approximate positions of maximum height. (C) Structure of the cytoplasmic face of the PSI complex taken from PDB:1JB0 for the T. elongatus PSI complex. (D) Height profiles corresponding to the lines in (B), with lateral distances shown. The dashed yellow lines are drawn between proline 29 of the PsaC subunit on each monomer, shown in green, and represent a distance of 9.1 nm. (E) The topograph in (A), with PSI trimers outlined in black and other topographic features with an average height of 13.0 ± 0.6 nm above the mica and 6.0 ± 0.8 nm above the lipid bilayer outlined in white. (F) and (I) PSI arrays bordering membrane regions with minimal topology. (G) and (J) Sections across these featureless regions corresponding to the dashed lines in (F) and (I). (H) and (K) the topographs in (F) and (I)with the PSI trimers outlined in black. (L) Diagram depicting a model for the lateral segregation of PSI (red) from PSII (green) and cytb6f (purple) complexes in the lipid bilayer (gray band).
Figure 8.
Figure 8.
HCFM of PSI-YFP Complexes in Synechocystis sp PCC 6803 Cells. (A) Cellular distribution of phycocyanin, PSI/PSII chlorophyll, and YFP based on spectra representing the pure fluorescent components and color coded as shown at the top of the figure. Green and yellow membrane patches correspond to areas of PSI-YFP and PSI-YFP with phycocyanin, respectively. The magenta signal arises from superposition of phycocyanin (blue) and PSI/PSII (red). (B) Wild-type control showing only the magenta phycocyanin plus PSI/PSII signal. (C) Control showing YFP expressed uniformly throughout the cytoplasm. (D) Control for the periplasmic compartment, in which YFP is efficiently targeted to the periplasm by the TorA signal peptide. Box sizes = 3 × 3 µm.
Figure 9.
Figure 9.
3D-SIM of PSI-YFP Complexes in Synechocystis Cells. (A) Four fields of images of PSI-YFP cells, each one with four consecutive, but nonsequential, optical slices through each cell. YFP fluorescence is displayed on the Green Fire Blue scale in ImageJ, with highest levels of YFP green/yellow and lower levels in blue (bar = 4 µm). (B) Zoomed images to show PSI-YFP membranes in more detail (bar = 1 µm). (C) Image showing smaller, faint zones of PSI-YFP fluorescence outlined in white (bar = 1 µm).

Similar articles

Cited by

References

    1. Agarwal R., Matros A., Melzer M., Mock H.-P., Sainis J.K. (2010). Heterogeneity in thylakoid membrane proteome of Synechocystis 6803. J. Proteomics 73: 976–991. - PubMed
    1. Biggins J., Bruce D. (1989). Regulation of excitation energy transfer in organisms containing phycobilins. Photosynth. Res. 20: 1–34. - PubMed
    1. Biggins J., Campbell C.L., Bruce D. (1984). Mechanism of the light state transition in photosynthesis. II. Analysis of phosphorylated polypeptides in the red alga, Porphyridium cruentum. Biochim. Biophys. Acta 767: 138–144.
    1. Boussac A., Rappaport F., Carrier P., Verbavatz J.-M., Gobin R., Kirilovsky D., Rutherford A.W., Sugiura M. (2004). Biosynthetic Ca2+/Sr2+ exchange in the photosystem II oxygen-evolving enzyme of Thermosynechococcus elongatus. J. Biol. Chem. 279: 22809–22819. - PubMed
    1. Bryant D.A., ed (2006). The Molecular Biology of Cyanobacteria, Vol. 1. (Dordrecht, The Netherlands: Springer Science & Business Media).

Publication types

MeSH terms

Substances