. 2017 Mar 1;140(3):568-581.
doi: 10.1093/brain/awx002.

Deleterious variants in TRAK1 disrupt mitochondrial movement and cause fatal encephalopathy

Affiliations

Deleterious variants in TRAK1 disrupt mitochondrial movement and cause fatal encephalopathy

Ortal Barel et al. Brain. .

Erratum in

  • Corrigendum.
    [No authors listed] [No authors listed] Brain. 2018 Apr 1;141(4):e34. doi: 10.1093/brain/awy063. Brain. 2018. PMID: 29528374 Free PMC article. No abstract available.

Abstract

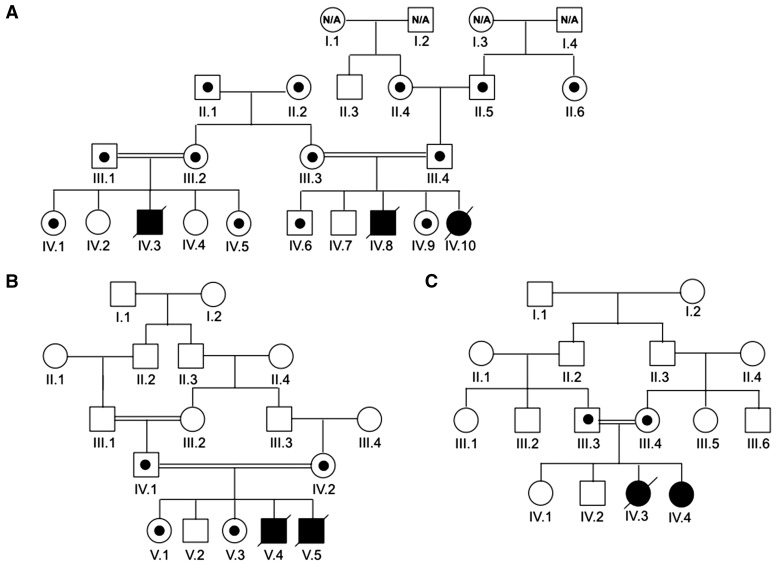
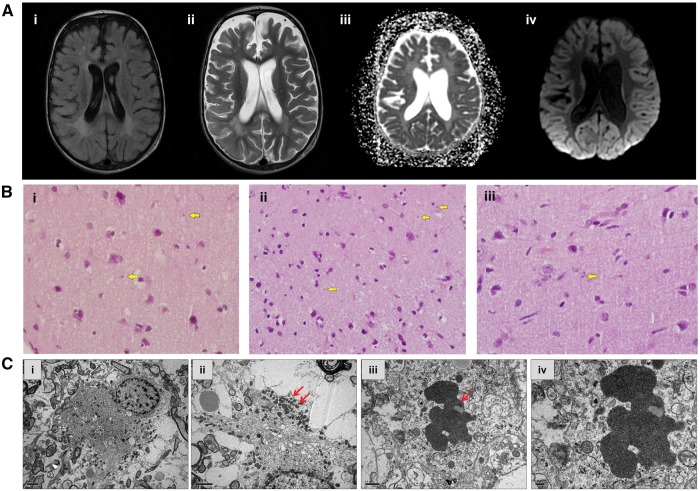
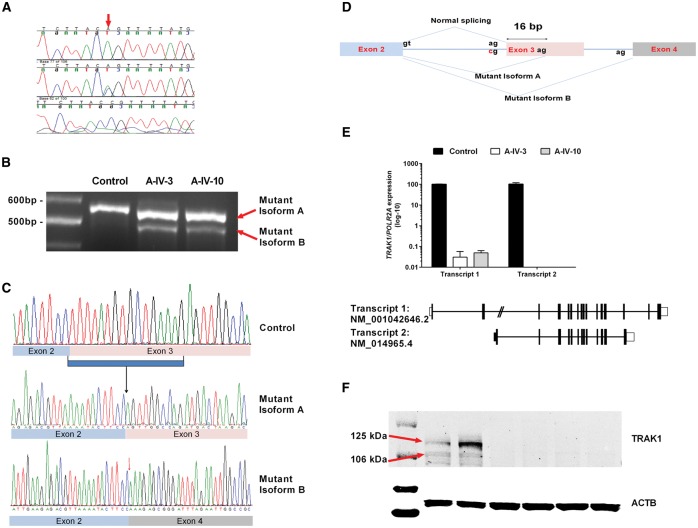
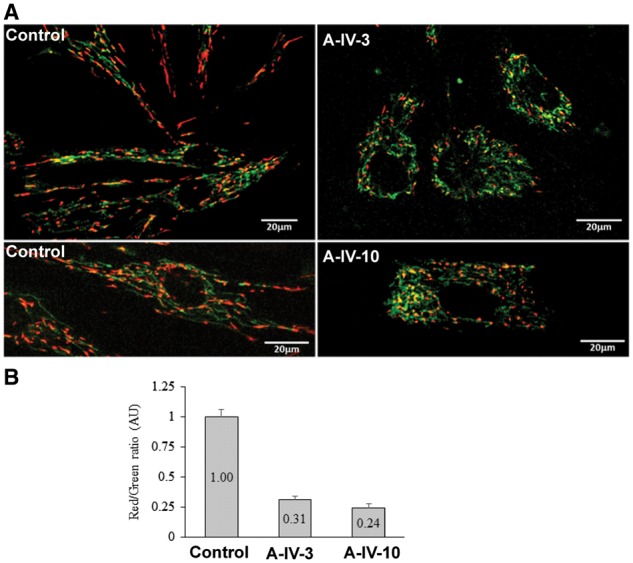
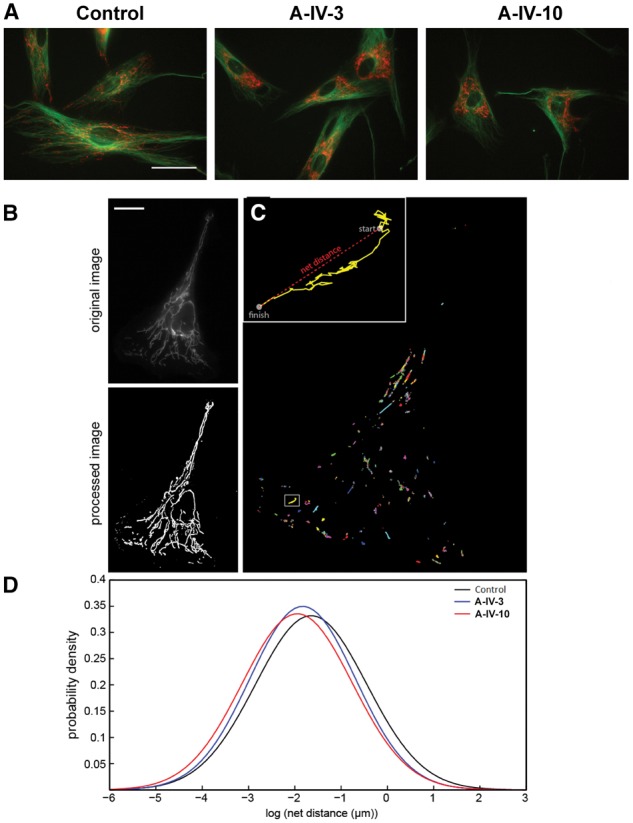
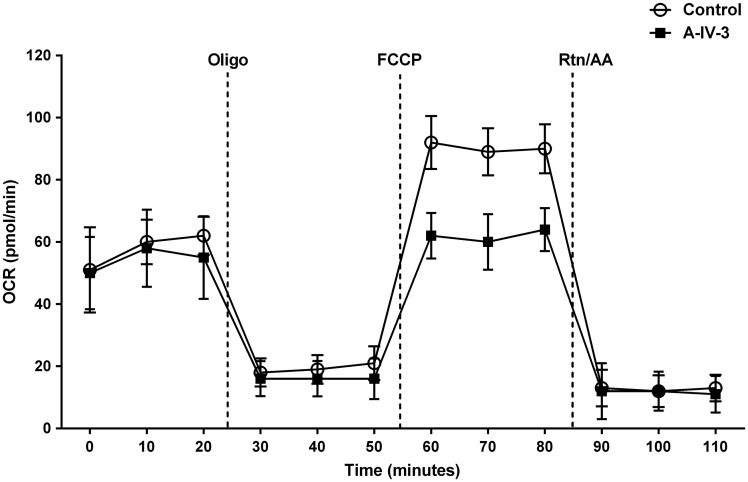
Cellular distribution and dynamics of mitochondria are regulated by several motor proteins and a microtubule network. In neurons, mitochondrial trafficking is crucial because of high energy needs and calcium ion buffering along axons to synapses during neurotransmission. The trafficking kinesin proteins (TRAKs) are well characterized for their role in lysosomal and mitochondrial trafficking in cells, especially neurons. Using whole exome sequencing, we identified homozygous truncating variants in TRAK1 (NM_001042646:c.287-2A > C), in six lethal encephalopathic patients from three unrelated families. The pathogenic variant results in aberrant splicing and significantly reduced gene expression at the RNA and protein levels. In comparison with normal cells, TRAK1-deficient fibroblasts showed irregular mitochondrial distribution, altered mitochondrial motility, reduced mitochondrial membrane potential, and diminished mitochondrial respiration. This study confirms the role of TRAK1 in mitochondrial dynamics and constitutes the first report of this gene in association with a severe neurodevelopmental disorder.

Keywords: TRAK1; early-onset epilepsy; mitochondria transport; neurodegeneration; rare diseases.


Figures

Figure 1
Figure 1
Pedigrees of patients with pathogenic TRAK1 variants. Patients in Families A (A), B (B) and C (C) are depicted. Open symbols represent unaffected individuals, filled symbols designate affected individuals and are homozygous for the splicing variant. N/A = not available. Symbols with small circles within designate carrier status for the splicing variant.
Figure 2
Figure 2
Neuroimaging and brain biopsy studies. (A) Brain MRI studies of affected cousins from Family A. (i) T2 FLAIR axial image of Patient A-IV.3 at the level of the lateral ventricles demonstrating abnormal signal of the periventricular white matter; (ii) T2 axial image of Patient A-IV.3 at the same level demonstrates grey and white matter atrophy accompanied by signal abnormality of the periventricular white matter; (iii) ADC (apparent diffusion coefficient) calculation of the image of Patient A-IV.10, consistent with diffusion restriction suggesting metabolic compromise; and (iv) Diffusion weighted imaging (DWI) sequence at the same level shows abnormal cortical signal bilaterally in the occipital lobes. (B) Brain biopsy histology of Patients A-IV.3 and A-IV.10. Haematoxylin and eosin staining revealed round-oval shaped structures seen in the neuropil of the grey matter (arrows). Magnification: ×600. (C) Transmission electron micrograph (Patient IV.3) in i shows the distribution of mitochondria at the periphery of the cell; ii is at a higher magnification, demonstrating clusters of the mitochondria (arrows) observed at the cell periphery. Electron micrograph in iii indicates an inclusion body (arrow) in a neuronal process. High magnification of the inclusion body iv indicates that the inclusion consists of aggregates of vesicles.
Figure 3
Figure 3
Molecular analyses of TRAK1 variant in patients. (A) Sample chromatogram showing the Sanger confirmation of the variant in the families (wild-type, heterozygous, and homozygous). (B) RT-PCR products obtained with primer pairs (flanking exon 3) for amplification of the mRNA from two affected individuals (Patients A-IV.3 and A-IV.10) and one control. The results indicate two abnormal cDNA fragments in affected individuals compared to control: a 16-bp deleted (mutant isoform A) and 77-bp deleted (mutant isoform B). (C) In comparison to control (top), sequencing of affected individual’s aberrant transcripts shows lack of the first 16 bp of TRAK1 exon 3 (middle) and entire exon 3 (bottom). (D) Schematic diagram of splicing defect, showing the formation of two different mutant transcripts (mutant isoform A and mutant isoform B). (E) Significantly reduced expression of Transcript 1 (NM_001042646) in patients, comparison to control. Results were normalized with the expression of a housekeeping gene, POLR2A. Transcript 2 (NM_014965.4) was undetectable in both Patients A-IV.3 and A-IV.10. (F) Western blot results showing significantly reduced or no expression of TRAK1 in both patients in comparison to control. Beta actin (ACTB) was used as loading control. Lanes 1 to 7 represent: 1, ladder; 2 and 3; control; 4 and 5, Patient A-IV-3; 6 and 7, Patient A-IV-10.
Figure 4
Figure 4
JC-1 metabolic staining. (A) Images from fibroblasts of affected individuals (Patients A-IV-3 and A-IV-10) and unaffected control incubated with JC-1 dye. A fluorescent shift from green to red indicates a potential-dependent mitochondrial accumulation. (B) Red/green ratios were calculated from the relative red and green intensities.
Figure 5
Figure 5
Analysis of mitochondrial movement in fibroblasts. (A) Microtubule staining. Fibroblasts from control and different patients (Patients A-IV.3 and A-IV.10) are stained with TubulinTracker (green) and TMRM (red). Scale bar = 50 µm. (B–D) Images depicting mitochondrial movement. (B) Image of a sample control cell before and after ImageJ processing. Scale bar = 20 µm. (C) Path lengths of all mitochondrial centroids in this cell. Box indicates inset region. Inset: Path length of one particular mitochondrion, with start and finish points indicated. This mitochondrion travelled a total distance of 9.52 µm and a net distance of 2.47 µm. (D) Probability density plots of net distances travelled by control and patient mitochondria.
Figure 6
Figure 6
Oxygen consumption rates in fibroblasts. Cellular oxygen consumption rates (OCR) for fibroblast cell lines from wild-type and TRAK1 c.287-2 A > C patient (Patient A-IV.3) was measured by XF24 extracellular flux analysis. Oligomycin (1.25 µM), carbonyl cyanide 4-(trifluoromethoxy) phenylhydrazone (FCCP, 0.2 µM), and antimycin A (1.8 µM) together with rotenone (1 µM) were injected after 20, 50 and 80 min, respectively. n = 4 plates; *P-value < 0.05.

Similar articles

Cited by

References

    1. Anesti V, Scorrano L. The relationship between mitochondrial shape and function and the cytoskeleton. Biochim Biophys Acta 2006; 1757: 692–9. - PubMed
    1. Barnhart EL. Mechanics of mitochondrial motility in neurons. Curr Opin Cell Biol 2016; 38: 90–9. - PubMed
    1. Bonekamp NA, Islinger M, Lazaro MG, Schrader M. Cytochemical detection of peroxisomes and mitochondria. Methods Mol Biol 2013; 931: 467–82. - PubMed
    1. Brickley K, Pozo K, Stephenson FA. N-acetylglucosamine transferase is an integral component of a kinesin-directed mitochondrial trafficking complex. Biochim Biophys Acta 2011; 1813: 269–81. - PubMed
    1. Brickley K, Stephenson FA. Trafficking kinesin protein (TRAK)-mediated transport of mitochondria in axons of hippocampal neurons. J Biol Chem 2011; 286: 18079–92. - PMC - PubMed

Publication types

MeSH terms

Substances