. 2017 May 24;4(5):516-529.e7.
doi: 10.1016/j.cels.2017.03.004. Epub 2017 Mar 29.

A Cell-Surface Membrane Protein Signature for Glioblastoma

Affiliations

A Cell-Surface Membrane Protein Signature for Glioblastoma

Dhimankrishna Ghosh et al. Cell Syst. .

Abstract

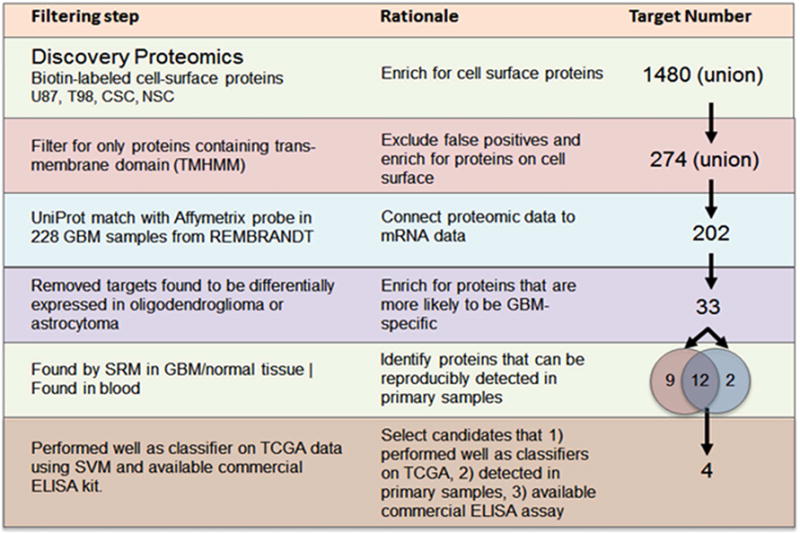
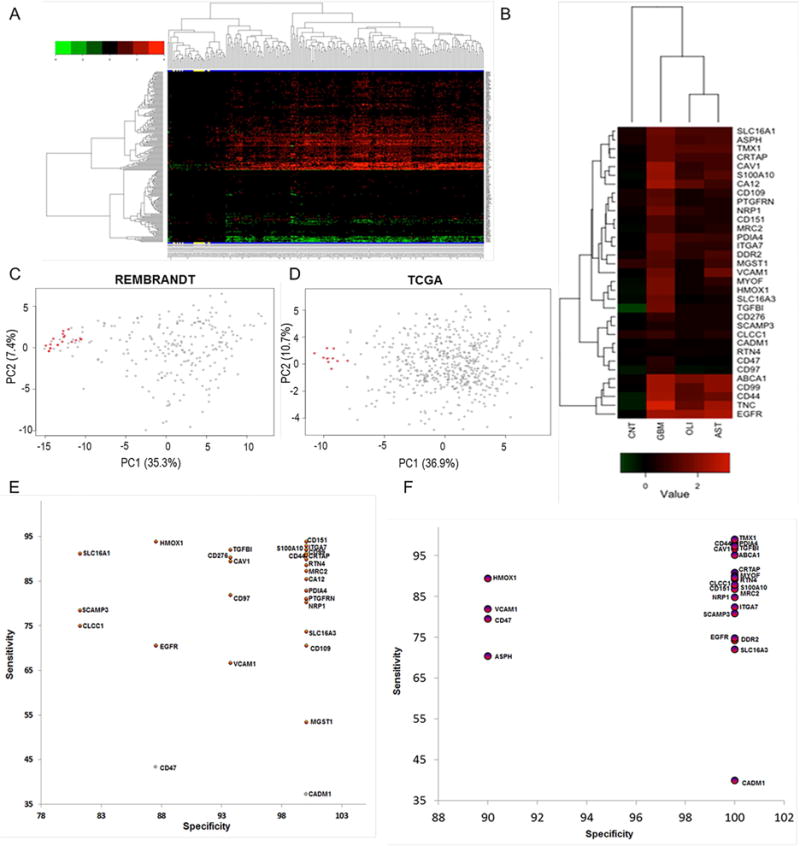
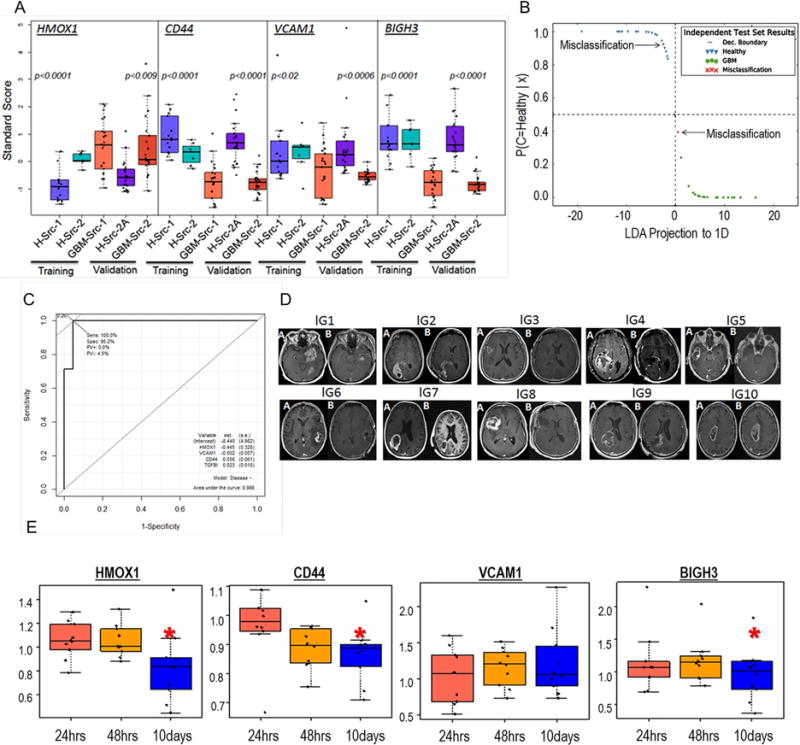
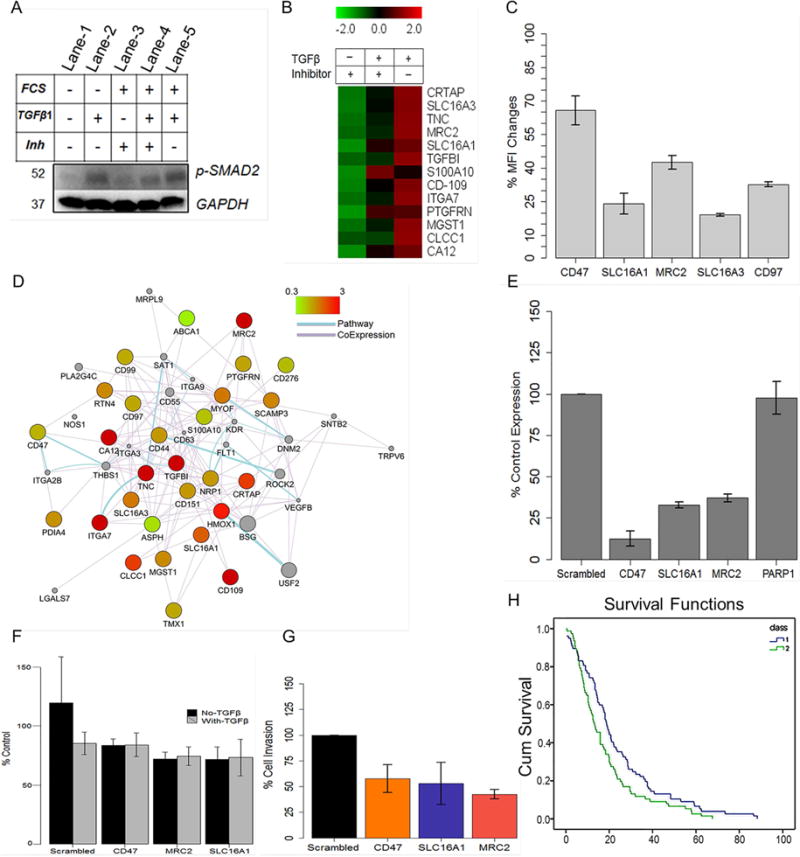
We present a systems strategy that facilitated the development of a molecular signature for glioblastoma (GBM), composed of 33 cell-surface transmembrane proteins. This molecular signature, GBMSig, was developed through the integration of cell-surface proteomics and transcriptomics from patient tumors in the REMBRANDT (n = 228) and TCGA datasets (n = 547) and can separate GBM patients from control individuals with a Matthew's correlation coefficient value of 0.87 in a lock-down test. Functionally, 17/33 GBMSig proteins are associated with transforming growth factor β signaling pathways, including CD47, SLC16A1, HMOX1, and MRC2. Knockdown of these genes impaired GBM invasion, reflecting their role in disease-perturbed changes in GBM. ELISA assays for a subset of GBMSig (CD44, VCAM1, HMOX1, and BIGH3) on 84 plasma specimens from multiple clinical sites revealed a high degree of separation of GBM patients from healthy control individuals (area under the curve is 0.98 in receiver operating characteristic). In addition, a classifier based on these four proteins differentiated the blood of pre- and post-tumor resections, demonstrating potential clinical value as biomarkers.

Keywords: GBM; GBMSig; cell-surface proteins; invasion.


Figures

Figure 1
Figure 1
Description of the rationale and accompanying filtering steps applied to the initial list of proteins identified through sulfo-NHS-SS-biotin tagging of intact cells from four cell lines: U87MG, T98, CD133+ cancer stem cells and neural stem cells. From the 1480 candidate proteins, 274 contained transmembrane domains. Corresponding probes were found for 202 targets in the REMBRANDT data set containing 228 GBM and 16 non-tumor brain tissue specimens. Genes found to be commonly expressed in oligodendrogliomas and astrocytomas were then removed to enrich for GBM-specific targets. This resulted in 33 targets identified as GBMSig. SRM mass spectrometry assays were developed for each of these targets. Twenty-one of the 33 GBMSig proteins could be detected across 4 GBM and 2 non-tumor brain specimens. Fourteen of the 33 proteins were also detected in the blood (following immunodepletion of the top 14 abundant blood proteins). Each of the 33 targets was evaluated as a classifier on 547 GBM and 10 control samples from TCGA. Four targets were selected based on the robustness as a classifier, ability to be detected in the blood and availability of a commercial ELISA assay.
Figure 2
Figure 2
Compositional analysis of cell-surface proteins (CSPs) from three independent runs by high resolution mass spectrometry in (A) U87MG, (B) T98, (C) cancer stem cell (Celprogen), and (D) neural stem cell (Millipore). Proteins with log(e)=−3 score (GPM) were considered valid. Numerical data represents proteins identified in each isolates. E) Functional analyses of cell-surface proteins with transmembrane domains identified in the study highlight the enrichment of those biological processes that are known to be associated with cell-surface activities. Fold enrichment is presented as a ratio of number of cell-surface transmembrane proteins identified for a given biological process relative to whole genome annotations with indicated p values. F) Cartoon diagram (KEGG) showing the identification (highlighted in orange) of those proteins associated with cell migration and invasion.
Figure 3
Figure 3
Cell-surface proteins with transmembrane domains identified from shotgun proteomics were evaluated for their differential expressions using transcriptome compendiums of REMBRANDT and TCGA. A) The differential expression of 202 cell-surface transmembrane proteins in GBM tissues (N=228) relative to non-tumor brain specimens (N=16) of REMBRANDT transcriptome compendium. Expression values for these transcripts were log2 transformed, and a minimum of two-fold average expression change (FDR<0.05) between tumor and non-tumor brain tissues was used as cut-off for significance. Clustering reflects the directionality of cell-surface transmembrane transcript expression among GBM and controls. Non-tumor brain specimens are highlighted in yellow at the bottom. B) majority of the cell-surface proteins with transmembrane domains mapped to REMBRANDT transcripts were discarded due to common expressions in non-GBM diseases such as astrocytoma (N=148) and oligodendroma (N=67 tumors). Shown are 33 cell-surface transmembrane proteins that were subsequently tested for the development of GBMSig classifier. Each column of the heatmap is presented as the average log2 [tumor/non-tumor] ratios. CNT is non-tumor brain, AST is astrocytoma, and OLI is oligodendroma. C) Principal component analysis (PCA) of REMBRANDT GBM transcriptome arrays with GBMSig (n=33). Red dots represent non-tumor isolates and grey ones are GBM. Two principal components can explain 43% of the variability. D) Principal component analysis (PCA) of independent TCGA GBM transcriptome datasets composed of 547 GBM specimens and 10 non-tumor brain controls with GBMSig (n=33). Two principal components can explain 48% of the variability. Red dots represent non-tumor isolates and grey ones are GBM. E) ROC analysis of REMBRANDT tissue arrays for individual GBMSig proteins. Specificity (%) and Sensitivity (%) values of individual GBMSig were plotted on X and Y axis respectively. Standard error of AUC was calculated using the method described by DeLong et al. Orange color represents significance level P (Area=0.5) <0.0001 while gray color represents P>0.01.Detailed analysis is provided in table S2. F) ROC analysis of independent TCGA tissue arrays (GBM=547 subjects, NonTumor=10 subjects) for individual GBMSig proteins. Specificity (%) and Sensitivity (%) values of individual GBMSig were plotted on X and Y axis respectively. Standard error of AUC was calculated using the approach described by DeLong. The analysis revealed high degree of specificities and sensitivities in discriminating GBM populations from controls with significance level P (Area=0.5) <0.0001. Detailed analysis is provided in Table S2.
Figure 4
Figure 4. Proteomic verification of GBMSig expression in GBM tissues by SRM mass spectrometry
A) Equal quantities of tissue homogenates from tumor (n=4) and non-tumor isolates (n=2) were enzymatically digested, C18 clarified, and spiked with surrogate peptides labeled C-terminally with 13C15N K/R for SRM analysis. Ratios of endogenous and surrogate peptides were centroided and presented as Z-score in the heatmap. A subset of GBMSig (*) was also observed to be circulated in the blood plasma. Co-expression of several GBMSig proteins with BIGH3 (TGFBI) - a known TGFβ-inducible protein might be indicative of the presence of additional TGF-β responsive elements operating within GBMSig. Based on GBMSig expressions, GBM and non-tumor tissues can be arranged into groups as revealed through Spemann rank clustering. B) PCA analyses of GBMSig proteins as quantified by SRM mass spectrometry can distinguish GBM from non-tumor brain specimens with first two components explaining 70.78% of variability, highlighting the robustness of GBMSig in separating GBM from controls with high efficiency at both transcriptome and proteome levels. C) Contributions of each GBMSig protein onto respective principal components. Expected average contributions on PC1 and PC2 are denoted by a red and blue line respectively. D) Subtyping of GBM 1–4 tissues were performed using qPCR for 33 genes as described (Phillips et al., 2006). Accordingly, GBM-1 is assigned as prolifimes, GBM-2 as mesenchymal, GBM-3 as proliferative, and GBM-4 as proneuronal. This subtyping allowed us to explain the heterogeneities in GBMSig expression observed from proteomic analysis. Subtype expression data (qPCR) are provided in table S5.
Figure 5
Figure 5
Blood Diagnostic potentials of four GBMSig proteins. A) four GBMSig proteins viz. CD44, VCAM1, HMOX1, and BIGH3 (TGFBI) were evaluated by ELISA assays using 84 plasma samples obtained from 3 different locations. Despite different sites of collection, both training set and validation set revealed statistically significant differences between GBM (GBM-Src-1 and GBM-Src-2) and healthy controls(H-Src-1,H-Src-2, and H-Src-2A). p values are two tailed and welch corrected. B) ELISA results from training set were modelled using Linear Discriminant Analysis (LDA). The training set created a classifier with a scaling factor of (0.72, −1.1, −.05. −.68) for HMOX1, BIGH3 (TGFBI), VCAM1 and CD44 respectively. The decision boundary coefficients are at (−1.83, 1.83) with an intercept of −2.38. Performance of these four GBMSig proteins was assessed for an independent validation set (GBM=21, Healthy=21). We observed 95.23% sensitivity and 95.2% specificity with 95.2% accuracy for the independent validation set. Dec. Boundary is Decision Boundary. C) Shown here is the ROC analysis of validation set that exhibited an AUC of 0.98, highlighting robust discerning ability of GBMSig proteins as attractive candidates. D) MRI images showing the changes in tumor volume before (A) and after resection (B) for ten GBM patients recruited prospectively for the blood analysis. E) Boxplot showing the changes in the plasma values for 4 GBMSig proteins at 24hrs, 48hrs, and 10days (~) post-resection as measured through ELISA assays. Data were normalized to preoperative condition for individual patient. Y-axis represents GBMSig values in ng/unit of total protein. Black dots represent each patient and ‘*’ indicates p<0.05.
Figure 6
Figure 6. Association of GBMSig proteins with TGF-β1 signaling network
A) U87MG cells were treated with TGF-β1 or its inhibitor in presence or absence of FCS to evaluate i) endogenous c-terminally phosphorylated SMAD2 (lane-1), ii) the ability of TGF-β1 to phosphorylate SMAD2 (lane-2), iii) the ability of TGF-β1-inhibitor to inhibit SMAD2 phosphorylation when cells were grown in normal media (lane-3), iv) the ability of TGF-β1 to induce SMAD2 phosphorylation in cells grown earlier in presence of TGF-β1-inhibitor (lane-4), and v) the level of SMAD2 phosphorylation on prolong TGF-β1 exposure (50hrs) when cells were grown in normal growth media (lane-5). The results demonstrated i) the ability of TGF-β1-inhibitor in inhibiting c-terminal phosphorylation of SMAD2 (lane-3) similar to when cells were grown in serum-free media (lane-1&2) and ii) reversible nature of c-terminal phosphorylation inhibition of SMAD2 that could be reversed with TGF-β1 treatment (lane-3&4). GAPDH was used as loading controls. B) SRM analysis of TGF-β or its inhibitor treated U87MG cell lines revealed responsiveness of a subset of GBMSig proteins towards TGF-β signaling. Complete list of GBMSig proteins detected in various biospecimens and the responsiveness of these proteins towards TGF-β/Inhibitor is provided in the supplementary tables S9 and S10 respectively. Data from four replicates SRM analyses were centroided and presented as Z-score. C) flow cytometry analysis of a subset of GBMSig proteins following TGFβ/Inhibitor treatment. Percentage of changes in mean fluorescence intensity (MFI) was measured from treating U87MG cell lines with TGFβ relative to its inhibitor. Data represent means ± S.D. from four-replicate analyses. D) Network relationship (drawn using Cystoscape) between GBMSig proteins, which are presented as nodes. These nodes are connected through edges based on known pathways and co-expression. Color of the nodes is controlled by fold changes in expression of GBMSig proteins on TGFβ treatment. Grey colored nodes represent extended relationship with GBMSig proteins. E) qPCR analysis of siRNA mediated interference of a subset of TGFβ responsive GBMSig elements viz. MRC2, SLC16A1, and CD47 genes in U87MG cells. Results from three independent siRNA treatments (30hrs) were averaged (error bars represent S.D.) and presented as CT ratios normalized to HPRT housekeeping gene. PARP1 expression was used as non-targeted control. F) Calcein AM assay indicates no significant changes in cell growth and proliferation following siRNA mediated inhibition of SLC16A1, MRC2, and CD47 in U87 cell lines. Data represent means ± S.D. from five replicate analyses. G) siRNA treated U87 cells were allowed to migrate towards TGF-β1 gradient through basement membrane (Cell Biolabs Inc.). Invaded cells were analyzed through colorimetric assay. Results from three independent experiments were averaged and normalized to non-targeting siRNA pools (scrambled). As evident, loss of cell migration following siRNA mediated inhibition of SLC16A1 and MRC2 is similar to that of known invasive marker CD47. Data represent means ± S.D. from three replicate analyses. H) A panel of TGF-β responsive GBMSig (CA12, MRC2, TNC, CD44, SLC16A1, S100A10, ITGA7, CLCCI, and SLC16A3) highlights poor survival (p<0.003, log rank, Mantel-Cox) among GBM patients (class 2) when overexpressed relative to GBM patients where these genes were low expressed (class 1).

References

    1. Aigner L, Bogdahn U. TGF-beta in neural stem cells and in tumors of the central nervous system. Cell and tissue research. 2008;331:225–241. - PubMed
    1. Audigier Y, Picault FX, Chaves-Almagro C, Masri B. G Protein-Coupled Receptors in cancer: biochemical interactions and drug design. Progress in molecular biology and translational science. 2013;115:143–173. - PubMed
    1. Beare A, Stockinger H, Zola H, Nicholson I. Monoclonal antibodies to human cell surface antigens. In: Coligan John E, et al., editors. Current protocols in immunology. 2008. p. 4A. Appendix 4. - PMC - PubMed
    1. Bereman MS, MacLean B, Tomazela DM, Liebler DC, MacCoss MJ. The development of selected reaction monitoring methods for targeted proteomics via empirical refinement. Proteomics. 2012;12:1134–1141. - PMC - PubMed
    1. Bonnefoi H, Potti A, Delorenzi M, Mauriac L, Campone M, Tubiana-Hulin M, Petit T, Rouanet P, Jassem J, Blot E, et al. Validation of gene signatures that predict the response of breast cancer to neoadjuvant chemotherapy: a substudy of the EORTC 10994/BIG 00-01 clinical trial. The Lancet Oncology. 2007;8:1071–1078. - PubMed

Publication types