. 2017 Jan 1;2017(1):bax010.
doi: 10.1093/database/bax010.

The 'straight mouse': defining anatomical axes in 3D embryo models

Affiliations

The 'straight mouse': defining anatomical axes in 3D embryo models

Chris Armit et al. Database (Oxford). .

Abstract

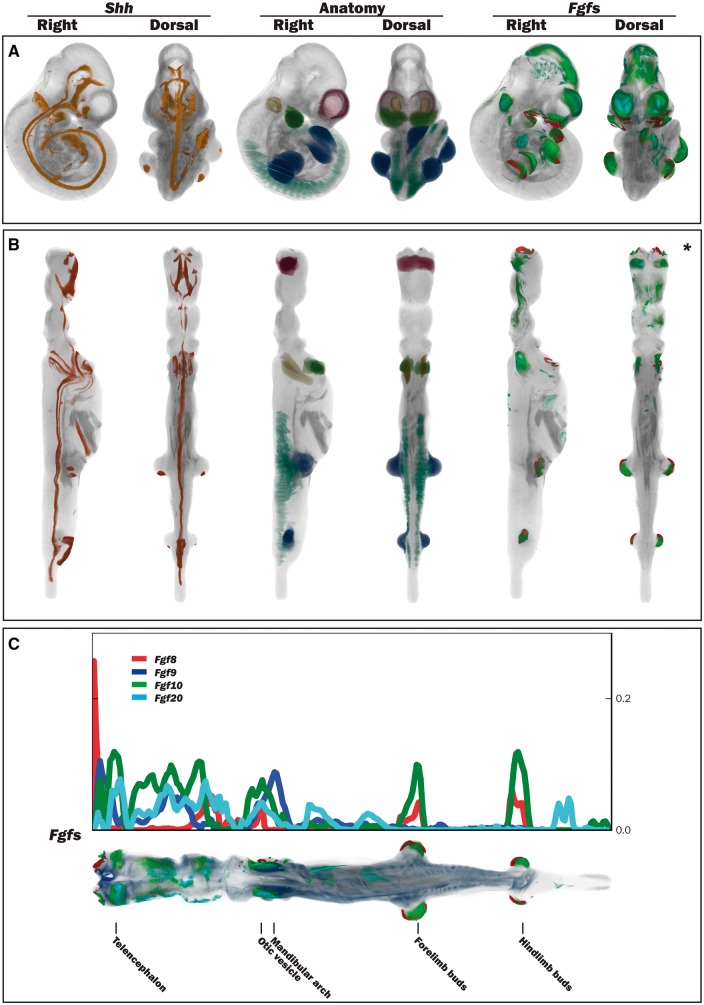
A primary objective of the eMouseAtlas Project is to enable 3D spatial mapping of whole embryo gene expression data to capture complex 3D patterns for indexing, visualization, cross-comparison and analysis. For this we have developed a spatio-temporal framework based on 3D models of embryos at different stages of development coupled with an anatomical ontology. Here we introduce a method of defining coordinate axes that correspond to the anatomical or biologically relevant anterior-posterior (A-P), dorsal-ventral (D-V) and left-right (L-R) directions. These enable more sophisticated query and analysis of the data with biologically relevant associations, and provide novel data visualizations that can reveal patterns that are otherwise difficult to detect in the standard 3D coordinate space. These anatomical coordinates are defined using the concept of a 'straight mouse-embryo' within which the anatomical coordinates are Cartesian. The straight embryo model has been mapped via a complex non-linear transform onto the standard embryo model. We explore the utility of this anatomical coordinate system in elucidating the spatial relationship of spatially mapped embryonic ' Fibroblast growth factor ' gene expression patterns, and we discuss the importance of this technology in summarizing complex multimodal mouse embryo image data from gene expression and anatomy studies.

Database url: www.emouseatlas.org.


Figures

Figure 1.
Figure 1.
Image processing pipeline used to generate the straight mouse embryo. (A) Spatial warping using WlzWarp allows a user to place landmark points on a source image with gene expression (green) and a 3D model (orange) that utilizes a volumetric mesh. The green dots represent equivalent landmark points. (B) The spatial transform enables the gene expression pattern (green) to be mapped into the 3D model. Spatial warping of gene expression patterns using WlzWarp has been described previously in (10). (C) Spatial warping using WlzWarp was additionally used to straighten the mouse embryo model (landmark points not shown). The WlzWarp processing utilizes a CDT that enables complex non-linear deformations to be applied to 3D objects. (D) Gene expression patterns that were mapped into the 3D model (green) can be visualized in the context of the straight mouse embryo model.
Figure 2.
Figure 2.
Straightening the 3D mouse embryo model. (A) Dorsal and lateral views of the original TS17 (E10.5) curled embryo model showing Shh expression, delineated anatomical components and Fgf gene expression. (B) Dorsal and lateral views of the respective straightened embryo model to that in A. Shh expression: observed in the A–P axis midline in the original and straight embryo models, and also in the posterior region of the forelimb and hindlimb buds. Anatomy domains: those shown are the telencephalic vesicles, otic vesicles, mandibular arches, forelimb and hindlimb buds and the somites. Fgf8, Fgf9, Fgf10 and Fgf20 expression patterns: these were spatially mapped as a test case to evaluate the utility of the straight mouse as a data visualization tool. (C) Graphical representation of Fgf gene expression patterns along the A–P axis in relation to the straight mouse embryo. The straight embryo shown is the same as that in B*, but with different opacity and thresholding values. Plot shows distribution of spatially mapped patterns along the A–P axis with the fraction of volume occupied by the thresholded gene expression patterns on the vertical axis.
Figure 3.
Figure 3.
Defining axial planes on the 3D mouse embryo model. (A) Reverse spatial warping allowed axial planes to be defined on the straight mouse embryo model. Sagittal and coronal planes from this reverse transform are shown in the context of the original 3D mouse embryo model. sag, sagittal plane; cor, coronal plane. (B) Colourmaps from red to blue used to demonstrate A–P (left), L–R (middle) and V–D (right) axes in the original, curled embryo model. These axes represent the anatomical coordinates of the embryo model.

References

    1. Thompson D.W. (1917) On Growth and Form,1st edn Cambridge University Press, Cambridge.
    1. French V., Bryant P.J., Bryant S.V. (1976) Pattern regulation in epimorphic fields. Science, 193, 969–981. - PubMed
    1. Bryant S.V., French V., Bryant P.J. (1981) Distal regeneration and symmetry. Science, 212, 993–1002. - PubMed
    1. Paxinos G., Watson C. (1997) The Rat Brain in Stereotaxic Coordinates. Academic Press, San Diego, USA.
    1. Baldock R., Burger A. (2008) Anatomy ontologies: linking names to places in biology. In: Burger,A., Davidson,D., Baldock,R. (eds). Anatomy Ontologies for Bioinformatics: Principles and Practice 1st edn. Springer-Verlag London. pp. 197–212.

Publication types

MeSH terms

LinkOut - more resources