. 2017 Oct;91(10):3385-3402.
doi: 10.1007/s00204-017-1966-1. Epub 2017 Apr 1.

Impairment of human neural crest cell migration by prolonged exposure to interferon-beta

Affiliations

Impairment of human neural crest cell migration by prolonged exposure to interferon-beta

Giorgia Pallocca et al. Arch Toxicol. 2017 Oct.

Erratum in

  • Letter to the editor.
    Pallocca G. Pallocca G. Arch Toxicol. 2019 Jun;93(6):1771. doi: 10.1007/s00204-019-02472-z. Epub 2019 May 13. Arch Toxicol. 2019. PMID: 31087121 Free PMC article. No abstract available.

Abstract

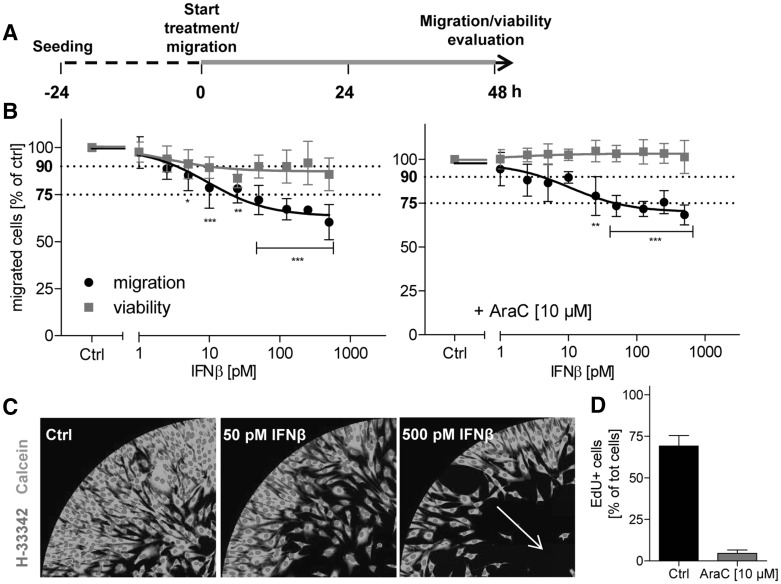
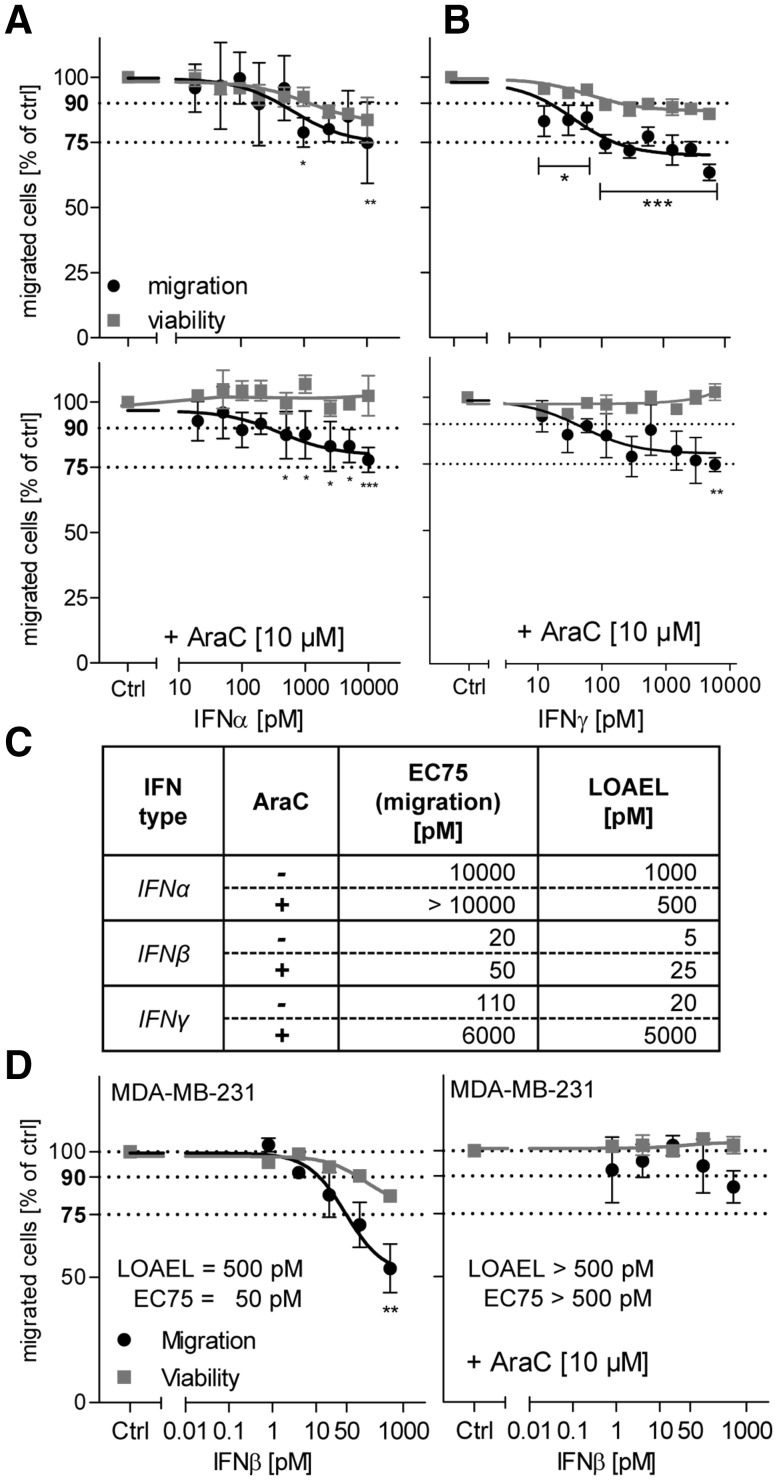
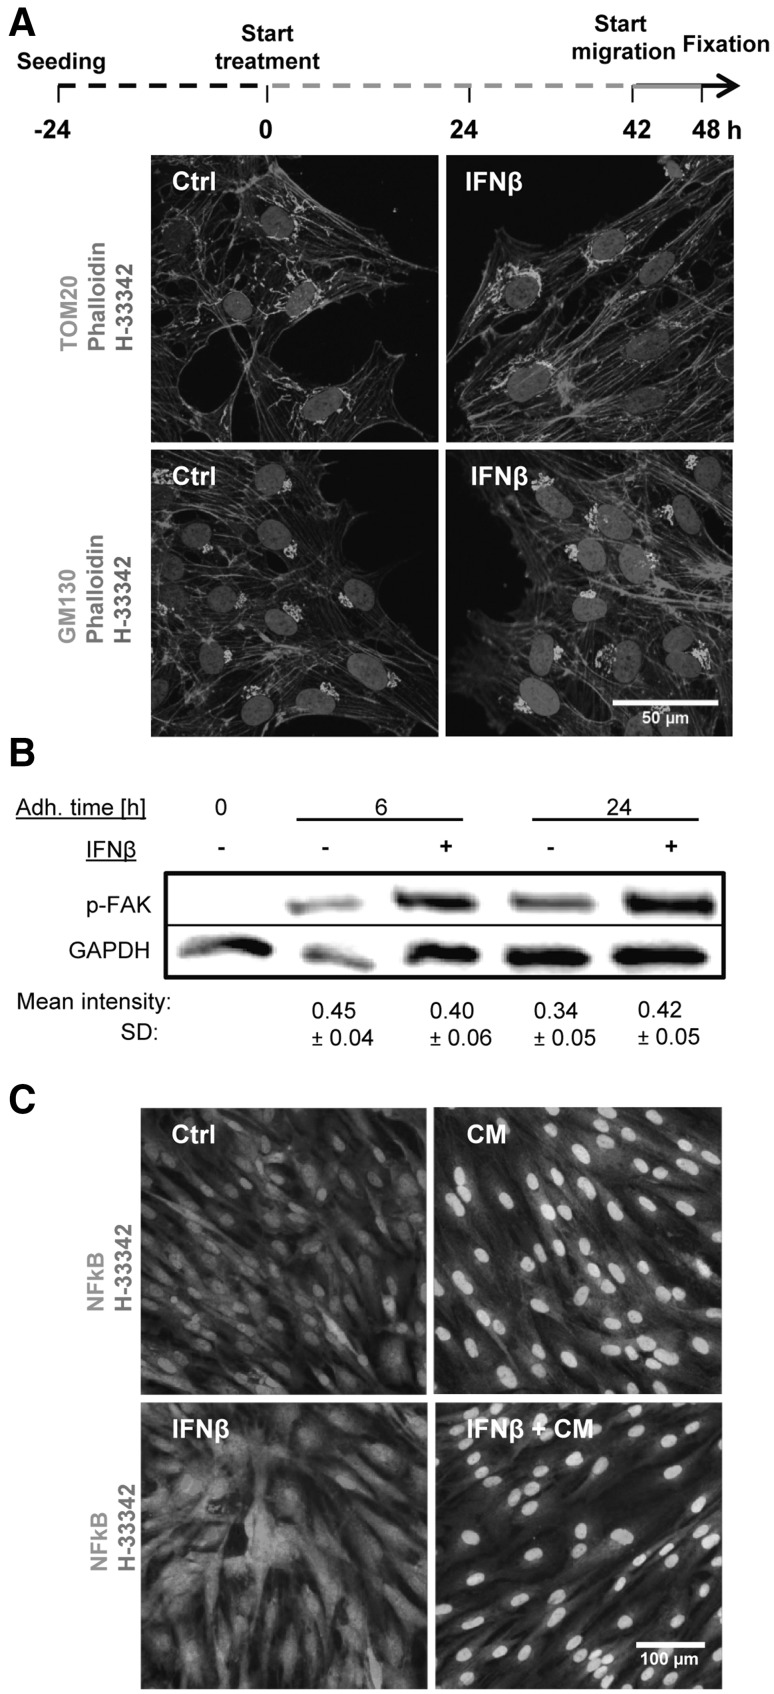
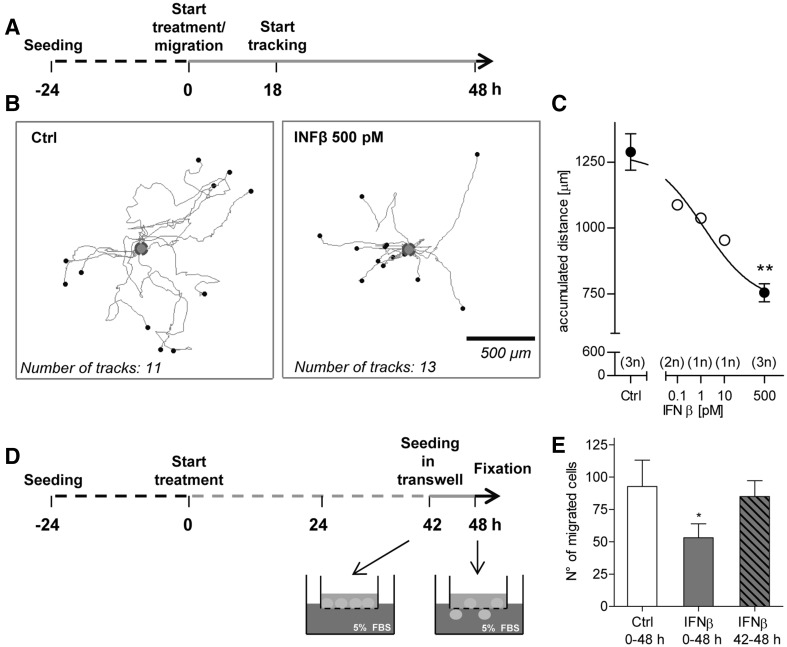
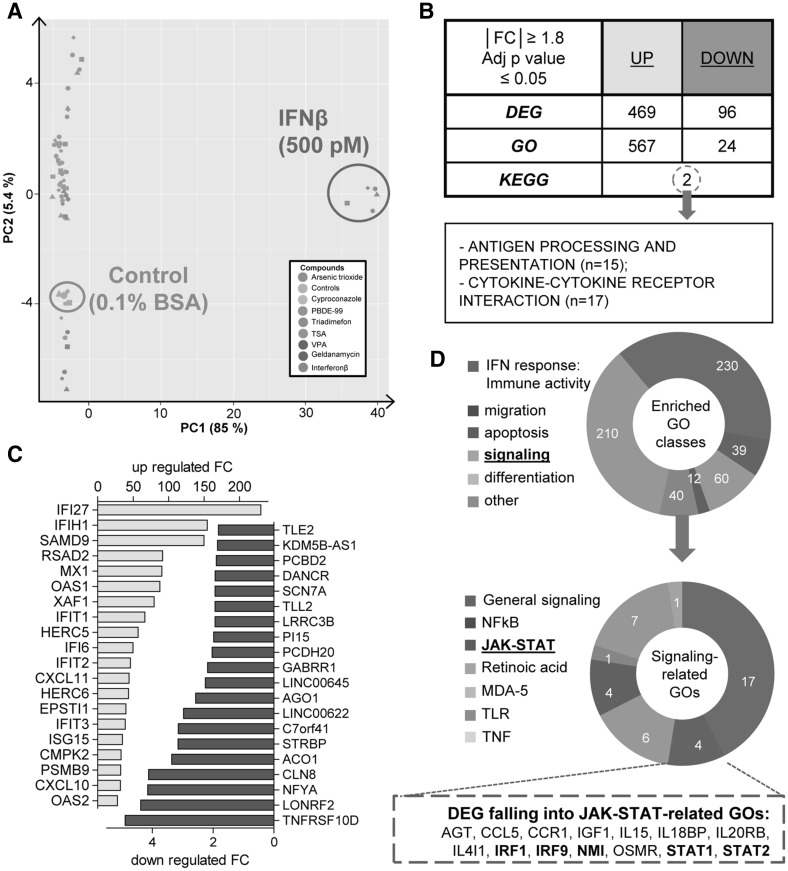
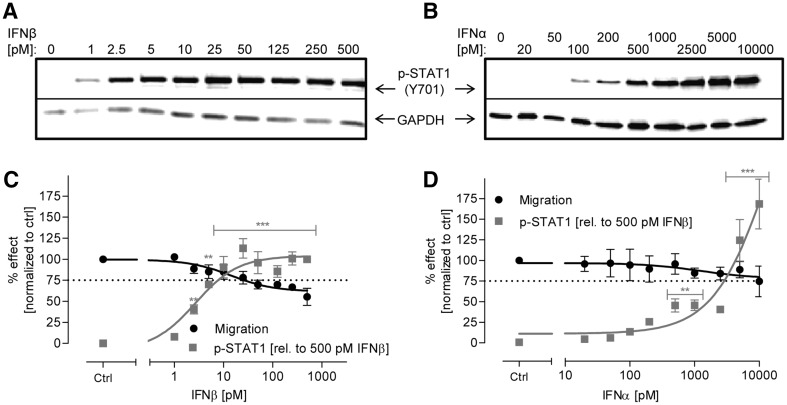
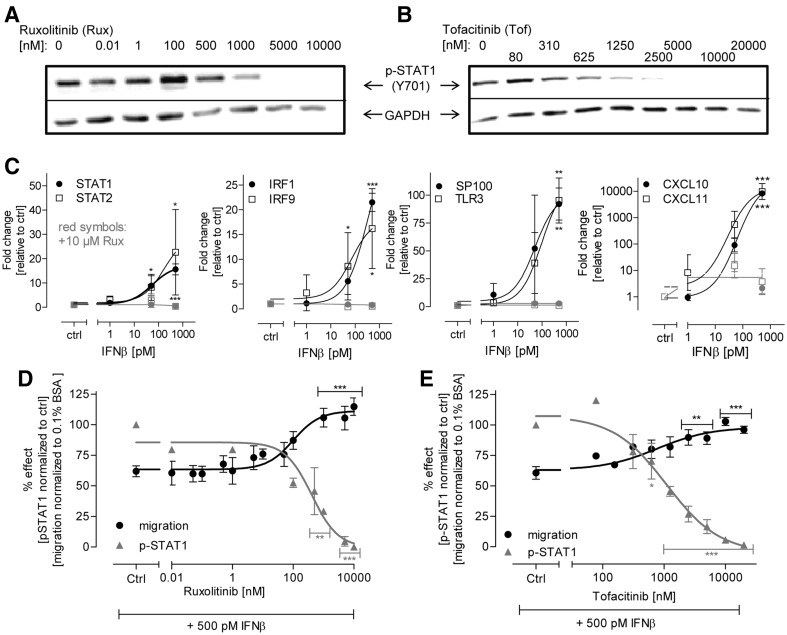
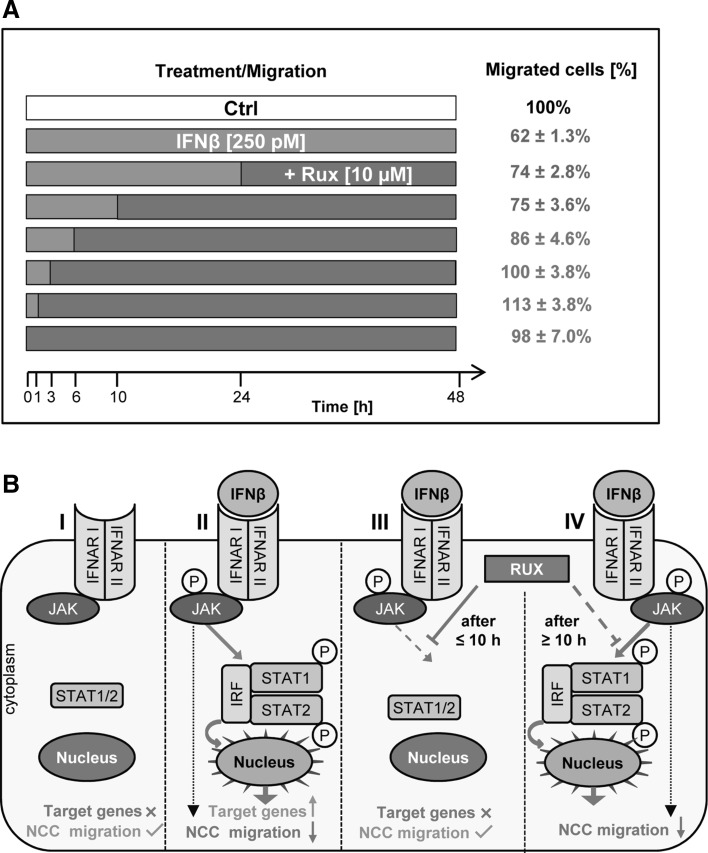
Human cell-based toxicological assays have been used successfully to detect known toxicants, and to distinguish them from negative controls. However, there is at present little experience on how to deal with hits from screens of compounds with yet unknown hazard. As a case study to this issue, we characterized human interferon-beta (IFNβ) as potential developmental toxicant affecting neural crest cells (NCC). The protein was identified as a hit during a screen of clinically used drugs in the 'migration inhibition of neural crest' (MINC) assay. Concentration-response studies in the MINC combined with immunocytochemistry and mRNA quantification of cellular markers showed that IFNβ inhibited NCC migration at concentrations as low as 20 pM. The effective concentrations found here correspond to levels found in human plasma, and they were neither cytostatic nor cytotoxic nor did they did they affect the differentiation state and overall phenotype of NCC. Data from two other migration assays confirmed that picomolar concentration of IFNβ reduced the motility of NCC, while other interferons were less potent. The activation of JAK kinase by IFNβ, as suggested by bioinformatics analysis of the transcriptome changes, was confirmed by biochemical methods. The degree and duration of pathway activation correlated with the extent of migration inhibition, and pharmacological block of this signaling pathway before, or up to 6 h after exposure to the cytokine prevented the effects of IFNβ on migration. Thus, the reduction of vital functions of human NCC is a hitherto unknown potential hazard of endogenous or pharmacologically applied interferons.

Keywords: Cell migration; Developmental toxicity; Interferons; JAK-STAT pathway; Neural crest.


Conflict of interest statement

The authors declare no conflict of interest.

Figures

Fig. 1
Fig. 1
Impaired migration of NCC in the presence of IFNβ. a NCC were allowed to attach and recover for 24 h. Then, migration was started and, 48 h later, the number of migrated cells and the viability of the cell population were quantified. In standard experiments, NCC were exposed to IFNβ (marked in green) for the entire migration period. b NCC were exposed to IFNβ at the indicated concentrations. Cell viability and the number of migrated cells are expressed relative to control cells (Ctrl, 0.1% BSA in PBS). In one series of experiments (right graph), the cell culture medium used for all conditions was supplemented with the mitosis inhibitor cytosine arabinoside (AraC, 10 µM). Data are from three independent experiments. Error bars indicate standard deviations (SD). Statistics was performed for each endpoint by ANOVA, followed by Dunnet’s post-hoc test (*p ≤ 0.05, **p ≤ 0.01, ***p ≤ 0.001). Viability was considered to be impaired when it dropped below 90%; migration was considered to be impaired below 75%, compared to control (dotted lines at 75 and 90% are indicated for visual support). c Representative pictures of different migration assay exposure scenarios, taken at time 48 h. Nuclei are depicted in red (H-33342), while viable cells are shown in green (calcein). d NCC were exposed to culture medium supplemented with 5-ethynyl-2′-deoxyuridine (EdU, 10 µM) and they were treated with AraC (10 µM) or the respective control (Ctrl) for 48 h. Then, cells were stained with H-33342 (nuclei), and EdU-positive cells (EdU+) were quantified. Cell proliferation was expressed as percentage of EdU + cells out of the total number of cell nuclei. (Color figure online)
Fig. 2
Fig. 2
Specificity of IFNβ effects on NCC. NCC were treated for 48 h with interferons, while they were allowed to migrate. Then, the viability and the inhibition of cell migration were measured. All assays were performed either with or without cytosine arabinoside (AraC, 10 µM) as culture medium supplement. a, b Testing of interferon-α (IFNα) and interferon-γ (IFNγ). Data are from three independent experiments. Error bars indicate standard deviations (SD). Statistics was performed for each endpoint by ANOVA, followed by Dunnet’s post-hoc test (*p ≤ 0.05, **p ≤ 0.01, ***p ≤ 0.001). c EC75 and the lowest observed adverse effect level (LOAEL) were compiled for each scenario. The LOAEL was defined as the lowest concentration triggering a significant reduction of cell migration (p ≤ 0.05). d Human breast cancer cells MDA-MD-231 were allowed to migrate for 48 h, before viability and the number of migrated cells were quantified. Cells were treated with the indicated concentrations of IFNβ for the total migration period, either with or without cytosine arabinoside (AraC, 10 µM) as culture medium supplement
Fig. 3
Fig. 3
Maintenance of basic NCC functions and morphology in the presence of IFNβ. a NCC were treated with IFNβ (500 pM) or solvent (Ctrl) for 48 h, allowed to migrate in the last 6 h of the treatment period, and finally fixed for immunofluorescence staining. The microfilament cytoskeleton was visualized by phalloidin; antibodies to TOM20 were used to visualize mitochondria and anti-GM130 for the Golgi apparatus. b NCC were seeded for 0, 6, and 24 h (adhesion time) in culture medium supplemented with IFNβ (500 pM) or solvent. Then, cells were lysed and the amount of phosphorylated FAK was measured by Western blot analysis. The mean intensity of each band normalized to the respective loading control (GAPDH) ± SD is reported below each condition (n = 3). In the control (0 h = non-adherent cells), no band was detected. No significant change was observed between control and treatments at 6 and 24 h. c NCC were exposed to a cytokine mix (CM, 10 ng/ml TNFα, and 10 ng/ml IL1β), IFNβ (500 pM) or a combination of both for 1 h. Cells were then fixed and stained for nuclear factor kB (NFkB, green). Representative pictures for each condition are shown, with nuclei counterstained with H-33342 (red). Nuclei with translocated NFkB appear yellow, instead of red (non-translocated NFkB). (Color figure online)
Fig. 4
Fig. 4
Confirmation of impaired NCC migration in the presence of IFNβ in secondary functional assays. a NCC were allowed to migrate for 48 h, and they were exposed to IFNβ at the indicated concentrations for the entire migration period. Phase contrast images were taken every 15 min during the last 30 h of migration for cell tracking. b Representative migration tracks for the control and 500 pM IFNβ-treated cells are shown. Tracks are normalized to the same starting point (blue circle); x and y dimensions are scaled similarly (see scale bar). c Averaged accumulated distance covered by the cells was then calculated for each test concentration. At least 10 cells were followed for each condition (= 1 technical replicate). The number of independent replicates for each condition is reported in the graph. Error bars indicate standard deviations (SD). Statistics is based on t test analysis between control and maximal IFNβ concentration samples (**p ≤ 0.01); an ANOVA across all data, followed by Dunnet’s post-hoc test yielded the same significance level for 500 pM IFNβ. d NCC pre-treated for 42 h with IFNβ or solvent were seeded into transwells. Then, the cells were induced to migrate through the transwell porous membrane by addition of 5% FBS into the lower chamber of the transwell, in the presence of IFNβ (500 pM) or respective control. After additional 6 h in the presence or absence of IFNβ, migrated cells were stained with crystal violet. Four fields per replicate were imaged, and the cells were counted. e Quantification of the number of migrated cells for the different conditions: the total IFNβ exposure period is indicated; data are from four independent experiments. Error bars indicate standard deviations (SD). *p ≤ 0.05. (Color figure online)
Fig. 5
Fig. 5
Transcriptome changes triggered by IFNβ in NCC. Sampling for microarray analysis was performed in NCC after 48-h exposure to non-cytotoxic, but migration-inhibiting, concentrations of eight test battery hits, as identified in Zimmer et al. (2014). Data are from five independent experiments (= data points of one colour, but different shapes). a Principal component analysis (PCA) was performed, and a 2D plot was generated to display the transcriptome data structure across compounds and experimental replicates. The positions of IFNβ-exposed samples, and the respective control, are circled. On the axes, the first two principal components are plotted, and the percentage of covered variances is reported. b Number of differentially up-regulated (UP) or down-regulated (DOWN) genes (DEG, IFNβ vs control) and the corresponding biological processes (over-represented GO classes) was identified. Over-represented KEGG pathways were searched amongst all DEG (UP and DOWN), and the only two significant pathways are indicated. c Identified DEG were sorted according to their p value. The top 20 up- (yellow) and down- (blue) regulated genes are shown as bar graphs indicating the fold change (FC). Large regulation factors were observed especially for genes that showed very low expression in untreated cells (as is common for transcriptome analysis of inflammatory situations). The effect is unlikely to be due to baseline variations, as the sorting was done according to the p value for the regulation. d Ring diagrams show the relative distribution of 6 superordinate biological processes (IFN response, migration/chemotaxis, apoptosis, signaling, differentiation, and other) amongst the over-represented GO classes (upper ring) and the number of the different signaling-related over-represented GO classes (lower ring). Genes with a central role in the JAK-STAT pathway are depicted in bold. (Color figure online)
Fig. 6
Fig. 6
Correlation between JAK-STAT pathway activation and inhibition of NCC migration upon treatment with class I IFN. a, b NCC were exposed to the indicated concentrations of IFNβ and IFNα for 1 h. Then, cells were harvested and protein samples were prepared. The amount of phosphorylated STAT1 (p-Tyr701) was measured by western blot analysis (representative blots are shown). c, d Band intensity was quantified and normalized to the respective GAPDH antibody band. For better comparison, the migration inhibition data from Fig. 1b are shown in black in the same graph. Data are means from three independent experiments. Error bars indicate standard deviations (SD). Statistical analysis was based on ANOVA, followed by Dunnet’s post-hoc test (*p ≤ 0.05, **p ≤ 0.01, ***p ≤ 0.001)
Fig. 7
Fig. 7
Abolishment of the effect of IFNβ on NCC migration by inhibition of the JAK-STAT pathway. a, b NCC were pre-treated for 0.5 h with two different JAK inhibitors (ruxolitinib and tofacitinib) at the indicated concentrations. Then, the cells were further treated for 1 h with the inhibitors in cell culture medium supplemented with 500 pM IFNβ. Finally, cells were harvested and the amount of phosphorylated STAT1 (p-STAT1) was measured by western blot analysis (representative blots are shown). c NCC were exposed to IFNβ for 48 h at the indicated concentrations, either with or without ruxolitinib (Rux, 10 µM). Then, cells were harvested, and total RNA was extracted and retro-transcribed. Effects on selected mRNAs were evaluated by qPCR. Expression levels were normalized against the housekeeping gene, GAPDH and are expressed relative to control levels (untreated cells). The mRNA expression in the presence of Rux is shown in red. Note that the red symbols are often overlapping, due to complete inhibition down to control levels. d, e Band intensities were quantified for p-STAT1 (normalized to GAPDH). In a parallel set of experiments, migration (after 48 h) was evaluated in the presence of IFNβ (500 pM) plus ruxolitinib (left) or tofacitinib (right). Data are from three independent experiments. Error bars indicate standard deviations (SD). Statistics was performed by ANOVA, followed by Dunnet’s post-hoc test (*p ≤ 0.05, **p ≤ 0.01, ***p ≤ 0.001). (Color figure online)
Fig. 8
Fig. 8
Requirement for continued JAK-STAT signaling to NCC migration impairment. a NCC were allowed to migrate for 48 h. During this time, they were exposed to IFNβ while ruxolitinib (10 µM) was added to the culture medium at different time points after the start of the migration. The percentage of migrated cells was quantified for all conditions after 48 h. Migration was inhibited ≥25% in all conditions denoted in blue. Ruxolitinib without IFNβ had no effect on migration. b Graphical representation of the effects of IFNβ and JAK-STAT pathway-inhibitors on the transcription of target genes and on the functionality of NCC. NCC migration was unimpaired in the absence of IFNβ or when IFNβ was present together with ruxolitinib. NCC migration was impaired when IFNβ was present alone, or when ruxolitinib was added ≥10 h after IFNβ. (Color figure online)

References

    1. Alam JMA, Scaramucci J, Jones W, Rogge M. Pharmacokinetics and pharmacodynamics of interferon Beta-la (IFNβ-1a) in healthy volunteers after intravenous, subcutaneous or intramuscular administration. Clin Drug Investig. 1997;14:35. doi: 10.2165/00044011-199714010-00005. - DOI
    1. Alexa A, Rahnenfuhrer J, Lengauer T. Improved scoring of functional groups from gene expression data by decorrelating GO graph structure. Bioinformatics. 2006;22(13):1600–1607. doi: 10.1093/bioinformatics/btl140. - DOI - PubMed
    1. Amato MP, Portaccio E, Ghezzi A, Hakiki B, Zipoli V, Martinelli V, et al. Pregnancy and fetal outcomes after interferon-beta exposure in multiple sclerosis. Neurology. 2010;75(20):1794–1802. doi: 10.1212/WNL.0b013e3181fd62bb. - DOI - PubMed
    1. Aschner M, Ceccatelli S, Daneshian M, Fritsche E, Hasiwa N, Hartung T, et al. Reference compounds for alternative test methods to indicate developmental neurotoxicity (DNT) potential of chemicals: example lists and criteria for their selection and use. Altex. 2017;34(1):49–74. - PMC - PubMed
    1. Balmer NV, Weng MK, Zimmer B, Ivanova VN, Chambers SM, Nikolaeva E, et al. Epigenetic changes and disturbed neural development in a human embryonic stem cell-based model relating to the fetal valproate syndrome. Hum Mol Genet. 2012;21(18):4104–4114. doi: 10.1093/hmg/dds239. - DOI - PubMed