. 2017 Apr 6;169(2):301-313.e11.
doi: 10.1016/j.cell.2017.03.011. Epub 2017 Mar 30.

RIPK3 Restricts Viral Pathogenesis via Cell Death-Independent Neuroinflammation

Affiliations

RIPK3 Restricts Viral Pathogenesis via Cell Death-Independent Neuroinflammation

Brian P Daniels et al. Cell. .

Abstract

Receptor-interacting protein kinase-3 (RIPK3) is an activator of necroptotic cell death, but recent work has implicated additional roles for RIPK3 in inflammatory signaling independent of cell death. However, while necroptosis has been shown to contribute to antiviral immunity, death-independent roles for RIPK3 in host defense have not been demonstrated. Using a mouse model of West Nile virus (WNV) encephalitis, we show that RIPK3 restricts WNV pathogenesis independently of cell death. Ripk3-/- mice exhibited enhanced mortality compared to wild-type (WT) controls, while mice lacking the necroptotic effector MLKL, or both MLKL and caspase-8, were unaffected. The enhanced susceptibility of Ripk3-/- mice arose from suppressed neuronal chemokine expression and decreased central nervous system (CNS) recruitment of T lymphocytes and inflammatory myeloid cells, while peripheral immunity remained intact. These data identify pleiotropic functions for RIPK3 in the restriction of viral pathogenesis and implicate RIPK3 as a key coordinator of immune responses within the CNS.

Keywords: RIPK1; RIPK3; West Nile virus; chemokines; necroptosis; neuroimmunology; neuroinflammation.


Figures

Figure 1
Figure 1. RIPK3 limits WNV pathogenesis independently of MLKL and cell death
(A) Survival analysis in 8 week old Ripk3−/− mice and age/sex matched congenic C57BL/6NJ controls (B6/N) following subcutaneous inoculation with 100pfu WNV-TX. N= 9 mice/genotype. (B) Presentation of clinical signs of disease in B6/N or Ripk3−/− mice on indicated days following subcutaneous WNV infection. N= 9 mice/genotype. (C) Survival analysis in 8 week old Mlkl−/− mice and age/sex matched congenic C57BL/6J controls (B6/J) following subcutaneous inoculation with 100pfu WNV-TX. N= 15(B6/J) or 13 (Mlkl−/−). (D) Kinetics of cell death in primary bone-marrow derived macrophage (BMDM) or cortical neuron (CN) cultures after infection with 0.01 (BMDM) or 0.001 (CN) MOI WNV-TX, with or without co-treatment with the pan-caspase inhibitor zVAD. Cell death was determined by Sytox Green uptake and quantified as the percent of total cell nuclei that are Sytox Green-positive. N= 3 (BMDM) or 6 (CN). (E–H) 8 week old B6/N or Ripk3−/− mice were infected subcutaneously with 100 pfu WNV-TX. On indicated days following infection, the indicated tissues were harvested, weighed, homogenized, and assayed for WNV titers via qRT-PCR (E,G) or plaque assay (F,H). qRT-PCR data are normalized against a standard curve of known viral titers to generate plaque-forming unit (pfu) equivalents (E,G). -**p<0.01, ***p<0.001. Error bars represent SEM. Dotted lines indicate limits of detection. All data are pooled from two or three independent experiments. See also related figures S1 and S2.
Figure 2
Figure 2. RIPK3 restricts WNV replication in the CNS in a neuron-extrinsic manner
(A–D) 8 week old B6/N or Ripk3−/− mice were infected subcutaneously with 100 pfu WNV-TX. On indicated days following infection, the indicated tissues were harvested, weighed, homogenized, and WNV titers measured via plaque assay. (E) Survival analysis in 8 week old Ripk3−/− mice and age/sex matched congenic C57BL/6NJ controls (B6/N) following intracranial inoculation with 10pfu WNV-TX. N=6 mice/genotype. (F) 8 week old B6/N or Ripk3−/− mice were infected intracranially with 10 pfu WNV-TX. On indicated days following infection, whole brains were harvested, weighed, homogenized, and WNV titers were measured via plaque assay. (G) Multistep viral growth curve analysis in primary B6/N or Ripk3−/− cortical neuron or cerebellar granule cell neuron cultures following infection with 0.001 MOI WNV-TX. N= 9 (C) or 6 (D). -*p<0.05, **p<0.01, ***p<0.001. Dotted lines indicate limits of detection. All data are pooled from two or three independent experiments. See also related figure S3.
Figure 3
Figure 3. RIPK3-mediated neuronal chemokine expression occurs downstream of multiple TLRs and requires the kinase activity of RIPK1 and RIPK3
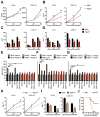
(A–D) CCL2 or CXCL10 expression in B6/N or Ripk3−/− cortical neuron cultures following infection with 0.001 MOI WNV-TX (A–B) or treatment with 1 μg/ml poly(I:C) (C–D), measuring protein in supernatant via Bio-plex multiplex immunoassay assay (A,C) or mRNA expression in cells via qRT-PCR (B,D). N=3–6 replicates/group. (E–G) CCL2 expression measured by ELISA in cortical neuron culture supernatants after 24h treatment with 1 μg/ml poly(I:C) (E), 1 μg/ml LPS (F), or 1 μg/ml CL264 (G). Prior to addition of TLR agonist, cells were pretreated for 1h with 30 μM Necrostatin-1 (Nec), 100 nM GSK 843, and/or 2 μM QVD. Inhibitors remained in culture medium for the duration of the experiment. As experiments in (C–E) happened concurrently, data with each TLR agonist is compared against a single set of vehicle controls (gray and orange bars), the data for which is repeated in each panel. N=4 replicates/group. (H–I) CCL2 or CXCL10 expression in B6/J or Ripk1KD/KD cortical neuron cultures following infection with 0.001 MOI WNV-TX (H) or treatment with 1 μg/ml poly(I:C) (I), measured via qRT-PCR. N=4 replicates/group. (J) Survival analysis in 8 week old Ripk1KD/KD mice and B6/J controls following subcutaneous inoculation with 100pfu WNV-TX. N=7 mice/genotype. -*p<0.05, **p<0.01, ***p<0.001. Error bars represent SEM. All data are pooled from at least two independent experiments. See also related figures S4 and S5.
Figure 4
Figure 4. RIPK3 activation alone is sufficient to drive neuronal chemokine expression
A) Schematic illustrating the transgene construct and Cre-mediated deletion of the stop cassette driving transgene expression. (B) DNA gels depicting genotyping strategy for RIPK3-2xFVfl/fl Mox2-Cre+ mice. Top row: presence of RIPK3-2xFV transgene; second row: RIPK3-2xFV transgene with deleted stop cassette; third row: confirmation of transgene homozygosity by detecting absence of WT Rosa26 locus; fourth row: detection of Mox2-Cre expression (smaller bp product). See methods. (C) Western blot confirmation of FKBP expression in murine embryonic fibroblast (MEF) and cortical neuron cultures. Actin is included as a housekeeping control. (D,G) Immunocytochemical detection of mCherry (red) and DAPI (blue) in primary murine embryonic fibroblast (MEF) (D) or cortical neuron cultures (G) of the indicated genotype. Images are representative of 3 replicates/genotype. Scale bar= 20μm (D) or 40μm (G). (E, H) Kinetics of cell death in primary RIPK3-2xFVfl/fl Mox2-Cre+ primary MEF (E) or cortical neuron cultures (H) after treatment with 100nM AP1 in the presence of indicated inhibitors. Combined treatment with TNF-α and cycloheximide served as a positive control for cell death (H). Cell death was determined by Sytox Green uptake and quantified as the percent of total cell nuclei that are Sytox Green-positive. N= 2–4 replicates/group. (F, I) CCL2 expression measured by ELISA in supernatants of RIPK3-2xFVfl/fl MEF (F) or cortical neuron (I) cultures of indicated genotype 24h after treatment with AP1 and/or indicated inhibitors. N= 3 replicates/group. ***p<0.001. Error bars represent SEM. All data are pooled from at least two independent experiments.
Figure 5
Figure 5. RIPK3 enhances CNS chemokine expression after WNV infection
(A–B) CCL2 (left) or CXCL10 (right) protein expression as determined by Bio-plex protein immunoassay in clarified brain homogenates taken on indicated days after either intracranial (A) or subcutaneous (B) WNV infection. (C–D) CCL2 (left) or CXCL10 (right) mRNA expression as determined by qRT-PCR using RNA extracted from whole brains taken on indicated days after either intracranial (C) or subcutaneous (D) WNV infection. Data are expressed as ΔΔCT, wherein CT values for individual samples are first normalized to the housekeeping gene Gapdh, then normalized against values for uninfected controls. -*p<0.05, **p<0.01, ***p<0.001. Error bars represent SEM. N=6 for all panels. Data are pooled from two independent experiments. See also related figure S6.
Figure 6
Figure 6. RIPK3 coordinates CNS immune cell infiltration after WNV infection
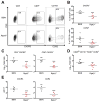
(A–F) Total brain leukocytes were isolated from B6/N or Ripk3−/− mice on day 8 following subcutaneous inoculation with WNV-TX. (A) Representative flow cytometric plots showing CD4+ and CD8+ T cells among total brain leukocytes. Numbers represent percentage of cells in each gate relative to total plotted cells. (B) Percentage (top row) and numbers (bottom row) of CD4+ and CD8+ T cells among total brain leukocytes. (C) Representative plots showing cells stained with a tetramer displaying the immunodominant WNV peptide Db-NS4B (NS4B) after prior gating for CD3hi and CD8+ cells. (D) Percentage of NS4B tetramer+ cells among total CD8+ T cells (top) or total number of CD8+ NS4B+ T cells collected from total brain leukocytes (bottom). (E) Representative plots showing CD45lo vs. CD45hi expressing cells after prior gating for CD11b+ cells. (F) Percentage of CD45hi cells among total CD11b+ cells (top left) or total numbers of cells expressing indicated markers collected from total brain leukocytes (top right and bottom row). -*p<0.05, **p<0.01, ***p<0.001. Data are pooled from two or three independent experiments. See also related figure S7.
Figure 7
Figure 7. RIPK3 mediates CNS recruitment of CXCR3+ and CCR2+ infiltrating leukocytes
(A–F) Total brain leukocytes were isolated from B6/N or Ripk3−/− mice on day 8 following subcutaneous inoculation with WNV-TX. (A) Representative flow cytometric plots showing CXCR3+ cells after prior gating for CD3 or CD3+ cells (left) or CCR2+ cells after prior gating for CD11b+ cells. Numbers represent percentage of cells in each gate relative to total plotted cells. (B) Percentages of CXCR3+ cells among total CD3hi cells (top) or CCR2+ cells among total CD11b+ cells (bottom). (C–D) Total numbers of cells expressing indicated markers collected from total brain leukocytes. (E) qRT-PCR analysis of CXCR3 or CCR2 expression using RNA extracted from whole brains on day 8 following subcutaneous WNV infection. -**p<0.01, ***p<0.001. All data are pooled from two independent experiments.

Comment in

Similar articles

Cited by

References

    1. Bardina SV, Michlmayr D, Hoffman KW, Obara CJ, Sum J, Charo IF, Lu W, Pletnev AG, Lim JK. Differential Roles of Chemokines CCL2 and CCL7 in Monocytosis and Leukocyte Migration during West Nile Virus Infection. J Immunol. 2015;195:4306–4318. - PMC - PubMed
    1. Beisner DR, Ch’en IL, Kolla RV, Hoffmann A, Hedrick SM. Cutting edge: innate immunity conferred by B cells is regulated by caspase-8. J Immunol. 2005;175:3469–3473. - PubMed
    1. Berger SB, Harris P, Nagilla R, Kasparcova V, Hoffman S, Swift B, Dare L, Schaeffer M, Capriotti C, Ouellette M, et al. Characterization of GSK’963: a structurally distinct, potent and selective inhibitor of RIP1 kinase. Cell Death Discov. 2015;1:15009. - PMC - PubMed
    1. Berger SB, Kasparcova V, Hoffman S, Swift B, Dare L, Schaeffer M, Capriotti C, Cook M, Finger J, Hughes-Earle A, et al. Cutting Edge: RIP1 kinase activity is dispensable for normal development but is a key regulator of inflammation in SHARPIN-deficient mice. J Immunol. 2014;192:5476–5480. - PMC - PubMed
    1. Brien JD, Lazear HM, Diamond MS. Propagation, quantification, detection, and storage of West Nile virus. Current protocols in microbiology. 2013;31:15D 13 11–15D 13 18. - PubMed

Substances