. 2017 Apr 11;8(4):856-869.
doi: 10.1016/j.stemcr.2017.02.019. Epub 2017 Mar 30.

Genetic Correction of SOD1 Mutant iPSCs Reveals ERK and JNK Activated AP1 as a Driver of Neurodegeneration in Amyotrophic Lateral Sclerosis

Affiliations

Genetic Correction of SOD1 Mutant iPSCs Reveals ERK and JNK Activated AP1 as a Driver of Neurodegeneration in Amyotrophic Lateral Sclerosis

Akshay Bhinge et al. Stem Cell Reports. .

Abstract

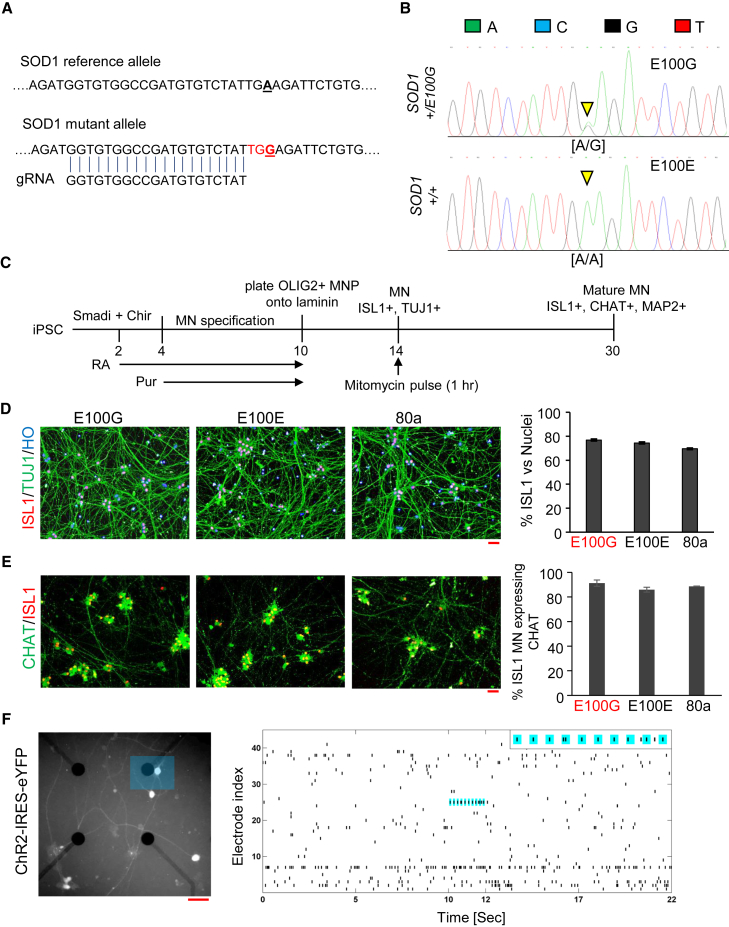
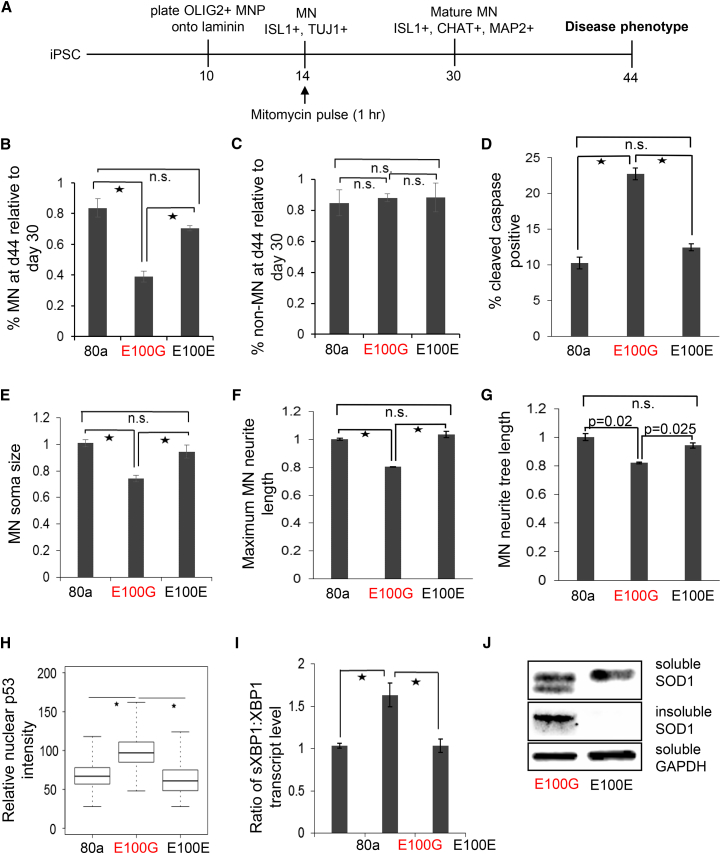
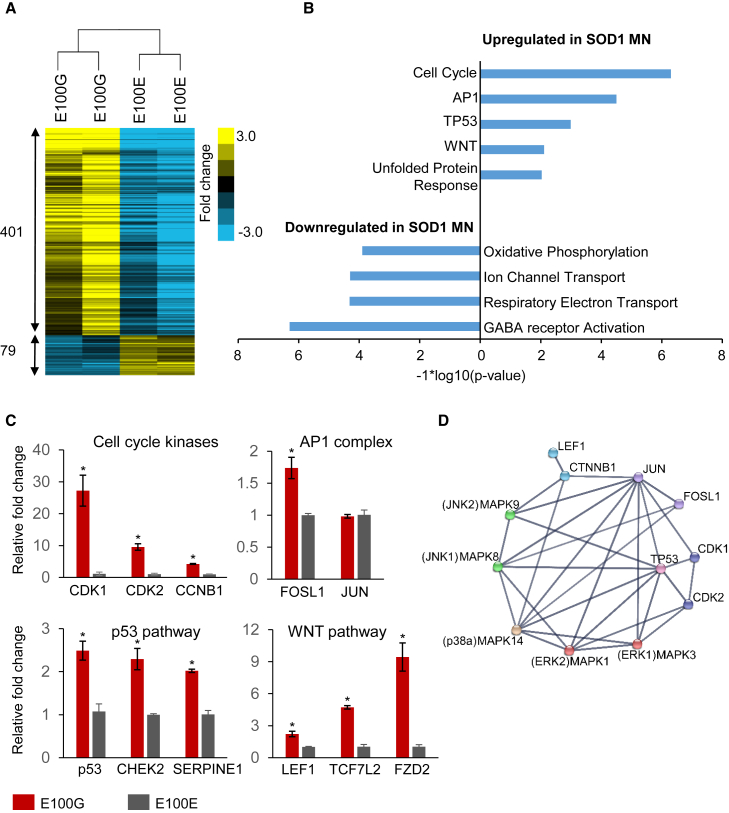
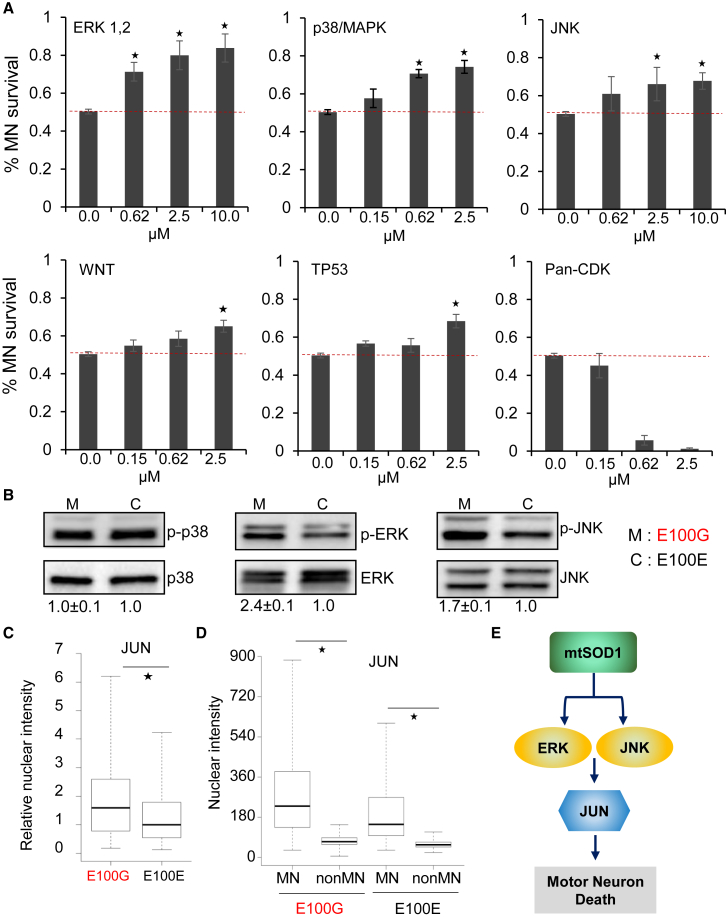
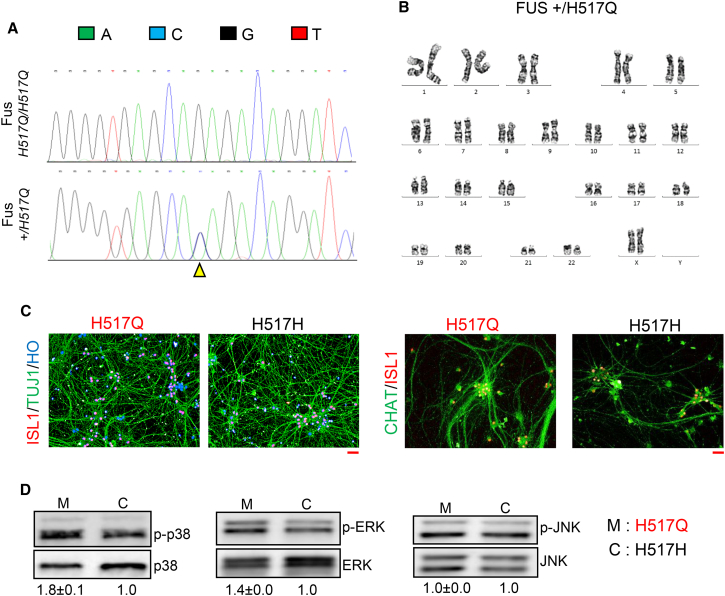
Although mutations in several genes with diverse functions have been known to cause amyotrophic lateral sclerosis (ALS), it is unknown to what extent causal mutations impinge on common pathways that drive motor neuron (MN)-specific neurodegeneration. In this study, we combined induced pluripotent stem cells-based disease modeling with genome engineering and deep RNA sequencing to identify pathways dysregulated by mutant SOD1 in human MNs. Gene expression profiling and pathway analysis followed by pharmacological screening identified activated ERK and JNK signaling as key drivers of neurodegeneration in mutant SOD1 MNs. The AP1 complex member JUN, an ERK/JNK downstream target, was observed to be highly expressed in MNs compared with non-MNs, providing a mechanistic insight into the specific degeneration of MNs. Importantly, investigations of mutant FUS MNs identified activated p38 and ERK, indicating that network perturbations induced by ALS-causing mutations converge partly on a few specific pathways that are drug responsive and provide immense therapeutic potential.

Keywords: ALS; CRISPR-Cas9; ERK; FUS; JNK; JUN; SOD1; TP53; WNT; p38.


Figures

Figure 1
Figure 1
Generation of Isogenic Controls and Spinal Motor Neurons (A) Guide-RNA design and targeting of the SOD1 mutant allele. Genomic sequence around the SOD1 mutant allele is shown with the reference and mutant allele (bold and underlined). The guide RNA is shown aligned with the mutant locus with the PAM recognition sequence highlighted in red. (B) Chromatogram showing CRISPR-Cas9-mediated genome correction of SOD1+/E100G (designated E100G) to SOD1+/+ (designated E100E). The inverted yellow triangles indicate the heterozygous point mutation A/G (upper panel) and the corresponding homozygous A/A genotype (lower panel) upon genome correction. (C) Schematic illustrating differentiation of iPSCs into spinal MNs. Smadi, dual SMAD inhibition using SB431542 + LDN193189; Chir, CHIR99021; RA, retinoic acid; Pur, purmorphamine. (D) Differentiation of MNs from iPSCs. Neurons were immunostained for ISL1 (red) and TUJ1 (green). Nuclei were stained with Hoechst 33452 (blue). E100G, SOD1+/E100G; E100E, SOD1+/+; 80a, iPSCs from a healthy individual used as a control. (E) Quantitation of MNs staining positive for CHAT. Neurons were immunostained for ISL1 (red) and CHAT (green). (n = 3, error bars indicate SEM). (F) Left: Representative fluorescent image of the MEA to visualize eYFP expression. MNs co-expressed Channel Rhodopsin-2 (ChR2) with eYFP. The blue rectangle highlights the area stimulated with a 473 nm laser at 5 Hz (50% duty cycle) for 2 s. Right: Raster plots of action potentials recorded extracellularly from active electrodes of the MEA. In total, 42 active channels containing at least two spikes were plotted. The electrode adjacent to the optically stimulated neuron (blue rectangle in the left panel) detected spiking activity synchronized to the 5 Hz stimulus protocol. Inset: enlarged plot showing light-evoked spikes with blue background indicating when the light was on (see also Figure S1). All scale bars indicate 50 μM.
Figure 2
Figure 2
Modeling ALS In Vitro Using iPSC-Derived MNs (A) Schematic depicting the disease modeling protocol. (B) ALS MNs display a significant loss in survival compared with control MNs when plated at low density. Correction of the ALS-associated mutation rescues the observed phenotype. MNs were identified as ISL1+/TUJ1+ neurons. (C) ALS or control non-MNs, identified as ISL1-/TUJ1+, do not display a survival deficit. (D) ALS MN cultures at day 37 display a higher percentage of cells undergoing apoptosis as measured by cleaved caspase activity. (E) Quantitation of soma size for day 44 MNs. Soma size was normalized to control day 44 MNs. (F) Quantitation of maximum neurite length for day 44 MNs. Data were normalized to control day 44 MNs. (G) Quantitation of neurite tree length for day 44 MNs. Data were normalized to control day 44 MNs. (H) Immunofluorescence intensities of nuclear p53 in day 30 MNs. Values were normalized to control MNs. Data from three independent replicates were pooled to generate the boxplot and estimate the p values. (I) qRT-PCR data to measure the sXBP1:XBP1 ratio, an indicator of ER stress in day 37 MNs. Ratios were normalized to data from control MNs. (J) Western blot assay showing levels of detergent-soluble and insoluble SOD1 in ALS and control MN lysates at day 30. (B–I) n = 3, error bars indicate SEM; p < 0.01; n.s., not significant; p values were estimated using two-tailed Student’s t test. See also Figure S2.
Figure 3
Figure 3
RNA-Seq Analysis Identifies Signaling Pathways Dysregulated in ALS MNs (A) Dendrogram showing clustering of diseased and isogenic corrected samples based on transcriptional changes detected by RNA-seq. The number of genes differentially regulated in ALS MNs compared with isogenic control MNs are displayed. (B) GSEA detected gene sets activated and repressed in SOD1 MNs. (C) qRT-PCR to confirm activation of genes identified via RNA-seq. n = 3, error bars indicate SEM; p < 0.01; p values were estimated using two-tailed Student’s t test. (D) Network analysis of gene sets activated in SOD1 MNs. Data were obtained from the STRING database (Szklarczyk et al., 2015).
Figure 4
Figure 4
Identification of Pathways Driving Neurodegeneration in ALS MNs (A) Quantitation of ISL1-positive mutant SOD1 MNs after treatment with small-molecule inhibitors of the indicated pathways. n = 3, error bars indicate SEM; p < 0.01; p values were estimated using two-tailed Student’s t test. (B) Western blot analysis showing increased levels of phosphorylated ERK and JNK in mutant SOD1 MNs. Percentages relative to respective isogenic controls are displayed below each blot. Values underlined indicate increased levels of the detected proteins. Lysates from two independent replicates were pooled and assayed in triplicate. Data indicate means ± SEM. (C) Boxplot displaying nuclear intensities of p-JUN in ALS mutant MNs normalized to the respective isogenic controls. Data from three independent replicates were pooled to generate the boxplot and estimate the p values. p < 0.01; p values were estimated using two-tailed Student’s t test. (D) Boxplot displaying nuclear intensities of p-JUN in mutant SOD1 MNs and non-MNs as well as isogenic control MNs and non-MNs. Data from three independent replicates were pooled to generate the boxplot and estimate the p values. p < 0.01; p values were estimated using two-tailed Student’s t test. (E) Schematic depicting pathways activated by mutant SOD1 that drive neurodegeneration. See also Figure S3.
Figure 5
Figure 5
Mutant FUS MN Display Activated MAPK Signaling (A) Chromatogram showing correction of homozygous FUS H517Q/H517Q iPSCs (designated H517Q) to heterozygous FUS+/H517Q (designated H517H). The yellow triangle indicates the position of the homozygous point mutation G/G (upper panel) and the corresponding heterozygous C/G genotype (lower panel) upon genome correction. (B) Isogenic corrected iPSCs display a normal karyotype. (C) Mutant and isogenic corrected iPSCs differentiate into ISL1+/TUJ1+ MNs as well as ISL1+/CHAT+ MNs with similar efficiencies. (D) Western blot assay displaying activated p38 and ERK in mutant FUS MNs compared with the isogenic controls. JNK was not found to be activated in mutant FUS MNs. Lysates from two independent replicates were pooled and assayed in triplicate. Data indicate means ± SEM. All scale bars indicate 50 μM.

Similar articles

Cited by

References

    1. Al-Chalabi A., Jones A., Troakes C., King A., Al-Sarraj S., van den Berg L.H. The genetics and neuropathology of amyotrophic lateral sclerosis. Acta. Neuropathol. 2012;124:339–352. - PubMed
    1. Andersen P.M., Al-Chalabi A. Clinical genetics of amyotrophic lateral sclerosis: what do we really know? Nat. Rev. Neurol. 2011;7:603–615. - PubMed
    1. Bilican B., Serio A., Barmada S.J., Nishimura A.L., Sullivan G.J., Carrasco M., Phatnani H.P., Puddifoot C.A., Story D., Fletcher J. Mutant induced pluripotent stem cell lines recapitulate aspects of TDP-43 proteinopathies and reveal cell-specific vulnerability. Proc. Natl. Acad. Sci. USA. 2012;109:5803–5808. - PMC - PubMed
    1. Chen H., Qian K., Du Z., Cao J., Petersen A., Liu H., Blackbourn L.W.t., Huang C.L., Errigo A., Yin Y. Modeling ALS with iPSCs reveals that mutant SOD1 misregulates neurofilament balance in motor neurons. Cell Stem Cell. 2014;14:796–809. - PMC - PubMed
    1. Dafinca R., Scaber J., Ababneh N., Lalic T., Weir G., Christian H., Vowles J., Douglas A.G., Fletcher-Jones A., Browne C. C9orf72 hexanucleotide expansions are associated with altered endoplasmic reticulum calcium homeostasis and stress granule formation in induced pluripotent stem cell-derived neurons from patients with amyotrophic lateral sclerosis and frontotemporal dementia. Stem Cells. 2016;34:2063–2078. - PMC - PubMed

Publication types

MeSH terms

Substances