. 2017 Apr 6;66(1):63-76.e6.
doi: 10.1016/j.molcel.2017.02.020. Epub 2017 Mar 30.

Metazoan Nuclear Pores Provide a Scaffold for Poised Genes and Mediate Induced Enhancer-Promoter Contacts

Affiliations

Metazoan Nuclear Pores Provide a Scaffold for Poised Genes and Mediate Induced Enhancer-Promoter Contacts

Pau Pascual-Garcia et al. Mol Cell. .

Abstract

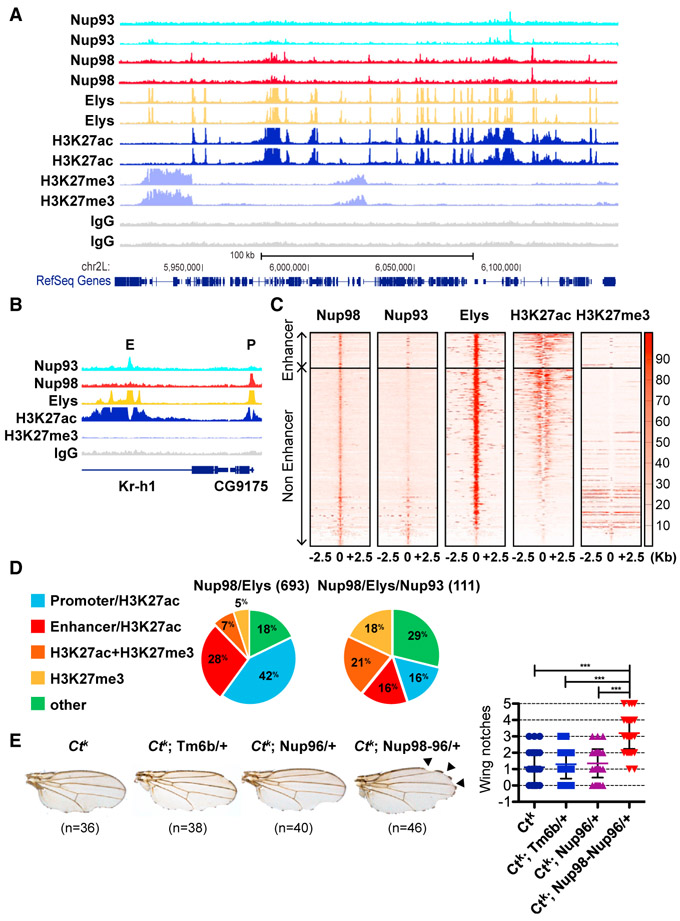
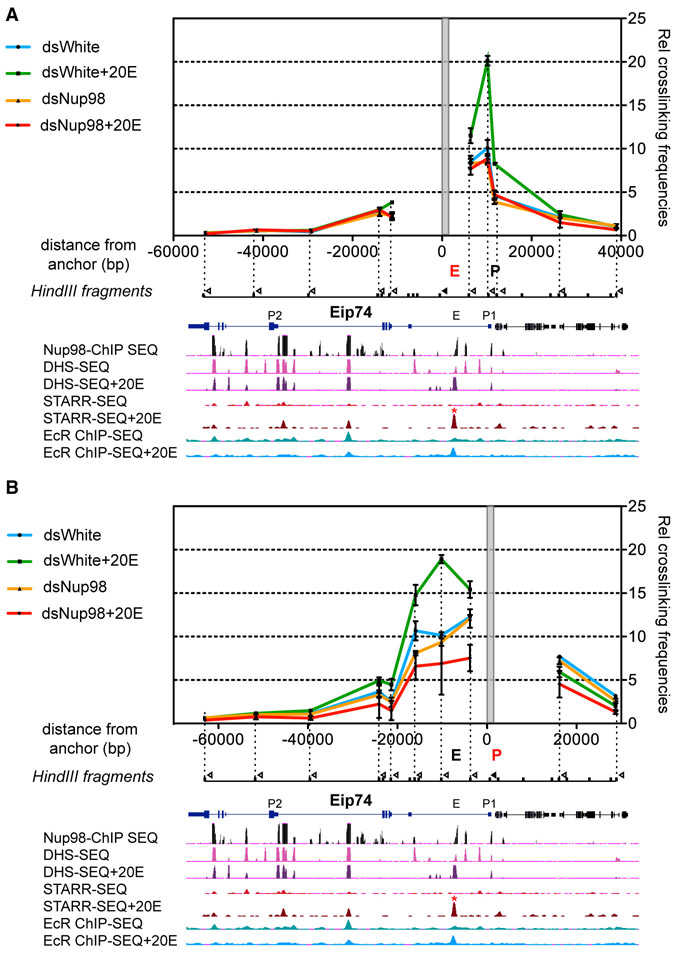
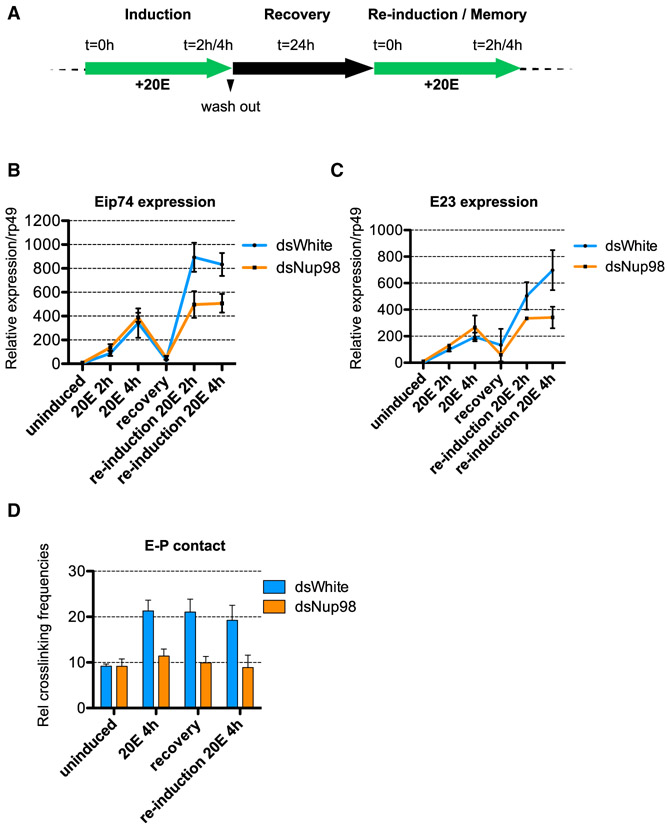
Nuclear pore complex components (Nups) have been implicated in transcriptional regulation, yet what regulatory steps are controlled by metazoan Nups remains unclear. We identified the presence of multiple Nups at promoters, enhancers, and insulators in the Drosophila genome. In line with this binding, we uncovered a functional role for Nup98 in mediating enhancer-promoter looping at ecdysone-inducible genes. These genes were found to be stably associated with nuclear pores before and after activation. Although changing levels of Nup98 disrupted enhancer-promoter contacts, it did not affect ongoing transcription but instead compromised subsequent transcriptional activation or transcriptional memory. In support of the enhancer-looping role, we found Nup98 to gain and retain physical interactions with architectural proteins upon stimulation with ecdysone. Together, our data identify Nups as a class of architectural proteins for enhancers and supports a model in which animal genomes use the nuclear pore as an organizing scaffold for inducible poised genes.

Keywords: Nup98; enhancer; genome architecture; looping; nuclear organization; nuclear pore complex; nucleoporin; poised genes; transcription; transcriptional memory.


Figures

Figure 1.
Figure 1.. Nup98 Binds Genomic Regulatory Elements, Including Enhancers and Insulators
(A) Enrichment heatmaps of Nup98 ChIP-seq compared with DHS sequencing (DHS-seq) in S2 cells (Shlyueva et al., 2014), sorted by Nup98 occupancy around center of Nup98 binding peaks. (B) Enrichment heatmaps of the non-promoter binding peaks of Nup98 ChIP-seq compared with enhancers (STARR-seq; Shlyueva et al., 2014) and ChIP-seq of insulators proteins(Wood et al., 2011; Yang et al., 2013), sorted by STARR-seq peak strength. (C) Distribution of Nup98 ChIP-seq binding peaks relative to genomic elements, obtained from comparisons in (B). (D) Representative genome browser (GB) view of a gene locus with Nup98 ChIP-seq, DHS-seq, and STARR-seq tracks. E and P mark the classified enhancer and promoters, respectively. (E) Top DNA-binding motifs enriched among binding sites of Nup98, with corresponding p values and percentages of Nup98-binding sites with a given motif. See also Figure S1 and Table S1.
Figure 2.
Figure 2.. Nuclear Pore Proteins Are Recruited to Enhancers in Fly Tissues
(A) A representative 200 kb GB snapshot (26AB on chromosome 2L), showing two independent replicates of Nup93, Nup98, Elys, H3K27acetyl (H3K27Ac), H3K27Me3, and control IgG ChIP-seq on brains from wandering third-instar larvae. (B) GB view of a representative locus, showing binding peaks of Nups to regions, classified as either enhancer (E) or promoter (P). Enhancers are H3K27Ac peaks that are more than 1 kb away from promoter/TSS regions. (C) Enrichment heatmaps of ChIP-seq-identified binding peaks for Nup98, Nup93, Elys, H3K27Ac, and H3K27me3, relative to centers of Nup98 binding peaks, sorted by H3K27Ac peak strength. (D) Distribution of Nup98/Elys and Nup98/Elys/Nup93 common peaks (number in parenthesis is total number of peaks). (E) Examples of wings from the listed genotypes in the ctK genetic background, demonstrating the enhancing effect of the Nup98 allele on the ctK wing-nicking phenotype (black arrows). The nicks/notches were quantified along the anterior half of the wing margin (p < 0.001 by Bonferroni method). See also Figure S2 and Tables S2, S3, and S4.
Figure 3.
Figure 3.. Nup98 Is Required for the Enhancer-Promoter Contact of Ecdysone-Inducible Genes
(A and B) Long-range genomic interaction analysis by 3C at the Eip74 locus in S2 cells, ± ecdysone/20E treatment. The relative level of each ligation product (relative crosslinking or interaction frequencies) for each indicated condition is plotted against the genomic distance away from the anchor point (marked by gray rectangle). Below the graph is GB view of the Eip74 locus, with Nup98 ChIP-seq, DHS-seq, STARR-seq, and EcR ChIP-seq binding tracks before and after 20E treatment (Shlyueva et al., 2014). The analyzed enhancer is marked with an asterisk. Black tick marks indicate Hind III restriction sites, vertical dotted lines correspond to the fragments investigated in 3C assay, and hollow triangles indicate the primers tested. The primer of the anchor point is represented by a black triangle, at the enhancer (A) or the promoter (B). Data were collected from S2 cells, treated with dsRNAs against either Nup98 or control dWhite, ± 20E treatment for 4 hr. Error bars represent SEM from three independent experiments. See also Figure S3.
Figure 4.
Figure 4.. Nup98 and the Enhancer-Promoter Loop Facilitate Transcriptional Memory
(A) Time course of induction and re-induction with ecdysone/20E. For initial induction, S2 cells were treated with 5 μM of 20E, and indicated time points were collected. Induced cells were cultured in fresh media without 20E for 24 hr, with the recovery time point collected at the end of this period, then reinduced with 5 μM of 20E for indicated time. (B and C) RT-qPCR analysis of the mRNA levels of Eip74 (B) and E23 (C), in S2 cells, treated as indicated (at time points in A) and normalized relative to rp49. Error bars represent SEM from three independent experiments. (D) Plot of the 3C relative interaction frequencies between Eip74 enhancer (anchor point, shown in Figure 3A) and promoter (at time points as in A), with and without Nup98 depletion, showing the presence of the induced enhancer-promoter contact during the recovery period. Error bars represent SEM from three independent biological replicates. See also Figure S4.
Figure 5.
Figure 5.. Increased Levels of Nup98 Disrupt Enhancer-Promoter Looping and Transcriptional Memory
(A) RT-qPCR analysis of the Eip74 mRNA levels in S2 cells, transfected with Nup98-Myc (pNup98-Myc) or control empty plasmids (at time points as in Figure 4A), normalized to rp49 and plotted against time. Error bars represent SEM from three independent experiments. (B) Western blot on S2 cells, transfected with Nup98 or control, ± 20E for 4 hr, stained with indicated antibodies and Ponceau S. (C and D) ChIP-seq with antibodies to endogenous Nup98 in control/normal versus Nup98 overexpressing S2 cells, represented by a plot of binding enrichment, oriented around the center of normal Nup98 binding peaks (C), and by enrichment heatmaps of Nup98 ChIP-seq peaks, sorted by control Nup98 ChIP-seq signal (D). (E) 3C interaction analysis at the Eip74 locus in S2 cells, transfected with Nup98-Myc or control, ± 20E for 4 hr. Relative crosslinking frequencies are plotted against genomic distance away from the enhancer (E) anchor point (marked by gray rectangle), with schematic and notation as in Figure 3. Error bars represent SEM of three independent experiments. See also Figure S5 and Table S5.
Figure 6.
Figure 6.. Metazoan Nuclear Pores Scaffold Inducible Genes Independently of Transcriptional State
(A) FISH analysis of nuclear localization of ecdysone-inducible genes in S2 cells, using probes against Eip74 and E23 (red) and co-stained with LaminDm0 (green) and Hoechst (blue). For assaying nuclear location, the nucleus was divided into three zones of equal volume, with zone 1 being the most peripheral and zone 3 most interior. The percentage of cells with FISH signal assigned into each zone is plotted to the right (scored cell number in parenthesis). Red dashed line indicates 33% distribution (random), and scale bar is set at 5 μm. (B) FISH analysis with Eip74 probe, performed at indicated time points (described in Figure 4A, plus a time point of 24 hr induction). (C) FISH analysis with Eip74 and E23 probes on S2 cells treated with dsRNAs against Nup98, co-stained with LaminDm0 and Hoechst. (D) FISH analysis with Eip74 probe (white arrow), performed on polytenized nuclei from salivary glands of third instar wandering larvae, co-stained with LaminDm0 and Hoechst. Orthogonal views were generated, as shown, to quantify and plot percentage of cells with signal co-localization between Lamin and FISH probe, which were scored as peripheral location (number of scored nuclei in parenthesis).
Figure 7.
Figure 7.. Nup98 Gains and Retains Interactions with Architectural Proteins upon Ecdsyone Treatment
(A) Model for the role of Nup98 in enhancer-promoter communication and transcriptional priming of inducible genes at the NPC. Nup98 is present at both enhancer and promoter regions before activation and upon induction with ecdysone, Nup98 mediates formation of the enhancer-promoter contact, which is propagated epigenetically to contribute to faster re-activation. (B and C) Co-IP analysis with anti-Nup98 (B), anti-CTCF, and anti-EcR (C) antibodies on S2 cell extracts, ± 20E for 4 hr, western-blotted with the indicated antibodies. (D) Co-IP analysis with anti-Nup98 antibody on S2 cell extracts at the recovery and re-induction time points (defined in Figure 4A), western-blotted with the indicated antibodies. See also Figure S6.

Comment in

Similar articles

Cited by

References

    1. Agrawal P, and Shashidhara LS (2014). ChIP for Hox proteins from Drosophila imaginal discs. Methods Mol. Biol 1196, 241–253. - PubMed
    1. Ahmed S, Brickner DG, Light WH, Cajigas I, McDonough M, Froyshteter AB, Volpe T, and Brickner JH (2010). DNA zip codes control an ancient mechanism for gene targeting to the nuclear periphery. Nat. Cell Biol 12, 111–118. - PMC - PubMed
    1. Arnold CD, Gerlach D, Stelzer C, Boryń LM, Rath M, and Stark A (2013). Genome-wide quantitative enhancer activity maps identified by STARR-seq. Science 339, 1074–1077. - PubMed
    1. Bernardo TJ, Dubrovskaya VA, Jannat H, Maughan B, and Dubrovsky EB (2009). Hormonal regulation of the E75 gene in Drosophila: identifying functional regulatory elements through computational and biological analysis. J. Mol. Biol 387, 794–808. - PubMed
    1. Bernardo TJ, Dubrovskaya VA, Xie X, and Dubrovsky EB (2014). A view through a chromatin loop: insights into the ecdysone activation of early genes in Drosophila. Nucleic Acids Res. 42, 10409–10424. - PMC - PubMed

MeSH terms