. 2017 Apr 6;66(1):77-88.e5.
doi: 10.1016/j.molcel.2017.02.023. Epub 2017 Mar 30.

Spt5 Plays Vital Roles in the Control of Sense and Antisense Transcription Elongation

Affiliations

Spt5 Plays Vital Roles in the Control of Sense and Antisense Transcription Elongation

Ameet Shetty et al. Mol Cell. .

Abstract

Spt5 is an essential and conserved factor that functions in transcription and co-transcriptional processes. However, many aspects of the requirement for Spt5 in transcription are poorly understood. We have analyzed the consequences of Spt5 depletion in Schizosaccharomyces pombe using four genome-wide approaches. Our results demonstrate that Spt5 is crucial for a normal rate of RNA synthesis and distribution of RNAPII over transcription units. In the absence of Spt5, RNAPII localization changes dramatically, with reduced levels and a relative accumulation over the first ∼500 bp, suggesting that Spt5 is required for transcription past a barrier. Spt5 depletion also results in widespread antisense transcription initiating within this barrier region. Deletions of this region alter the distribution of RNAPII on the sense strand, suggesting that the barrier observed after Spt5 depletion is normally a site at which Spt5 stimulates elongation. Our results reveal a global requirement for Spt5 in transcription elongation.

Keywords: Spt5; antisense transcription; convergent antisense transcription; transcription elongation.


Figures

Figure 1
Figure 1
Depletion of Spt5 using a degron allele. (A) The S. pombe spt5+ gene, diagramming the regions that encode the NGN, KOW, and CTR domains, and the system for Spt5 depletion upon addition of both thiamine (to repress transcription) and auxin (to induce protein degradation). (B) The Western blot showing the depletion of Spt5-V5-AID. The blot was probed with anti-V5 antisera. S. pombe Act1 served as a loading control. The labels 0 and 4.5 indicate the Spt5 degron strain before and 4.5 hours after the addition of thiamine and auxin respectively. The depletion condition shows the mean and standard deviation of Spt5 protein levels for three biological replicates. (C) A scatterplot comparing the spike-in normalized ChIP-seq level of Spt5 in non-depleted and depleted cells. (D) A metagene plot showing the spike-in normalized ChIP-seq levels of Spt5 over 4294 expressed genes. (E) An example of Spt5 ChIP-seq at a single gene, showing the levels of Spt5 before and after depletion at the plb1+ gene.
Figure 2
Figure 2
Spt5 is required for normal RNAPII localization. (A) A heatmap showing log2 ratios of spike-in normalized Rpb1 ChIP-seq density over 4294 expressed genes based on ChIP-seq, comparing depleted to non-depleted cells. Genes are sorted by length and aligned by their transcription start site (TSS). TSS and the cleavage/polyadenylation site (CPS) are indicated by the dotted green lines. (B) A similar heatmap based on log2 ratios of library-size-normalized NET-seq signal for the level of RNAPII on the sense strand. The NET-seq experiment was normalized by library size (see Methods). (C) A diagram depicting the calculation of the traveling ratio as the cumulative distribution function for the ratio of Rpb1 signal (in the case of ChIP-seq) or Rpb3 signal (in the case of NET-seq) over the first 500 bp of each transcript versus the last 500 bp of each transcript. (D) Traveling ratio for ChIP-seq for genes shown in 2A. Two replicates for Spt5 non-depleted and Spt5 depleted (red) are shown. (E) Traveling ratio plot for the NET-seq sense strand signal for genes shown in 2B, showing two replicates. (F) A scatterplot comparing the 3′-to-5′ shift in ChIP-seq and NET-seq signals over expressed genes after Spt5 depletion via the equation log2[ (5′T4.5/3′T4.5) / (5′T0/3′T0) ], using 500 bp bins.
Figure 3
Figure 3
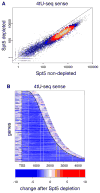
Spt5 is required for a normal rate of transcription genome-wide. (A) The scatter plot shows new RNA synthesis measured by 4tU-seq in Spt5-depleted versus non-depleted cells. Each point corresponds to the spike-in normalized signal from one transcript for merged replicate experiments. (B) The heatmap shows the log2 ratio of the spike-in normalized 4tU-seq signal in Spt5-depeleted versus non-depleted cells. The change is represented as described in Figure 2A. Genes are sorted by length and aligned by their TSS. The TSS and CPS are indicated by the solid black lines.
Figure 4
Figure 4
Spt5 is required for normal steady-state levels of mRNA and mRNA splicing. (A) The heatmap shows the log2 fold change of spike-in normalized RNA-seq signal for sense-strand transcripts. Each column depicts the signal for the indicated strain compared to one replicate for a wild-type untreated strain. Genes are arranged in rows and placed in three different bins, demarcated by the horizontal gaps, based on whether their mRNA level is increased greater than two-fold (yellow gradient), changed less than two-fold (gray), or decreased greater than two-fold (blue gradient) in the average of the Spt5-depleted samples. The lanes labeled “untagged” have an spt5+ wild-type allele and the strains labeled “Spt5-AID” have the depletion construct. Two replicates are shown for each strain except for the untagged T0 sample, as the other untagged T0 sample is the denominator for all columns. (B) The box plot depicts the distribution of splicing efficiencies (spliced/total reads at 5′ splice junctions) in the indicated strains from merged RNA-seq data from two biological replicates for each strain. The bars represent the median, 25%, and 75% quartile ranges. A value of 0 indicates no splicing and a value of 1 represents complete splicing. The dots represent the values for the individual measurements. (C) Single-gene profiles illustrate the increased RNA-seq signal over introns before and after Spt5 depletion. The exons are shown as boxes and the introns as lines connecting the exons.
Figure 5
Figure 5
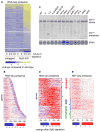
Spt5 represses convergent and divergent antisense transcription. (A) The heatmap shows the log2 fold change of spike-in normalized RNA-seq signal for transcripts on the antisense strand. Strains and details are as described in the legend to Figure 4A. (B) The heatmap shows the log2 ratio of spike-in normalized RNA-seq signal for the antisense strand over transcribed regions in Spt5-depleted versus non-depleted cells. (C) A Northern blot probed to detect both the asn1+ sense and convergent antisense transcripts. (D) RNA-seq and (E) NET-seq heatmaps show the antisense signal in the region between −500 bp to +500bp (with respect to the sense TSS) in Spt5-depleted cells compared to non-depleted cells. Shown are 1568 (RNA-seq) and 1336 (NET-seq) genes, selected based on criteria described in Methods. The green dotted line indicates the TSS. Genes with antisense transcription were sorted into three categories, shown from top to bottom: divergent only, both divergent and convergent, and convergent only.
Figure 6
Figure 6
Analysis of convergent antisense promoters. (A) A diagram of the asn1+ gene showing the locations of the sense and antisense transcripts. The exons are shown as boxes and the intron as a line connecting the exons. The small gray box indicates the location of the 51 bp region deleted, including the TSS and upstream sequences for the antisense transcript, creating the asn1-Δ1 allele. The black bars labeled A and B indicate the regions tested for the RNAPII-ChIP analysis shown in panel D. (B) A Northern blot was probed with DNA that detects both the asn1+ sense and convergent antisense transcripts. (C) RT-qPCR analysis was performed to measure asn1+ sense RNA levels, normalized to adg1+ levels, for the strains indicated. Shown are the mean and standard deviation for three biological replicates. (D) ChIP-qPCR shows the enrichment of RNAPII at the asn1+ locus. The ChIP/input signal at asn1+ was normalized to the ChIP/input signal at the spiked in S. cerevisiae ADH1 gene. Shown are the mean and standard deviation from six to eight biological replicates. The p-values were calculated using Student’s t test.
Figure 7
Figure 7
A model for the role of Spt5 during transcription elongation. Previous studies have shown that Spt5 is recruited to elongating RNAPII shortly after initiation. We propose a model in which there is a site ~500 bp downstream of the TSS, where RNAPII is converted, in an Spt5-dependent fashion, to a form that is more capable of transcription elongation. In the absence of either Spt5 (middle diagram) or the Spt5 stimulatory site (bottom diagram), RNAPII is impaired in elongation, resulting in accumulation of RNAPII over the 5′ region and a lower level of RNAPII downstream. In the case of Spt5 depletion there is also activation of antisense transcription. This model for Spt5 function is similar to those previously proposed for the function of NusG, an Spt5 orthologue, in prokaryotes.

Similar articles

Cited by

References

    1. Ausubel FM, Brent R, Kingston RE, Moore DD, Seidman JG, Smith JA, Struhl KE. Current protocols in molecular biology. Green Publishing Associates and Wiley-Interscience; New York, NY: 1991.
    1. Blythe AJ, Yazar-Klosinski B, Webster MW, Chen E, Vandevenne M, Bendak K, Mackay JP, Hartzog GA, Vrielink A. The yeast transcription elongation factor Spt4/5 is a sequence-specific RNA binding protein. Protein Sci 2016 - PMC - PubMed
    1. Bonhoure N, Bounova G, Bernasconi D, Praz V, Lammers F, Canella D, Willis IM, Herr W, Hernandez N, Delorenzi M, et al. Quantifying ChIP-seq data: a spiking method providing an internal reference for sample-to-sample normalization. Genome Res. 2014;24:1157–1168. - PMC - PubMed
    1. Booth GT, Wang IX, Cheung VG, Lis JT. Divergence of a conserved elongation factor and transcription regulation in budding and fission yeast. Genome Res 2016 - PMC - PubMed
    1. Brannan K, Kim H, Erickson B, Glover-Cutter K, Kim S, Fong N, Kiemele L, Hansen K, Davis R, Lykke-Andersen J, et al. mRNA decapping factors and the exonuclease Xrn2 function in widespread premature termination of RNA polymerase II transcription. Mol Cell. 2012;46:311–324. - PMC - PubMed

MeSH terms