. 2017 Apr 20;66(2):180-193.e8.
doi: 10.1016/j.molcel.2017.02.026. Epub 2017 Mar 30.

A Metabolic Function for Phospholipid and Histone Methylation

Affiliations

A Metabolic Function for Phospholipid and Histone Methylation

Cunqi Ye et al. Mol Cell. .

Abstract

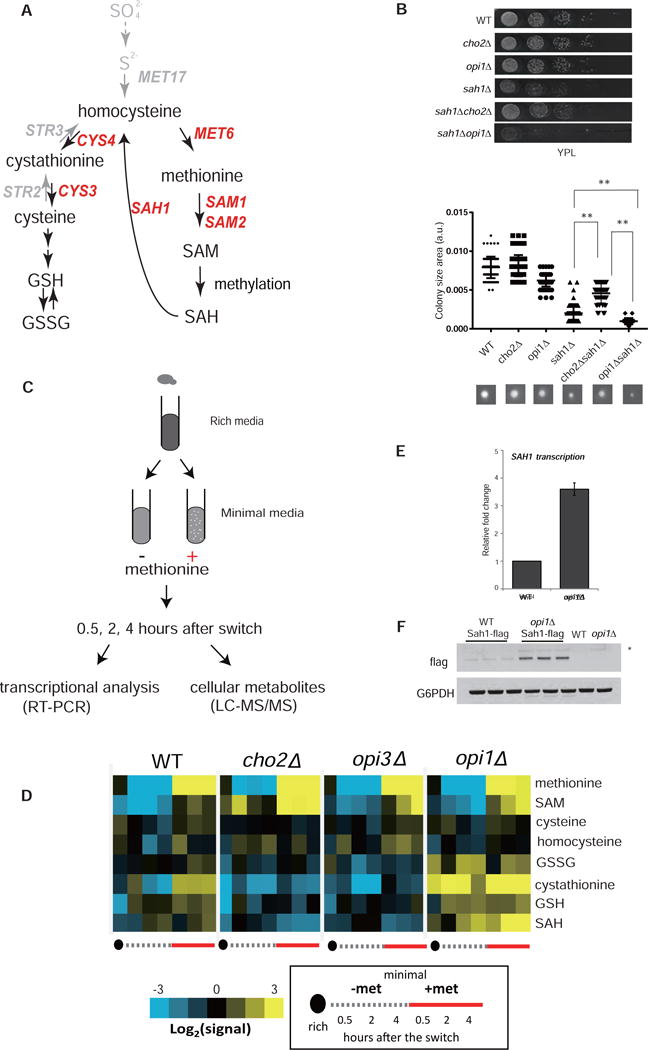
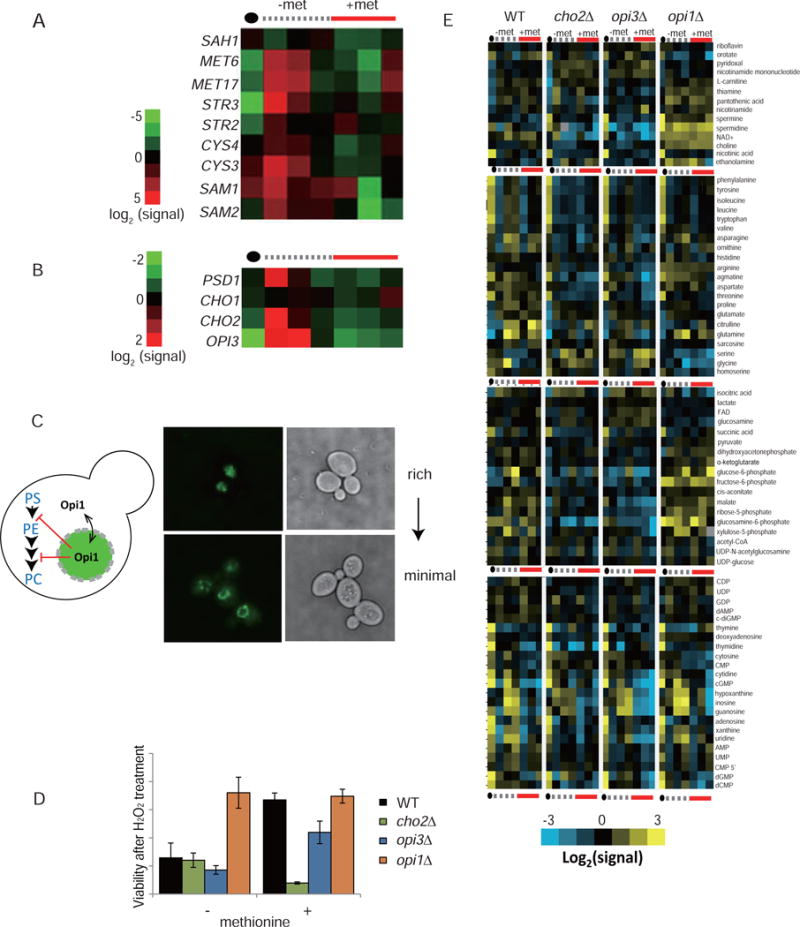
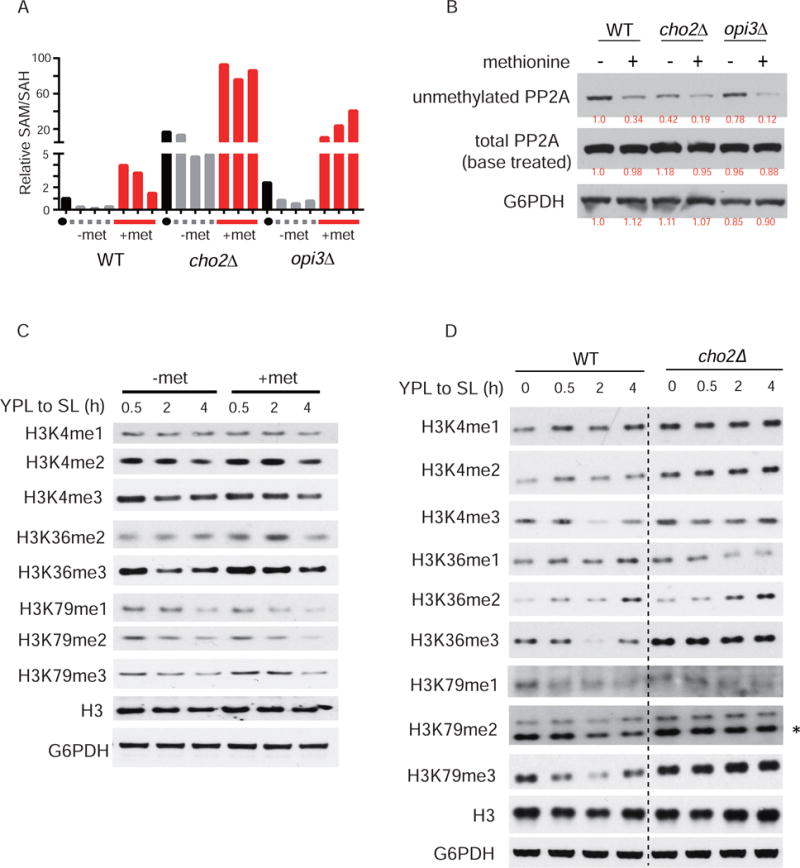
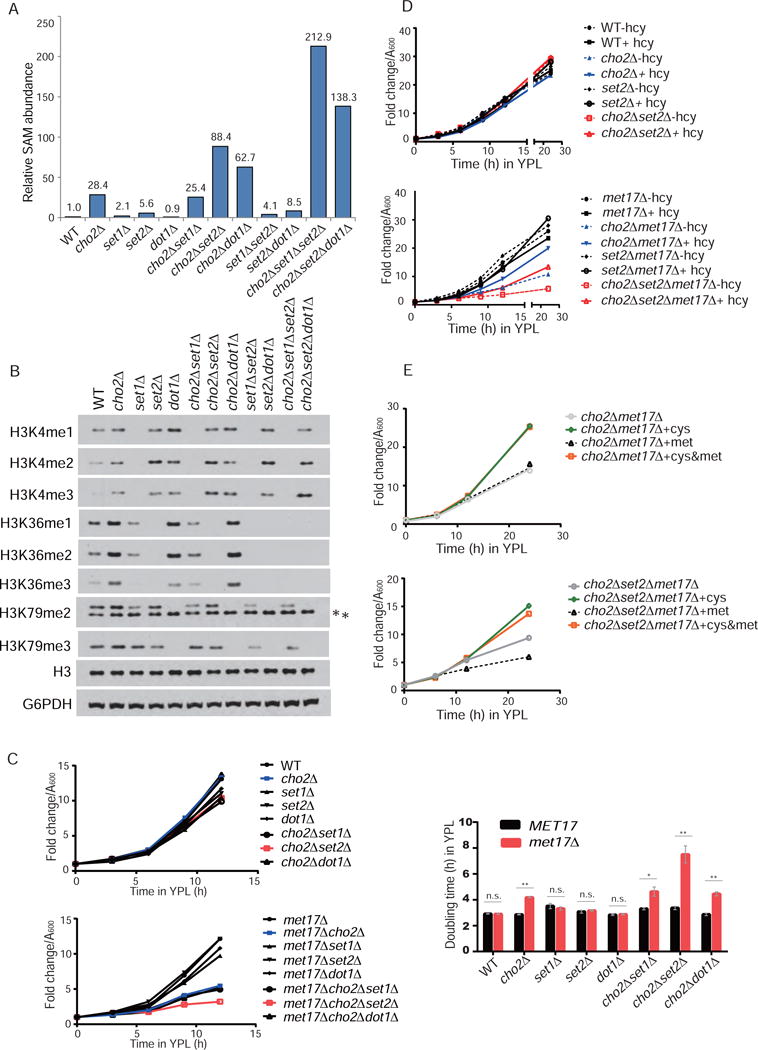
S-adenosylmethionine (SAM) is the methyl donor for biological methylation modifications that regulate protein and nucleic acid functions. Here, we show that methylation of a phospholipid, phosphatidylethanolamine (PE), is a major consumer of SAM. The induction of phospholipid biosynthetic genes is accompanied by induction of the enzyme that hydrolyzes S-adenosylhomocysteine (SAH), a product and inhibitor of methyltransferases. Beyond its function for the synthesis of phosphatidylcholine (PC), the methylation of PE facilitates the turnover of SAM for the synthesis of cysteine and glutathione through transsulfuration. Strikingly, cells that lack PE methylation accumulate SAM, which leads to hypermethylation of histones and the major phosphatase PP2A, dependency on cysteine, and sensitivity to oxidative stress. Without PE methylation, particular sites on histones then become methyl sinks to enable the conversion of SAM to SAH. These findings reveal an unforeseen metabolic function for phospholipid and histone methylation intrinsic to the life of a cell.

Keywords: H3K36; S-adenosylmethionine; cysteine; epigenetics; glutathione; histone methylation; methyltransferase; phospholipids; transsulfuration.


Figures

Figure 1
Figure 1. PE methylation pathway is the major consumer of intracellular SAM
(A) Scheme depicting assay to assess possible SAM-leaking phenotype of individual methyltransferase mutants. The leakage of SAM from cho2Δ mutants but not WT enables small colonies of the SAM auxotroph strain sam1Δsam2Δ to grow. Data for all methyltransferase mutants tested are shown in Figure S1. (B) The PE methylation pathway and enzymes responsible for the synthesis of phospholipids. (C) Relative abundance of SAM in indicated strains grown in logarithmic and stationary phases in YPD. Data are represented as mean ± SD (n≥3). (D) Representative growth curves of sam1Δsam2Δ and sam1Δsam2Δcho2Δ strains in YPL. Note that lack of Cho2p spares SAM and improves growth of SAM auxotrophs (sam1Δsam2Δ) at intermediate concentrations of SAM supplementation (100 μM). (E) Relative abundance of SAM in the indicated strains grown in YPL. Data are represented as mean ± SD (n=3). (F) Comparison of SAM levels between respiration-competent ρ+ and incompetent ρ° cells. Data are represented as mean ± SD (n=4). Error bars indicate SD. *p < 0.05, **p < 0.01, and n.s., no significance. See also Figure S1 and S2.
Figure 2
Figure 2. Regulation of the PE methylation pathway is critical for sulfur metabolism
(A) Diagram of the sulfur metabolic pathways in budding yeast. Arrows and text in grey depict pathways absent in mammalian cells. (B) Top: growth of the indicated strains on YPL plates after incubation at 30°C for two days. Rows depict serial, 10-fold dilutions of cells. Bottom: quantification of colony size of the indicated strains. At least 20 colonies were sized for each strain. A representative colony is shown for each strain. Error bars indicate SD. **p < 0.01. (C) Experimental setup for measuring transcriptional and metabolic changes in response to a switch from YPL to SL or SL containing methionine. (D) Heat maps depicting the abundances of key sulfur metabolites in cells switched from YPL to SL and collected at the indicated times. The data are representative of two independent time courses. Numerical data are presented in Table S1. (E) Comparison of mRNA transcripts of SAH1 and (F) Sah1-FLAG protein abundance between WT and opi1Δ cells. Data are represented as mean ± SD (n=3). See also Figure S3.
Figure 3
Figure 3. Coordination of phospholipid methylation with sulfur metabolism is required for metabolic homeostasis and survivability against oxidative stress
(A) Heat maps depicting mRNA levels of major sulfur metabolic genes and (B) phospholipid biosynthetic genes in response to the switch from YPL to SL or SL containing methionine. Numerical data are presented in Table S2. (C) Localization of the transcriptional repressor Opi1-GFP in YPL or SL medium. (D) Cell viability of the indicated strains following treatment with 5 mM H2O2 in SL medium with or without methionine. Data are represented as mean ± SD (n=3). Note that supplementation of methionine promotes survival of WT but not cho2Δ cells. (E) Heat maps depicting abundances of major cellular metabolites in indicated cells switched from YPL to SL with or without methionine. The data are representative of two independent time courses and subject to hierarchical clustering. Numerical data are presented in table S1. See also Figure S4.
Figure 4
Figure 4. Increased SAM/SAH ratio resulting from deficiency in PE methylation leads to aberrant increases in the methylation of histones and the major phosphatase PP2A
(A) SAM/SAH ratios were calculated from the relative abundances of SAM and SAH determined by LC-MS/MS. (B) Western blots assaying the methylation state of PP2A in cells under indicated conditions. Note that the antibody preferentially recognizes the demethylated form of PP2A. Treatment of the membrane with NaOH hydrolyzes the carboxy methylester linkage, thereby enabling assessment of total PP2A. (C) The effect of methionine supplementation on the dynamics of histone methylation following switch from YPL to SL medium for the indicated times. (D) The dynamics of the methylation of H3 in WT, cho2Δ, and opi3Δ cells following switch from YPL to SL medium. The data are representative of at least three independent experiments.
Figure 5
Figure 5. Transcriptional consequences in PE methylation-deficient cho2Δ cells
(A) Volcano plots of RNA-Seq data depicting differentially expressed genes in WT cells before and 1 hour after the switch to SL, WT vs cho2Δ cells before or 1 and 3 hours after switch to SL. Numerical data are presented in Tables S4 and S6. Color designates different groups of genes encoding: ribosomal proteins (green), mitochondrial proteins (blue), proteins in sulfur metabolic pathways (red) and stress-related responses (yellow). Top-10 differentially expressed genes are listed when the represented group is uniformly altered under conditions depicted in the graph. (B) RT-PCR analysis of mRNA transcript amounts of MET6, MET17, STR3, and SAM1 in WT, cho2Δ, histone methyltransferase mutants, and mutants with deletions of both CHO2 and histone methyltransferases, 1 hour after switching to SL. Data are represented as mean ± SD (n=3). (C) Changes in mRNA transcripts in a time course experiment. Data are represented as the means of three replicates. See also Figure S5.
Figure 6
Figure 6. Methylation of PE and histones are orchestrated to govern SAM homeostasis and to facilitate synthesis of cysteine from methionine
(A) Relative abundance of SAM in the indicated histone methyltransferase mutants, either alone or in cho2Δ, 1 h after switch to SL. The data are representative of two independent experiments. (B) Levels of methylated H3 at specific lysine sites in indicated strains collected 1 h after the switch to SL. *indicates a non-specific band. The data are representative of at least three independent experiments. See also Figure S6. (C) Representative growth curves and doubling times of the indicated strains in YPL. Note that deletion of MET17 selectively compromises growth of cho2Δ strains. (D) Representative growth curves of the indicated strains in YPL with or without 1 mM homocysteine (hcy) supplementation. (E) The effects of cysteine and methionine on the growth of cho2Δmet17Δ and cho2Δset2Δmet17Δ strains.
Figure 7
Figure 7. Overexpression of the mammalian PE methyltransferase PEMT diminishes the methylation of H3K36 and H3K79 and promotes transsulfuration for cysteine synthesis
(A) Levels of methylated H3 at specific lysine sites and (B) relative abundance of sulfur-containing metabolites in GFP control and PEMT-overexpressing 293T cells. (C) Levels of methylated H3 at specific lysine sites and (D) relative abundance of sulfur-containing metabolites in GFP control and PEMT-overexpressing HeLa cells. See also Figure S7. (E) Model depicting the metabolic function provided by the methylation of phospholipids and histones. Cell with PE methylation (top), cell lacking PE methylation (bottom).

Comment in

References

    1. Bremer J, Greenberg DM. Methyl transfering enzyme system of microsomes in the biosynthesis of lecithin (phosphatidylcholine) Biochimica et biophysica acta. 1961;46:205–216.
    1. Broach JR. Nutritional control of growth and development in yeast. Genetics. 2012;192:73–105. - PMC - PubMed
    1. Brosnan JT, Brosnan ME. The sulfur-containing amino acids: an overview. The Journal of nutrition. 2006;136:1636S–1640S. - PubMed
    1. Cai L, Sutter BM, Li B, Tu BP. Acetyl-CoA induces cell growth and proliferation by promoting the acetylation of histones at growth genes. Molecular cell. 2011;42:426–437. - PMC - PubMed
    1. Cai L, Tu BP. Driving the cell cycle through metabolism. Annual review of cell and developmental biology. 2012;28:59–87. - PubMed

MeSH terms