. 2017 Apr 24;27(8):1085-1097.
doi: 10.1016/j.cub.2017.02.049. Epub 2017 Mar 30.

Non-overlapping Neural Networks in Hydra vulgaris

Affiliations

Non-overlapping Neural Networks in Hydra vulgaris

Christophe Dupre et al. Curr Biol. .

Abstract

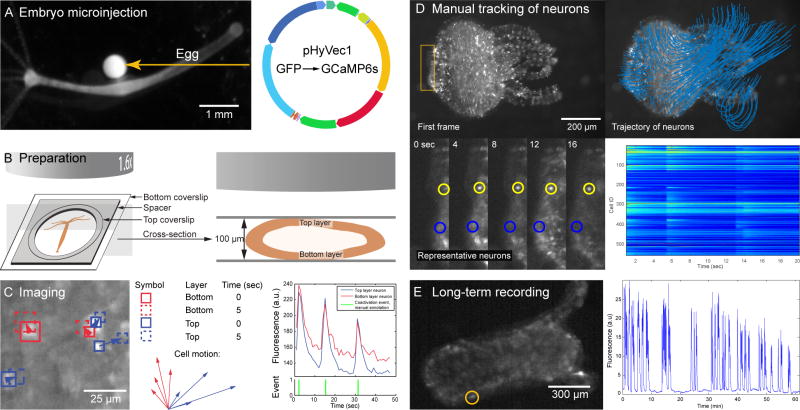
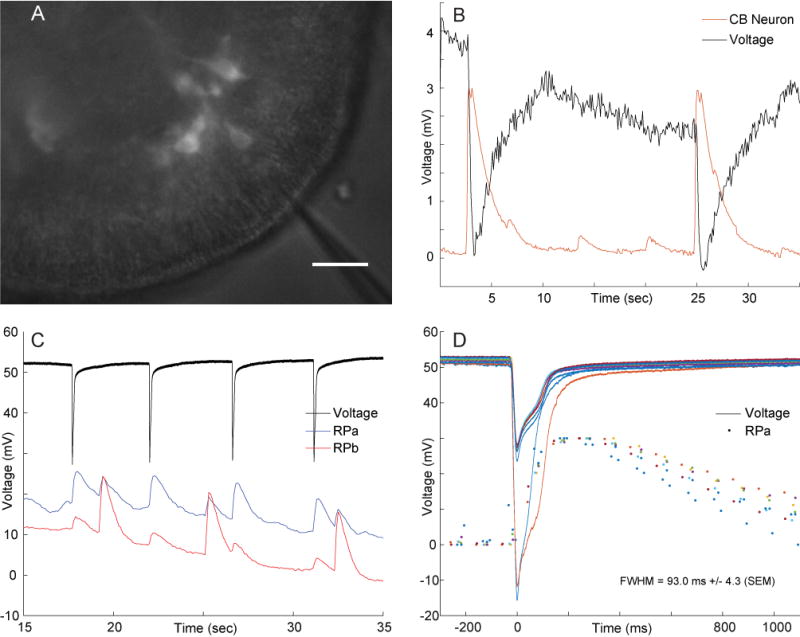
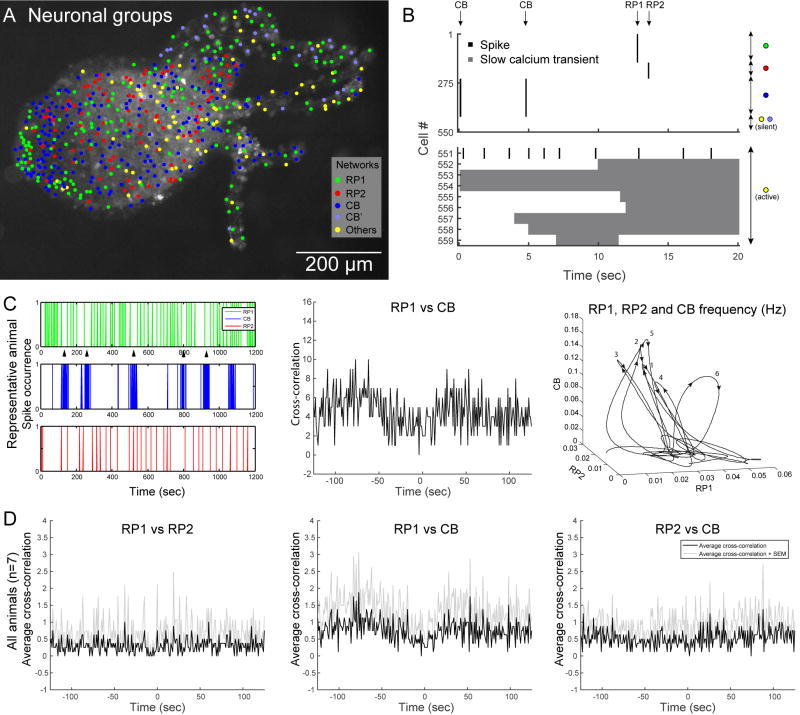
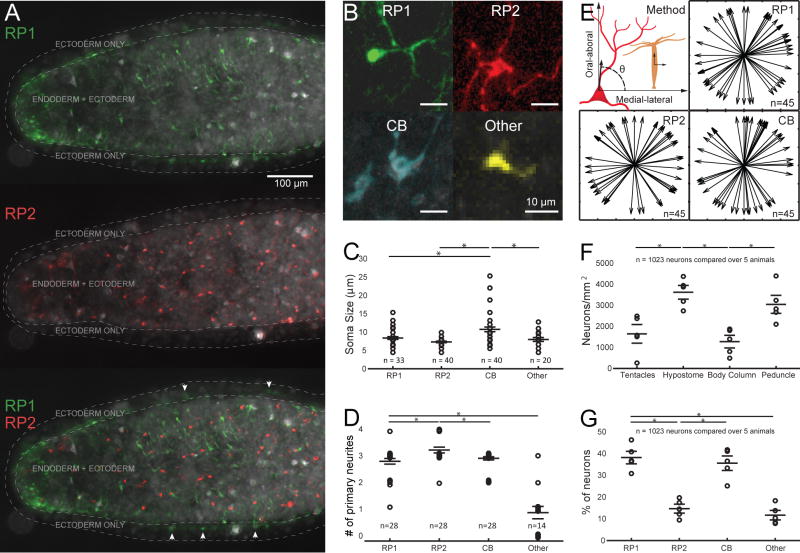
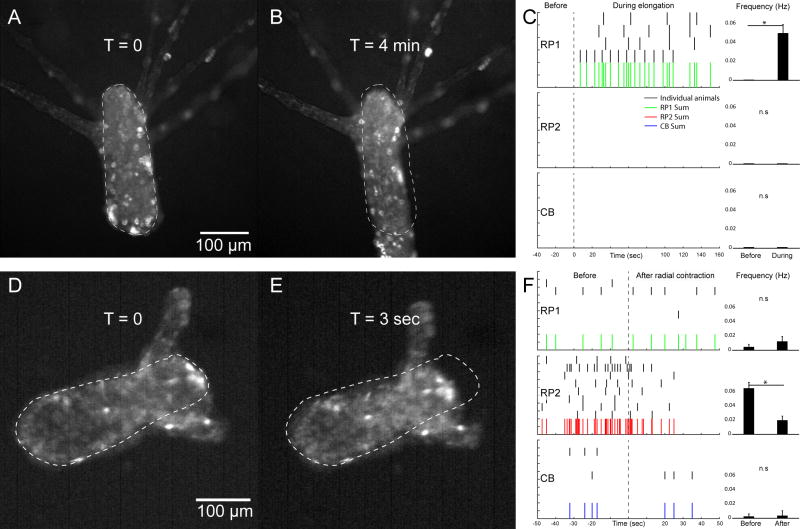
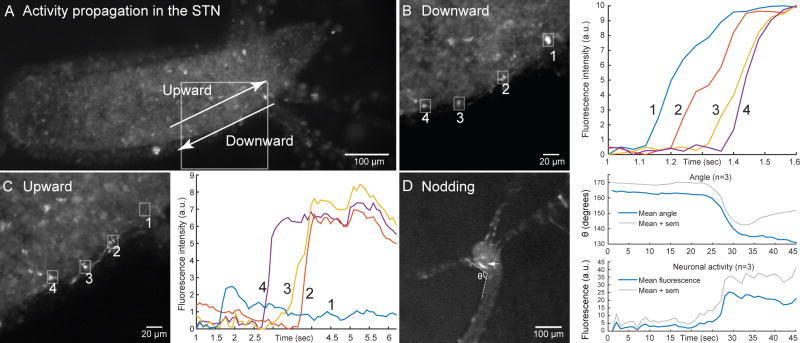
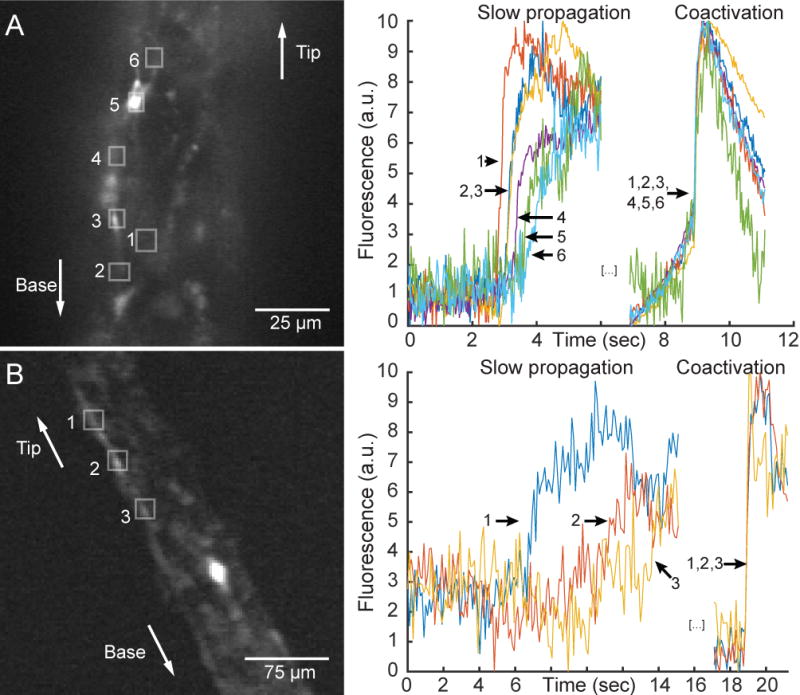
To understand the emergent properties of neural circuits, it would be ideal to record the activity of every neuron in a behaving animal and decode how it relates to behavior. We have achieved this with the cnidarian Hydra vulgaris, using calcium imaging of genetically engineered animals to measure the activity of essentially all of its neurons. Although the nervous system of Hydra is traditionally described as a simple nerve net, we surprisingly find instead a series of functional networks that are anatomically non-overlapping and are associated with specific behaviors. Three major functional networks extend through the entire animal and are activated selectively during longitudinal contractions, elongations in response to light, and radial contractions, whereas an additional network is located near the hypostome and is active during nodding. These results demonstrate the functional sophistication of apparently simple nerve nets, and the potential of Hydra and other basal metazoans as a model system for neural circuit studies.

Keywords: Hydra; calcium imaging; nerve net.


Conflict of interest statement

Conflict of interest: The authors declare no competing financial interests.

Figures

Figure 1
Figure 1. Imaging the entire nervous system activity of Hydra
A. To create the transgenic line, we injected into fertilized Hydra eggs (left) a plasmid that causes expression of GCaMP6s (right). B. Imaging preparation (left) and sample cross-section (right). C. Left: trajectory of 5 representative neurons. Middle: close-up on the trajectory of the 8 tracked neurons, showing a difference in direction of the neurons of the top layer (blue) versus the neurons of the bottom layer (red). Right: Single calcium spikes in neurons from both layers (top; see also Figure S2), with manual detection of coactivation events (bottom). D. First frame (top left), trajectory of all neurons (top right), close-up on the position of 2 representative neurons (bottom left) and fluorescence (bottom right) of all the detected neurons during a typical recording. Measurements were made on the first 20 seconds (real time, i.e. 1.6 seconds of movie time) of Movie S1. E. Entire animal (left) imaged for more than one hour at 30 frames per second, with fluorescence signal (right) coming from the cell circled in yellow. See also Figures S1, S2 and S4 and Movies S1 and S2.
Figure 2
Figure 2. Simultaneous recording of electrical activity and calcium imaging
A. Preparation (scale bar = 20 μm). Electrode comes from the top and is slightly out of focus B. Extracellular electrode placed near a contraction burst neuron, with fluorescence signal recorded from that contraction neuron. Contractions produce overwhelming electrical signal. C. Extracellular electrode was placed close to a neuron from one RP network (RPa, which could be either RP1 or RP2) and far from a neuron from the other RP network (RPb). Accordingly, the spikes recorded in electrical activity match calcium spikes of neuron A (blue trace) but not neuron B (red trace). Note that there is cross-contamination between the fluorescence signals from neuron A and B, but one can distinguish them because of their amplitude difference (large spikes in neuron A result in small spikes in neuron B and vice-versa). D. Superimposition of nine spikes from extracellular recording and their corresponding calcium traces for neuron A. The color of each electrical trace matches the color of the corresponding fluorescence trace. In B–D, the fluorescence traces are in arbitrary units.
Figure 3
Figure 3. The nervous system of Hydra includes three major networks
A. Topographical distribution of neurons in Hydra (same dataset as Figure 1D), grouped in 5 categories: rhythmic potentials #1 (RP1, green), rhythmic potentials #2 (RP2, red), longitudinal contraction bursts (CB, blue) and other neurons (others, yellow). CB’ indicates neurons of the tentacles which did not fire during the two CB events of this time window, but fired during another CB event. B. Spikes (black) and slow calcium transients (grey) of the 559 cells shown in A. Neurons are grouped by identity (colored dots on the right), and activity events are marked with an arrow (top). Note the difference in scale between the y axis of the top and bottom plots, due to the large number of neurons belonging to RP1, RP2 and CB. Also, note that the 2 activity epochs labeled as CB are the last 2 spikes of a longitudinal contraction burst. C. Left: Spiking activity of the three networks in one representative animal. Each spike represents the coactivation of the neurons of one network (RP1, RP2 or CB). Arrows indicate decrease in RP1 frequency during a longitudinal contraction burst. Middle: Cross-correlation between RP1 and CB. Right: plot of the firing frequency over time of the three networks. Numbers indicate longitudinal contraction bursts. D. Cumulated (over 7 animals) cross-correlation between RP1–RP2 (left), RP1-CB (middle) and RP2-CB (right).
Figure 4
Figure 4. Anatomical differences between the three major networks
A. Pseudocolored (cf methods) RP1 and RP2 networks in an animal’s body column. Top: RP1 only, middle: RP2 only, bottom: RP1 + RP2. Areas containing the ectoderm only and the endoderm + ectoderm are delineated with white dashed lines and six example neurons present in the “ectoderm only” area are marked with an arrow. B. Pseudocolored neurons representative of each of the 4 main categories. C. Soma size. D. Number of primary neurites. Note that jitter was added to the data points so that they do not overlap exactly on the plot. E. Orientation of primary neurites in neurons of the three main networks. The method to measure the angle at each neurite is described in the top-left panel. F. Neuron density in various body areas. G. Percentage of neurons belonging to each network. Data are represented as mean ± SEM. * indicates P<0.05 (unpaired T-Test). See also Figure S3.
Figure 5
Figure 5. Behavioral association of two rhythmic potentials networks
A. Dark-habituated animal at rest. B: elongation response during exposure to blue light (see Movie S3). Dashed line marks body contour of animal at rest. C: spike trains of RP1, RP2 and CB neurons in 4 animals, where t=0 indicates onset of elongation. Histograms compare firing frequency before vs during elongation response. D: Animal before radial contraction, a behavior that also occurs in unrestrained preparations (Movie S5). E: animal after radial contraction (see Movie S4). Dashed line marks body contour of animal before radial contraction. F: Spike trains of RP1, RP2 and CB neurons in 8 animals, where t=0 indicates radial contraction. Histograms compare firing frequency before vs after radial contraction. Data are represented as mean ± SEM. * indicates (P < 0.05, paired T-Test). See also Movies S3–S5.
Figure 6
Figure 6. Subtentacle network (STN) causes nodding behavior and can conduct signal in both directions
A. Representative Hydra. White square marks area containing a STN. Arrows mark the two directions of propagation: upward and downward. B. Left: Region boxed in A during downward propagation, with 4 neurons marked with a white square. Right: Calcium trace of the 4 neurons during downward propagation. C. Same as B but for upward propagation. D. Left: representative Hydra at the end of nodding. θ marks angle, arrow marks one STN neuron. Right: evolution of angle and STN neuron activity over time.
Figure 7
Figure 7. Signal propagates in both directions and at two different speeds in tentacles
A. Left: Representative tentacle during upward propagation, with 6 example neurons boxed and numbered in white. Right: Calcium signal of the 6 neurons during slow propagation and coactivation. B. Same as A but for downward propagation.

Comment in

References

    1. van Leeuwenhoek A. Green weeds growing in water, and some animalcula found about them. Philos Trans R Soc. 1702;art IV:1304–1311.
    1. David CN. A quantitative method for maceration of hydra tissue. Wilhelm Roux Arch für Entwicklungsmechanik der Org. 1973;171:259–268. - PubMed
    1. Westfall JA, Wilson JD, Rogers RA, Kinnamon JC. Multifunctional features of a gastrodermal sensory cell in Hydra: three-dimensional study. J Neurocytol. 1991;20:251–261. - PubMed
    1. Parker GH. The Elementary Nervous system. Philadelphia: J. B. Lippincott Co.; 1919.
    1. Epp L, Tardent P. The Distribution of Nerve Cells in Hydra attenuata Pall. 1978;193:185–193. - PubMed