. 2017 Nov;31(11):2376-2387.
doi: 10.1038/leu.2017.108. Epub 2017 Apr 3.

A novel AHI-1-BCR-ABL-DNM2 complex regulates leukemic properties of primitive CML cells through enhanced cellular endocytosis and ROS-mediated autophagy

Affiliations

A novel AHI-1-BCR-ABL-DNM2 complex regulates leukemic properties of primitive CML cells through enhanced cellular endocytosis and ROS-mediated autophagy

X Liu et al. Leukemia. 2017 Nov.

Abstract

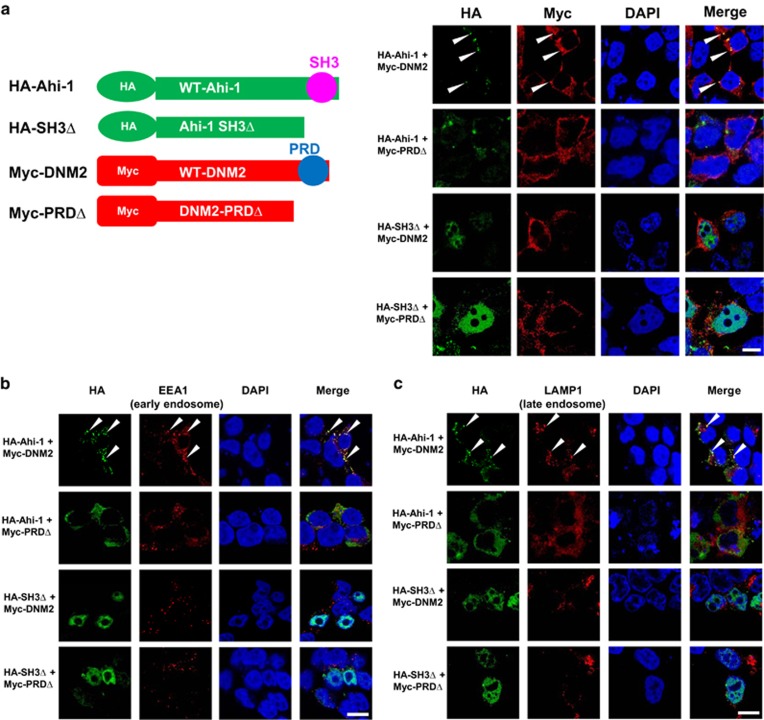
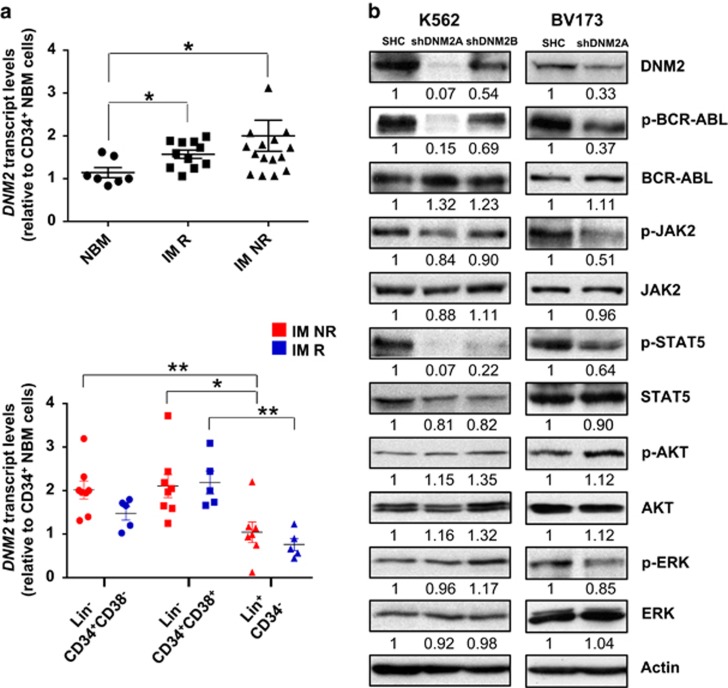
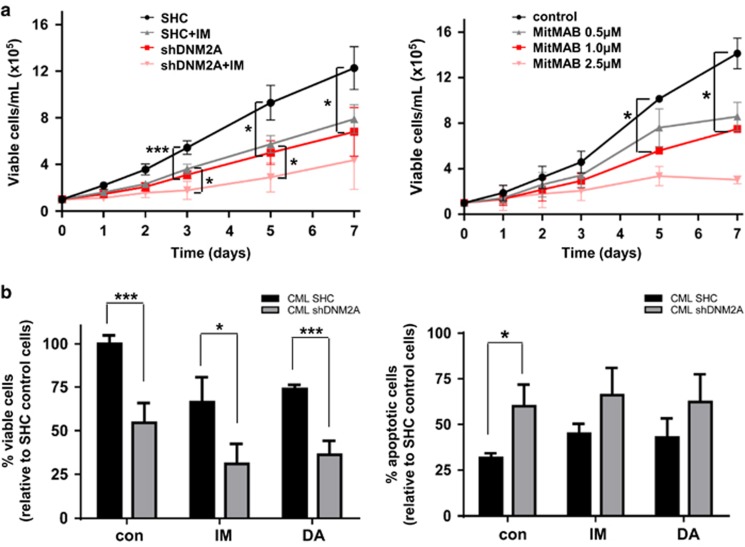
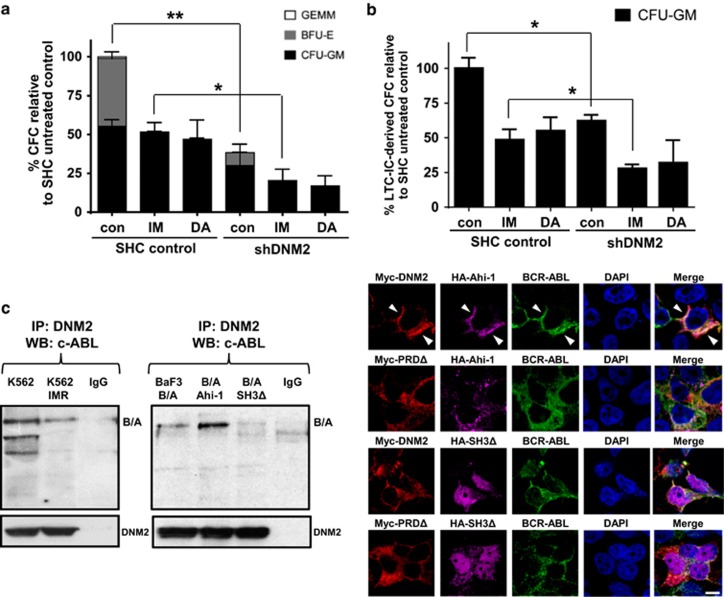
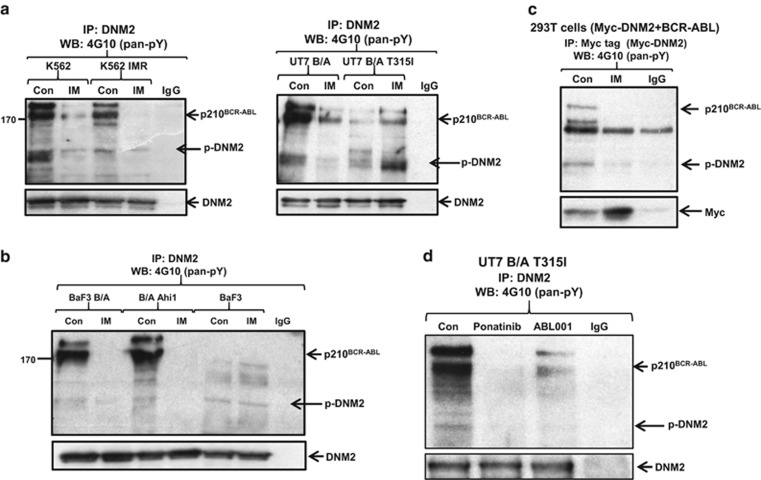
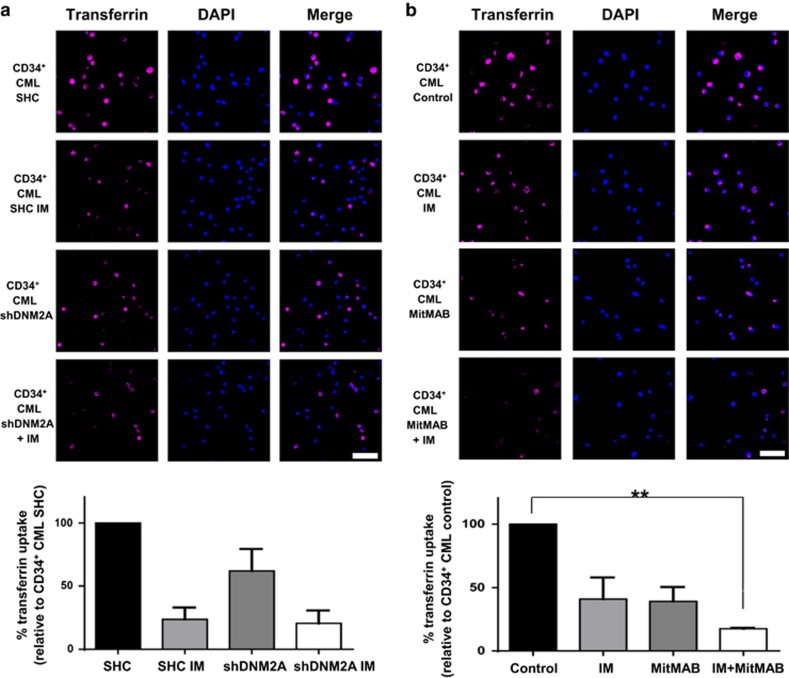
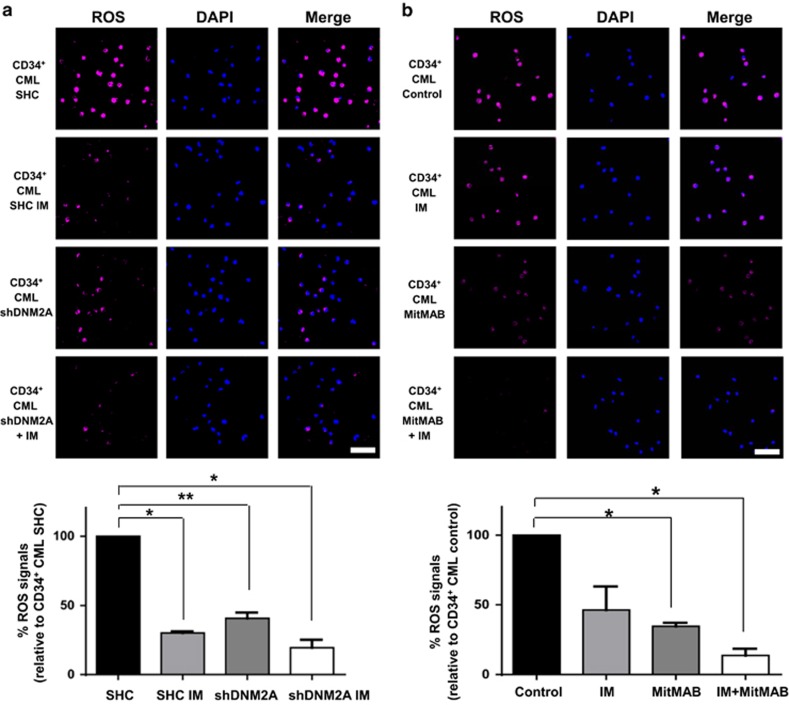
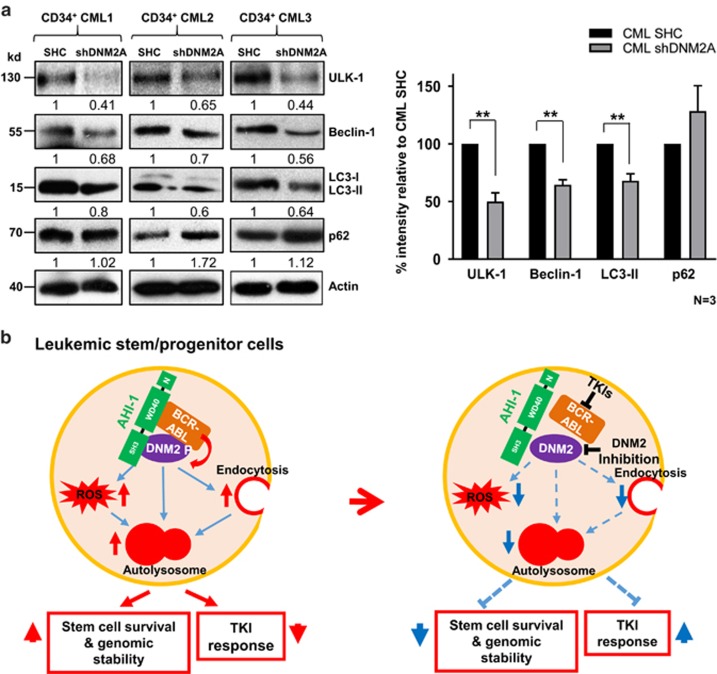
Tyrosine kinase inhibitor (TKI) therapies induce clinical remission with remarkable effects on chronic myeloid leukemia (CML). However, very few TKIs completely eradicate the leukemic clone and persistence of leukemic stem cells (LSCs) remains challenging, warranting new, distinct targets for improved treatments. We demonstrated that the scaffold protein AHI-1 is highly deregulated in LSCs and interacts with multiple proteins, including Dynamin-2 (DNM2), to mediate TKI-resistance of LSCs. We have now demonstrated that the SH3 domain of AHI-1 and the proline rich domain of DNM2 are mainly responsible for this interaction. DNM2 expression was significantly increased in CML stem/progenitor cells; knockdown of DNM2 greatly impaired their survival and sensitized them to TKI treatments. Importantly, a new AHI-1-BCR-ABL-DNM2 protein complex was uncovered, which regulates leukemic properties of these cells through a unique mechanism of cellular endocytosis and ROS-mediated autophagy. Thus, targeting this complex may facilitate eradication of LSCs for curative therapies.


Conflict of interest statement

The authors declare no competing financial interests.

Figures

Figure 1
Figure 1
The interaction between Ahi-1 and DNM2 depends on SH3-PRD recognition within endosomal compartments. (a) Schematic representations of four Ahi-1 and DNM2 constructs, including HA-tagged full-length Ahi-1 (HA-Ahi-1), HA-tagged SH3 domain-deleted Ahi-1 (HA-SH3Δ), Myc-tagged full-length DNM2 (Myc-DNM2) and Myc-tagged proline rich domain-deleted DNM2 (Myc-PRDΔ). 293T cells co-transfected with indicated constructs were stained with anti-HA (green) and anti-Myc (red) antibodies. DAPI was used to stain the nuclei. Representative images are shown. (b, c) 293T cells co-transfected with indicated constructs were stained with anti-HA (green) and anti-EEA1 (red, b) or anti-LAMP-1 (red, c) antibodies. Images were acquired using a magnification of × 60 by confocal microscopy. The white scale bar represents 5 μm.
Figure 2
Figure 2
Increased expression of DNM2 in CD34+ CML stem/progenitor cells and lentiviral-mediated knockdown of DNM2 in BCR–ABL+ cells affects the JAK2/STAT5 pathway. (a) Quantitative real-time PCR analysis of the transcript levels of DNM2 in CD34+ cells purified from normal bone marrow (NBM), IM responders (IM R) and IM nonresponders (IM NR). DNM2 transcript levels were normalized to the control gene β2M, and bars represent the mean of data for each group. Comparison of the transcript levels of DNM2 in three subpopulations from IM NR (n=8, red) and IM R (n=5, blue). (b) Western blot analysis of phosphorylation and protein expression levels of DNM2 and other proteins in DNM2 knockdown K562 cells (shDNM2A and shDNM2B) and BV173 cells (shDNM2A). The densitometry values of protein expression changes are indicated as compared to SHC control.
Figure 3
Figure 3
Lentiviral-mediated knockdown of DNM2 impairs the survival of CD34+ CML stem/progenitor cells and sensitizes these cells to TKIs. (a) Cell proliferation of control (SHC) or DNM2-knockdown CD34+ CML cells with or without 5 μM IM (left) and MitMAB (right). (b) Cell viability (left) and apoptosis (right) assays in SHC or DNM2-knockdown CD34+ CML cells with or without 5 μM IM or 150 nM DA treatments. Values shown are the mean±s.e.m. *P<0.05, ***P<0.001.
Figure 4
Figure 4
Lentiviral-mediated knockdown of DNM2 impairs the survival of very primitive CD34+ CML stem/progenitor cells and identification of the AHI-1–BCR–ABL–DNM2 protein complex. (a) Numbers and types of colonies produced by transduction of CD34+ IM-nonresponder cells (n=3) with either a control (SHC) or shDNM2A construct in semisolid culture medium with or without 5 μM IM or 150 nM DA. (b) Long-term culture-initiating cell (LTC-IC) analysis of colony-forming cell (CFC) outputs in the same transduced cells cultured for 6 weeks in the presence of stromal cells with or without 5 μM IM or 150 nM DA. (c) Co-immunoprecipitation assays in K562 and K562 IM-resistant cells (IMR, left) and BCR–ABL-transduced and BCR–ABL/Ahi-1 co-transduced BaF3 cells (middle). Protein extracts were subjected to anti-DNM2 immunoprecipitation and then immunoblotted with anti-c-Abl antibody or anti-DNM2 antibody. 293T cells were co-transfected with HA-Ahi-1, BCR–ABL and Myc-DNM2 (or Myc-DNM2 PRDΔ) or HA-Ahi-1 SH3Δ, BCR–ABL and Myc-DNM2 (or Myc-DNM2 PRDΔ, right). Cells were stained with anti-Myc (red), anti-HA (purple) and anti-c-Abl (green) antibodies. DAPI was used to stain the nuclei. Images were acquired using a magnification of × 60 by confocal microscopy. The white scale bar represents 5 μm.
Figure 5
Figure 5
Western blot analysis of the AHI-1–BCR–ABL–DNM2 protein complex, with DNM2 phosphorylation by BCR–ABL. (a, b) Co-immunoprecipitation assays in various BCR–ABL+ cell lines with or without IM for 24 h. Parental BaF3 cells were cultured with mIL-3 (10 ng) but not Ahi-1 or BCR–ABL-transduced BaF3 cells. All protein extracts were immunoprecipitated with anti-DNM2 antibody and immunoblotted with a pan-anti-p-Tyr antibody (4G10) or anti-DNM2 antibody. (c) Co-immunoprecipitation assays in BCR–ABL/Myc-DNM2 co-transfected 293T cells cultured with or without 5 μM IM for 24 h. Protein extracts were immunoprecipitated with anti-Myc antibody and then immunoblotted with a pan-anti-p-Tyr antibody (4G10) or anti-Myc antibody. (d) Co-immunoprecipitation assays of UT7 BCR–ABL T315I (UT7 B/A T315I) cells with or without ponatinib (20 nM) or ABL001 (4 μM) treatment for 24 h. All protein extracts were immunoprecipitated with an anti-DNM2 antibody and immunoblotted with a pan-anti-p-Tyr antibody (4G10).
Figure 6
Figure 6
Suppression of DNM2 or inhibition of BCR–ABL affects transferrin uptake in CD34+ CML cells from IM nonresponders. CD34+ CML cells transduced with either control (SHC) or shDNM2A and cultured for 24 h (a) with or without IM or (b) CD34+ CML cells from the same patients treated with IM or MitMAB alone or in combination were stained with Alexa Fluor 647-conjugated transferrin and transferrin uptake was determined by confocal microscopy. Intracellular transferrin signals were quantified and normalized to SHC control cells or untreated cells (n=3 per group, respectively). The white scale bar represents 50 μm. Values shown are the mean±s.e.m. **P<0.01.
Figure 7
Figure 7
Suppression of DNM2 or inhibition of BCR–ABL affects ROS production in primary CD34+ CML cells from IM nonresponders. (a, b) ROS production was determined using CellROX deep red reagents in CD34+ CML cells transduced with either a control (SHC) or shDNM2A and cultured (a) with or without IM or (b) CD34+ CML cells from the same patients treated with IM or MitMAB alone or in combination. Intracellular ROS accumulation was quantified and normalized to the signals detected in SHC or untreated control cells by confocal microscopy (n=3 per group, respectively). Representative images are shown. The white scale bar represents 50 μm. Values shown are the mean±s.e.m. *P<0.05, **P<0.01.
Figure 8
Figure 8
The effects of suppression of DNM2 on key autophagy regulators in primary CD34+ CML cells and a model of biological functions of the ABD complex in CML cells. (a) Western blot analysis of ULK-1, Beclin-1, LC3-II and p62 in CD34+ IM-nonresponder cells (n=3) with knockdown of DNM2 as indicated. The densitometry values of protein expression changes are indicated. Bar graph represents the quantification of the protein levels of ULK-1, Beclin-1, LC3-II and p62 relative to Actin and SHC controls in DNM2 knockdown CD34+ CML cells. Values shown are the mean±s.e.m. **P<0.01. (b) Model of the mechanism by which the ABD protein complex deregulates three essential cellular activities—endocytosis, ROS production and autophagy—in CML stem/progenitor cells, resulting in increased LSC survival and genomic stability, but reduced TKI response of these cells. Knockdown or pharmaceutical inhibition of DNM2 activities and TKI treatments to destabilize this complex perturbs these key cellular properties.

Similar articles

Cited by

References

    1. Druker BJ, O'Brien SG, Cortes J, Radich J. Chronic myelogenous leukemia. Hematol Am Soc Hematol Educ Program 2002, 111–135. - PubMed
    1. Sawyers CL. Chronic myeloid leukemia. N Engl J Med 1999; 340: 1330–1340. - PubMed
    1. Savona M, Talpaz M. Getting to the stem of chronic myeloid leukaemia. Nat Rev Cancer 2008; 8: 341–350. - PubMed
    1. Perrotti D, Jamieson C, Goldman J, Skorski T. Chronic myeloid leukemia: mechanisms of blastic transformation. J Clin Invest 2010; 120: 2254–2264. - PMC - PubMed
    1. Jiang X, Smith C, Eaves A, Eaves C. The challenges of targeting chronic myeloid leukemia stem cells. Clin Lymphoma Myeloma 2007; 7 (Suppl 2): S71–S80. - PubMed

MeSH terms