

Changes of articular cartilage and subchondral bone after extracorporeal shockwave therapy in osteoarthritis of the knee
- PMID: 28367081
- PMCID: PMC5370283
- DOI: 10.7150/ijms.17469
Changes of articular cartilage and subchondral bone after extracorporeal shockwave therapy in osteoarthritis of the knee
Abstract
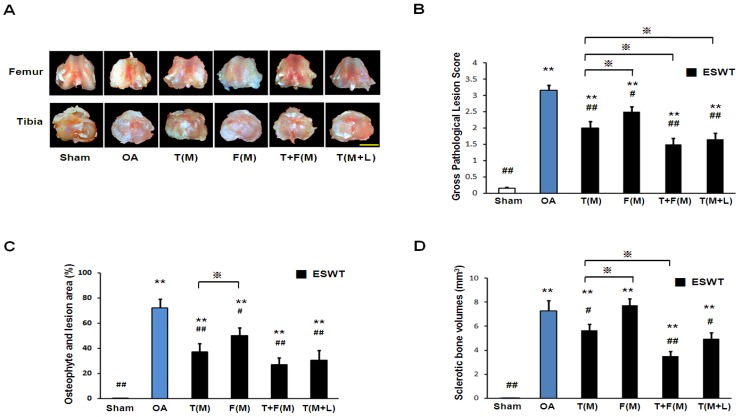
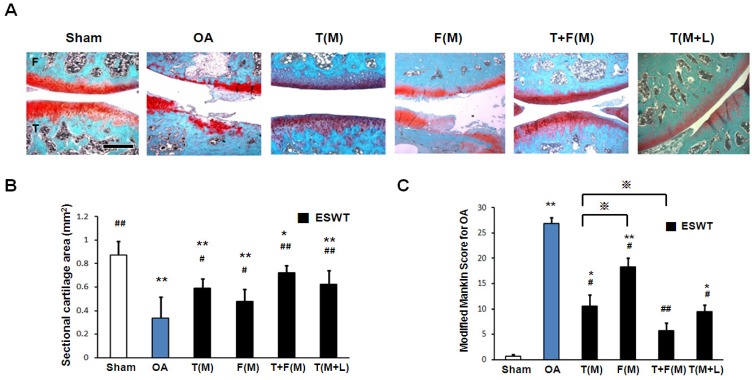
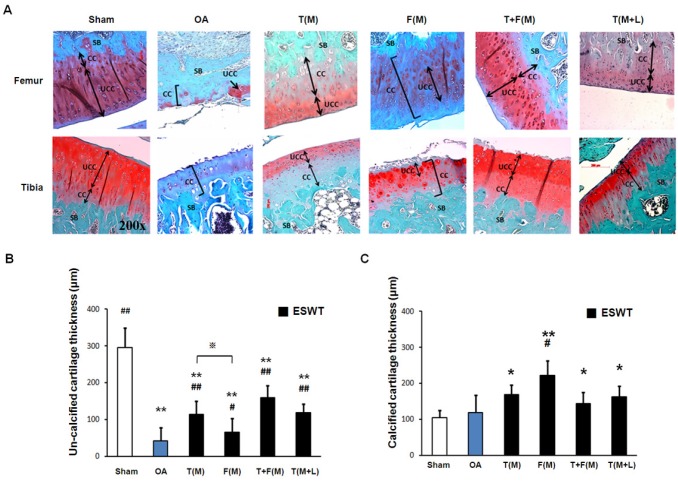
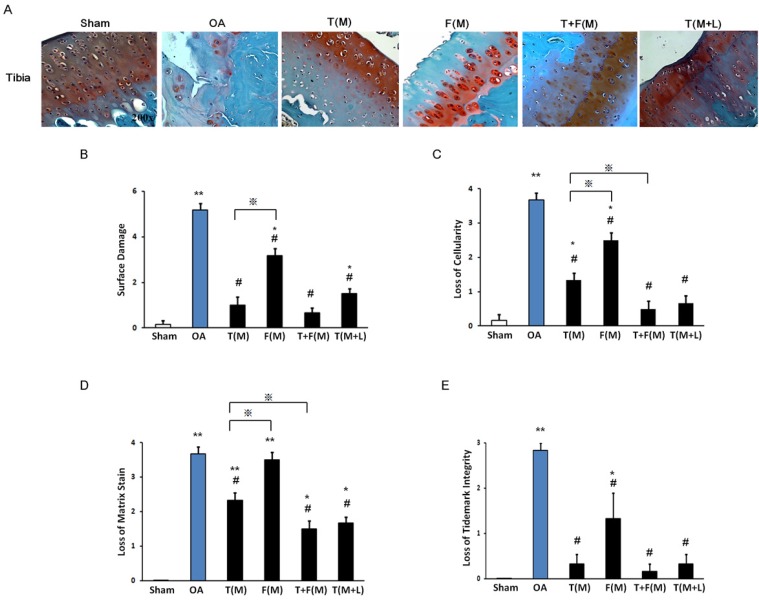
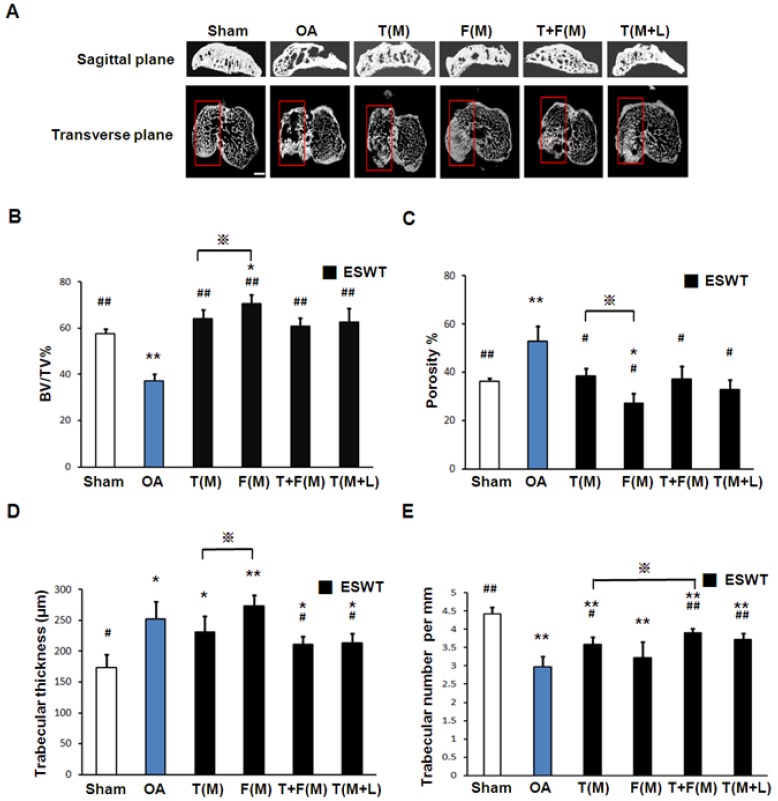
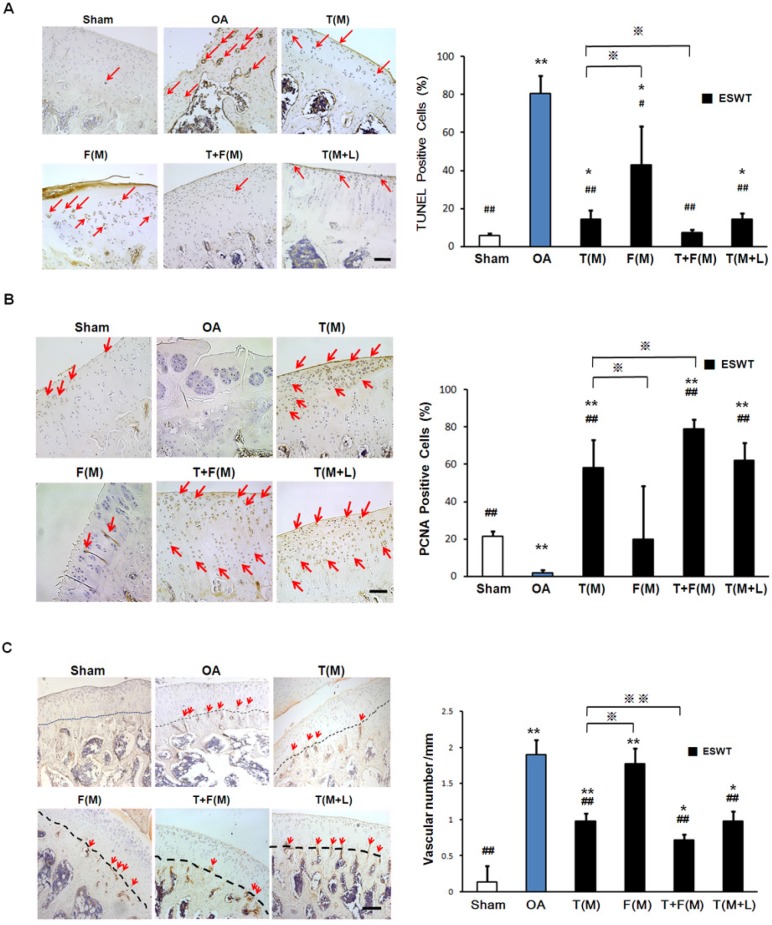
We assessed the pathological changes of articular cartilage and subchondral bone on different locations of the knee after extracorporeal shockwave therapy (ESWT) in early osteoarthritis (OA). Rat knees under OA model by anterior cruciate ligament transaction (ACLT) and medial meniscectomy (MM) to induce OA changes. Among ESWT groups, ESWT were applied to medial (M) femur (F) and tibia (T) condyles was better than medial tibia condyle, medial femur condyle as well as medial and lateral (L) tibia condyles in gross osteoarthritic areas (p<0.05), osteophyte formation and subchondral sclerotic bone (p<0.05). Using sectional cartilage area, modified Mankin scoring system as well as thickness of calcified and un-calcified cartilage analysis, the results showed that articular cartilage damage was ameliorated and T+F(M) group had the most protection as compared with other locations (p<0.05). Detectable cartilage surface damage and proteoglycan loss were measured and T+F(M) group showed the smallest lesion score among other groups (p<0.05). Micro-CT revealed significantly improved in subchondral bone repair in all ESWT groups compared to OA group (p<0.05). There were no significantly differences in bone remodeling after ESWT groups except F(M) group. In the immunohistochemical analysis, T+F(M) group significant reduced TUNEL activity, promoted cartilage proliferation by observation of PCNA marker and reduced vascular invasion through observation of CD31 marker for angiogenesis compared to OA group (P<0.001). Overall the data suggested that the order of the effective site of ESWT was T+F(M) ≧ T(M) > T(M+L) > F(M) in OA rat knees.
Keywords: cartilage histopathology; osteoarthritis; rats.; shockwave; subchondral bone.
Conflict of interest statement
Conflicts of Interest: The authors declared that they did not receive any honoraria or consultancy fees in writing this manuscript. No benefits in any form have been received or will be received from a commercial party related directly or indirectly to the subject of this article. One author (Ching-Jen Wang) serves as a member of the advisory committee of Sanuwave, (Alpharetta, GA) and this study is performed independent of the appointment. The remaining authors declared no conflict of interest.
Figures
Similar articles
-
Shockwave Targeting on Subchondral Bone Is More Suitable than Articular Cartilage for Knee Osteoarthritis.Int J Med Sci. 2019 Jan 1;16(1):156-166. doi: 10.7150/ijms.26659. eCollection 2019. Int J Med Sci. 2019. PMID: 30662339 Free PMC article.
-
Extracorporeal shockwave therapy shows chondroprotective effects in osteoarthritic rat knee.Arch Orthop Trauma Surg. 2011 Aug;131(8):1153-8. doi: 10.1007/s00402-011-1289-2. Epub 2011 Mar 9. Arch Orthop Trauma Surg. 2011. PMID: 21387139
-
Extracorporeal shockwave therapy shows time-dependent chondroprotective effects in osteoarthritis of the knee in rats.J Surg Res. 2012 Nov;178(1):196-205. doi: 10.1016/j.jss.2012.01.010. Epub 2012 Apr 4. J Surg Res. 2012. PMID: 22608545
-
Modeling knee osteoarthritis pathophysiology using an integrated joint system (IJS): a systematic review of relationships among cartilage thickness, gait mechanics, and subchondral bone mineral density.Osteoarthritis Cartilage. 2018 Nov;26(11):1425-1437. doi: 10.1016/j.joca.2018.06.017. Epub 2018 Jul 26. Osteoarthritis Cartilage. 2018. PMID: 30056214
-
Extracorporeal shockwave treatment in knee osteoarthritis: therapeutic effects and possible mechanism.Biosci Rep. 2020 Nov 27;40(11):BSR20200926. doi: 10.1042/BSR20200926. Biosci Rep. 2020. PMID: 33074309 Free PMC article. Review.
Cited by
-
Sargassum polysaccharide attenuates osteoarthritis in rats and is associated with the up-regulation of the ITGβ1-PI3K-AKT signaling pathway.J Orthop Translat. 2024 Jun 27;47:176-190. doi: 10.1016/j.jot.2024.06.015. eCollection 2024 Jul. J Orthop Translat. 2024. PMID: 39040490 Free PMC article.
-
Noncoding RNAs in subchondral bone osteoclast function and their therapeutic potential for osteoarthritis.Arthritis Res Ther. 2020 Nov 25;22(1):279. doi: 10.1186/s13075-020-02374-x. Arthritis Res Ther. 2020. PMID: 33239099 Free PMC article. Review.
-
Apelin Affects the Progression of Osteoarthritis by Regulating VEGF-Dependent Angiogenesis and miR-150-5p Expression in Human Synovial Fibroblasts.Cells. 2020 Mar 2;9(3):594. doi: 10.3390/cells9030594. Cells. 2020. PMID: 32131466 Free PMC article.
-
Proteoglycans isolated from the bramble shark cartilage show potential anti-osteoarthritic properties.Inflammopharmacology. 2019 Feb;27(1):175-187. doi: 10.1007/s10787-018-00554-5. Epub 2019 Jan 1. Inflammopharmacology. 2019. PMID: 30600472
-
Combined extracorporeal shockwave therapy and exercise for the treatment of tendinopathy: A narrative review.Sports Med Health Sci. 2021 Nov 11;4(1):8-17. doi: 10.1016/j.smhs.2021.11.002. eCollection 2022 Mar. Sports Med Health Sci. 2021. PMID: 35782779 Free PMC article. Review.
References
-
- Lane NE, Nevitt MC. Osteoarthritis, bone mass, and fractures: how are they related? Arthritis Rheum. 2002;46:1–4. - PubMed
-
- Oettmeier R, Abendroth K. Osteoarthritis and bone: osteologic types of osteoarthritis of the hip. Skeletal Radiol. 1989;18:165–74. - PubMed
-
- Burr DB, Schaffler MB. The involvement of subchondral mineralized tissues in osteoarthrosis: quantitative microscopic evidence. Microsc Res Tech. 1997;37:343–57. - PubMed
-
- Burr DB. The importance of subchondral bone in osteoarthrosis. Curr Opin Rheumatol. 1998;10:256–62. - PubMed
MeSH terms
LinkOut - more resources
Full Text Sources
Other Literature Sources
Medical
Miscellaneous
