

Characterization of the serum and liver proteomes in gut-microbiota-lacking mice
- PMID: 28367086
- PMCID: PMC5370288
- DOI: 10.7150/ijms.17792
Characterization of the serum and liver proteomes in gut-microbiota-lacking mice
Abstract
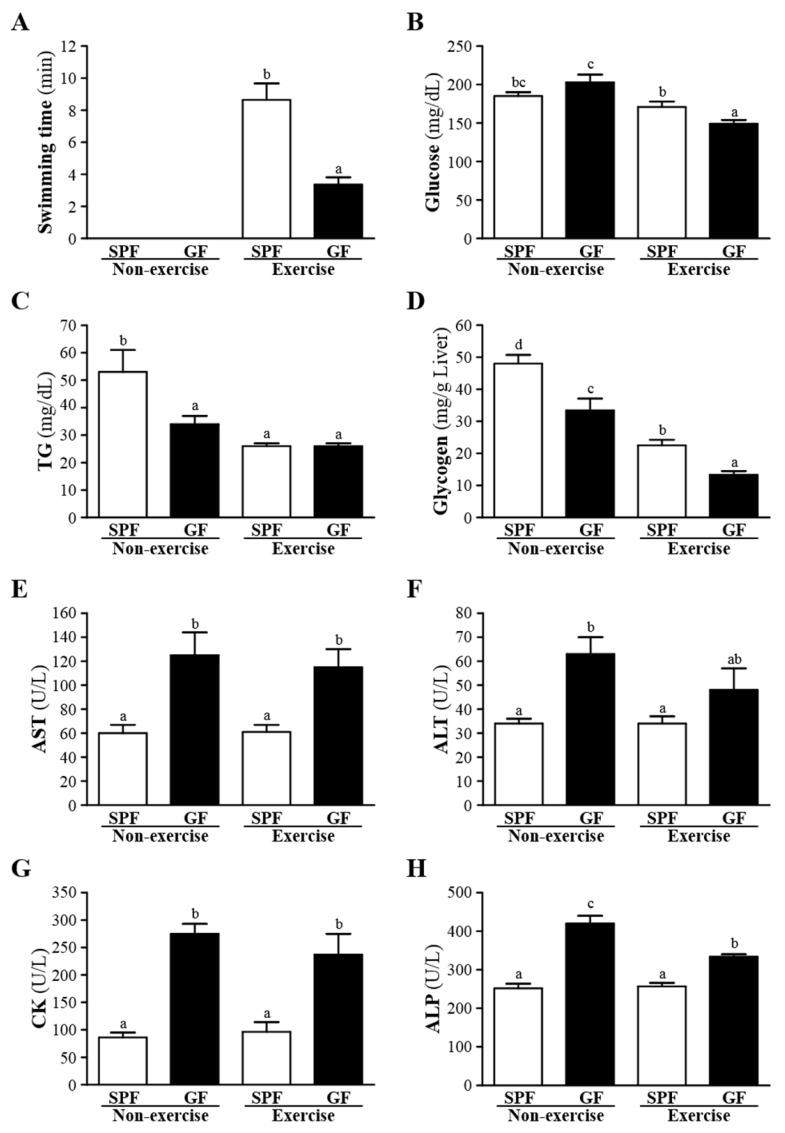
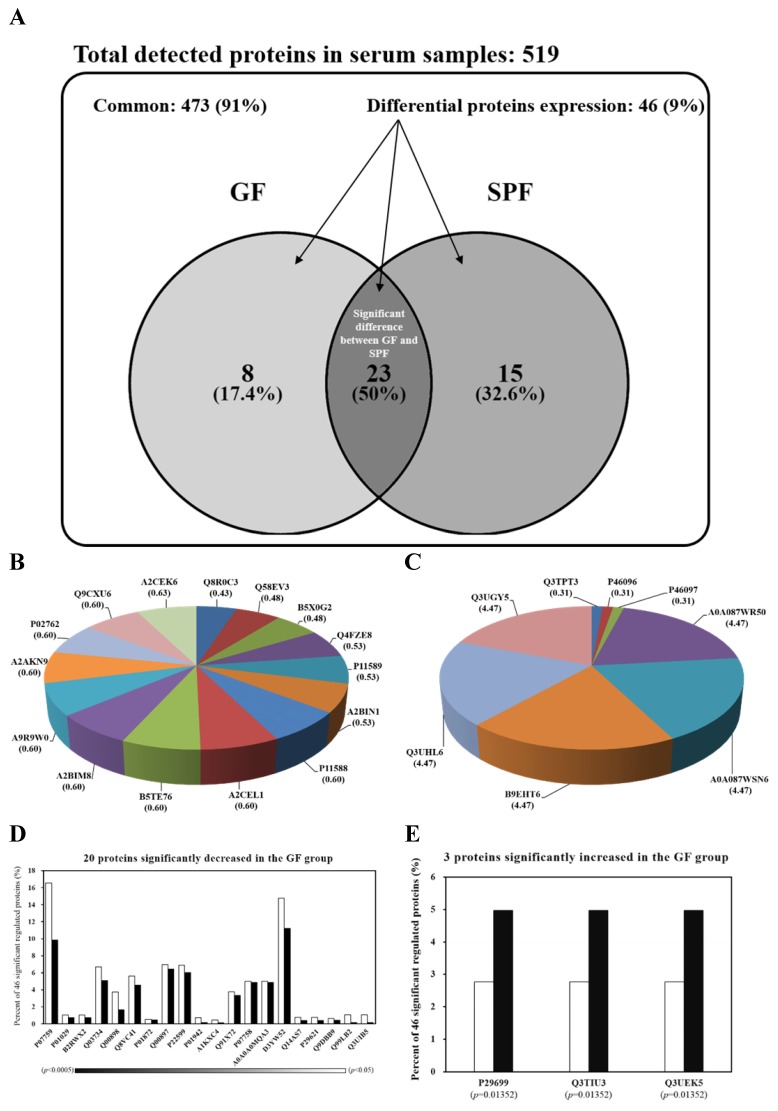
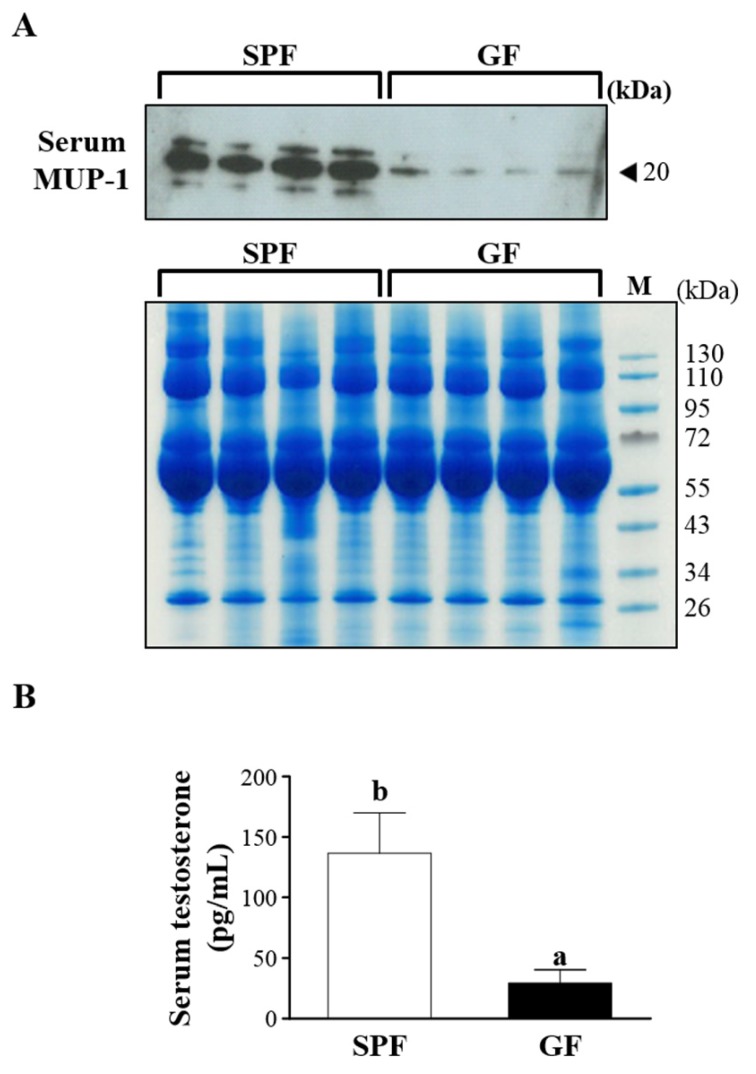
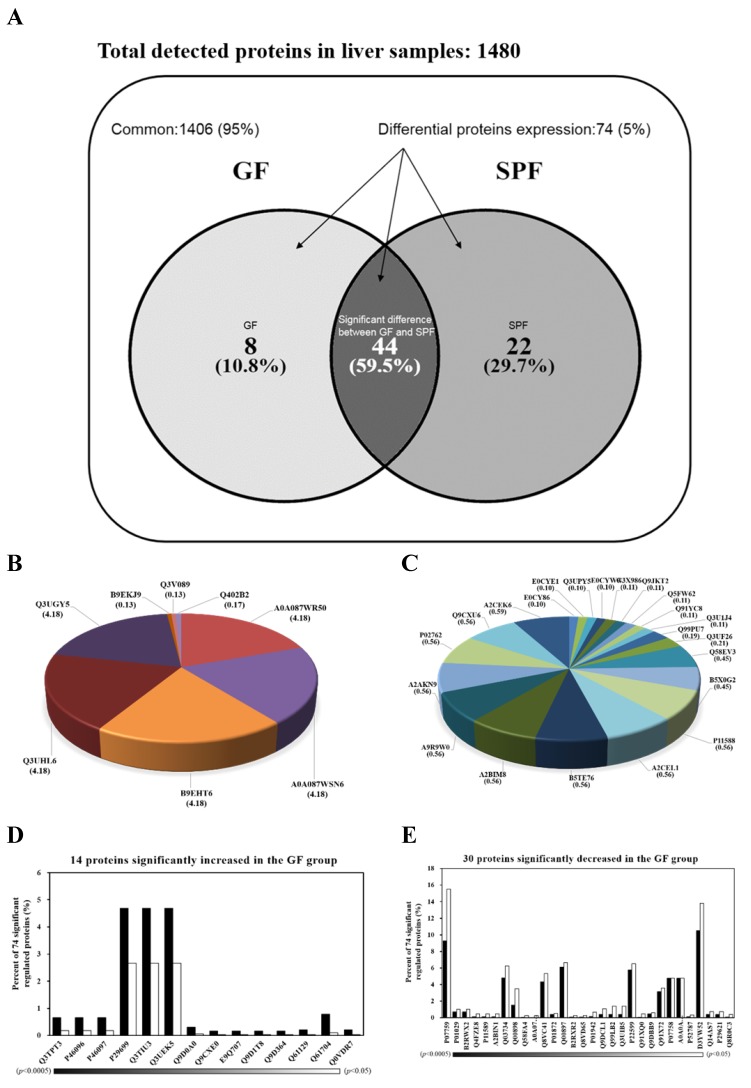
Current nutrition research is focusing on health promotion, disease prevention, and performance improvement for individuals and communities around the world. The humans with required nutritional ingredients depend on both how well the individual is provided with balanced foods and what state of gut microbiota the host has. Studying the mutually beneficial relationships between gut microbiome and host is an increasing attention in biomedical science. The purpose of this study is to understand the role of gut microbiota and to study interactions between gut microbiota and host. In this study, we used a shotgun proteomic approach to reveal the serum and liver proteomes in gut-microbiota-lacking mice. For serum, 15 and 8 proteins were uniquely detected in specific-pathogen-free (SPF) and germ-free (GF) mice, respectively, as well as the 3 and 20 proteins were significantly increased and decreased, respectively, in GF mice compared to SPF mice. Among the proteins of the serum, major urinary protein 1 (MUP-1) of GF mice was significantly decreased compared to SPF mice. In addition, MUP-1 expression is primarily regulated by testosterone. Lacking in gut flora has been implicated in many adverse effects, and now we have found its pathogenic root maybe gut bacteria can regulate the sex-hormone testosterone levels. In the liver, 8 and 22 proteins were uniquely detected in GF mice and SPF mice, respectively, as well as the 14 and 30 proteins were significantly increased and decreased, respectively, in GF mice compared to SPF mice. Furthermore, ingenuity pathway analysis (IPA) indicated that gut microbiota influence the host in cancer, organismal injury and abnormalities, respiratory disease; cell cycle, cellular movement and tissue development; cardiovascular disease, reproductive system disease; and lipid metabolism, molecular transport and small molecule biochemistry. Our findings provide more detailed information of the role of gut microbiota and will be useful to help study gut bacteria and disease prevention.
Keywords: Biomarker; Endurance swimming; Exercise; Germ-free; Gut flora; Metabolism.
Conflict of interest statement
Competing Interests: The authors have declared that no competing interest exists.
Figures
Similar articles
-
Gut microbiota of mice putatively modifies amino acid metabolism in the host brain.Br J Nutr. 2017 Mar;117(6):775-783. doi: 10.1017/S0007114517000678. Epub 2017 Apr 10. Br J Nutr. 2017. PMID: 28393748
-
Effect of intestinal microbiota on exercise performance in mice.J Strength Cond Res. 2015 Feb;29(2):552-8. doi: 10.1519/JSC.0000000000000644. J Strength Cond Res. 2015. PMID: 25144131
-
Colonization by non-pathogenic bacteria alters mRNA expression of cytochromes P450 in originally germ-free mice.Folia Microbiol (Praha). 2017 Nov;62(6):463-469. doi: 10.1007/s12223-017-0517-8. Epub 2017 Mar 23. Folia Microbiol (Praha). 2017. PMID: 28337589
-
Gut microbiota and host metabolism in liver cirrhosis.World J Gastroenterol. 2015 Nov 7;21(41):11597-608. doi: 10.3748/wjg.v21.i41.11597. World J Gastroenterol. 2015. PMID: 26556989 Free PMC article. Review.
-
Microbial metaproteomics for characterizing the range of metabolic functions and activities of human gut microbiota.Proteomics. 2015 Oct;15(20):3424-38. doi: 10.1002/pmic.201400571. Epub 2015 May 28. Proteomics. 2015. PMID: 25914197 Free PMC article. Review.
Cited by
-
Depletion of Gram-Positive Bacteria Impacts Hepatic Biological Functions During the Light Phase.Int J Mol Sci. 2019 Feb 14;20(4):812. doi: 10.3390/ijms20040812. Int J Mol Sci. 2019. PMID: 30769793 Free PMC article.
-
Mutual Interactions among Exercise, Sport Supplements and Microbiota.Nutrients. 2019 Dec 20;12(1):17. doi: 10.3390/nu12010017. Nutrients. 2019. PMID: 31861755 Free PMC article. Review.
-
Probiotic Lactiplantibacillus plantarum Tana Isolated from an International Weightlifter Enhances Exercise Performance and Promotes Antifatigue Effects in Mice.Nutrients. 2022 Aug 12;14(16):3308. doi: 10.3390/nu14163308. Nutrients. 2022. PMID: 36014816 Free PMC article.
-
Replication Study: Intestinal inflammation targets cancer-inducing activity of the microbiota.Elife. 2018 Oct 8;7:e34364. doi: 10.7554/eLife.34364. Elife. 2018. PMID: 30295289 Free PMC article.
-
Effects of Limosilactobacillus reuteri ID-D01 Probiotic Supplementation on Exercise Performance and Gut Microbiota in Sprague-Dawley Rats.Probiotics Antimicrob Proteins. 2024 Apr 18. doi: 10.1007/s12602-024-10257-9. Online ahead of print. Probiotics Antimicrob Proteins. 2024. PMID: 38635106
References
-
- Chuang H.L, Huang Y.T, Chiu C.C, Liao CD Hsu, F.L Huang, C.C Hou, C.C. Metabolomics characterization of energy metabolism reveals glycogen accumulation in gut-microbiota-lacking mice. J Nutr Biochem. 2012;23:752–58. - PubMed
-
- Hsu Y.J, Chiu C.C, Li Y.P, Huang W.C, Huang Y.T, Huang C.C, Chuang H.L. Effect of intestinal microbiota on exercise performance in mice. J Strength Cond Res. 2015;29:552–8. - PubMed
MeSH terms
Substances
LinkOut - more resources
Full Text Sources
Other Literature Sources
Research Materials
