

Analysis of a Compartmental Model of Endogenous Immunoglobulin G Metabolism with Application to Multiple Myeloma
- PMID: 28367126
- PMCID: PMC5355465
- DOI: 10.3389/fphys.2017.00149
Analysis of a Compartmental Model of Endogenous Immunoglobulin G Metabolism with Application to Multiple Myeloma
Abstract
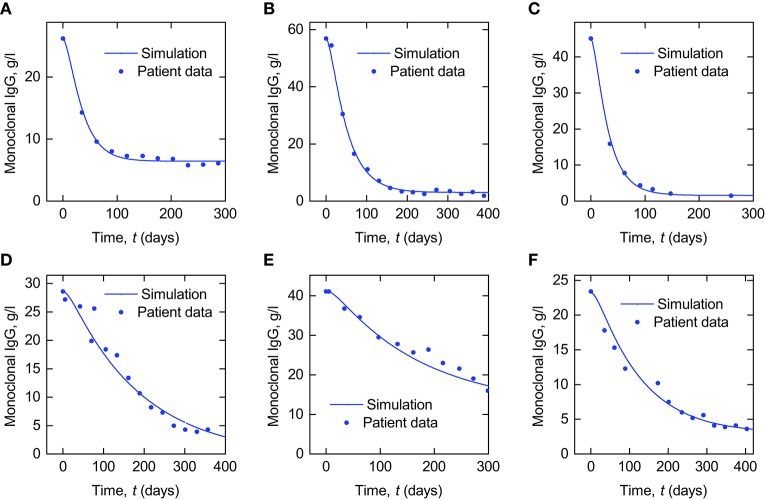
Immunoglobulin G (IgG) metabolism has received much attention in the literature for two reasons: (i) IgG homeostasis is regulated by the neonatal Fc receptor (FcRn), by a pH-dependent and saturable recycling process, which presents an interesting biological system; (ii) the IgG-FcRn interaction may be exploitable as a means for extending the plasma half-life of therapeutic monoclonal antibodies, which are primarily IgG-based. A less-studied problem is the importance of endogenous IgG metabolism in IgG multiple myeloma. In multiple myeloma, quantification of serum monoclonal immunoglobulin plays an important role in diagnosis, monitoring and response assessment. In order to investigate the dynamics of IgG in this setting, a mathematical model characterizing the metabolism of endogenous IgG in humans is required. A number of authors have proposed a two-compartment nonlinear model of IgG metabolism in which saturable recycling is described using Michaelis-Menten kinetics; however it may be difficult to estimate the model parameters from the limited experimental data that are available. The purpose of this study is to analyse the model alongside the available data from experiments in humans and estimate the model parameters. In order to achieve this aim we linearize the model and use several methods of model and parameter validation: stability analysis, structural identifiability analysis, and sensitivity analysis based on traditional sensitivity functions and generalized sensitivity functions. We find that all model parameters are identifiable, structurally and taking into account parameter correlations, when several types of model output are used for parameter estimation. Based on these analyses we estimate parameter values from the limited available data and compare them with previously published parameter values. Finally we show how the model can be applied in future studies of treatment effectiveness in IgG multiple myeloma with simulations of serum monoclonal IgG responses during treatment.
Keywords: biomedical systems; identifiability; immunoglobulin G; lumped-parameter systems; metabolism; multiple myeloma; parameter identification; sensitivity analysis.
Figures
Similar articles
-
Parameter Identification for a Model of Neonatal Fc Receptor-Mediated Recycling of Endogenous Immunoglobulin G in Humans.Front Immunol. 2019 Apr 8;10:674. doi: 10.3389/fimmu.2019.00674. eCollection 2019. Front Immunol. 2019. PMID: 31024535 Free PMC article.
-
The neonatal Fc receptor (FcRn) binds independently to both sites of the IgG homodimer with identical affinity.MAbs. 2015;7(2):331-43. doi: 10.1080/19420862.2015.1008353. MAbs. 2015. PMID: 25658443 Free PMC article.
-
Analysis of the pH dependence of the neonatal Fc receptor/immunoglobulin G interaction using antibody and receptor variants.Biochemistry. 1995 Nov 14;34(45):14649-57. doi: 10.1021/bi00045a005. Biochemistry. 1995. PMID: 7578107
-
Neonatal Fc receptor (FcRn): a novel target for therapeutic antibodies and antibody engineering.J Drug Target. 2014 May;22(4):269-78. doi: 10.3109/1061186X.2013.875030. Epub 2014 Jan 9. J Drug Target. 2014. PMID: 24404896 Review.
-
FcRn: from molecular interactions to regulation of IgG pharmacokinetics and functions.Curr Top Microbiol Immunol. 2014;382:249-72. doi: 10.1007/978-3-319-07911-0_12. Curr Top Microbiol Immunol. 2014. PMID: 25116104 Review.
Cited by
-
Defining the undetectable: The current landscape of minimal residual disease assessment in multiple myeloma and goals for future clarity.Blood Rev. 2021 Mar;46:100732. doi: 10.1016/j.blre.2020.100732. Epub 2020 Jul 10. Blood Rev. 2021. PMID: 32771227 Free PMC article. Review.
-
Early Dynamics and Depth of Response in Multiple Myeloma Patients Treated With BCMA CAR-T Cells.Front Oncol. 2021 Dec 6;11:783703. doi: 10.3389/fonc.2021.783703. eCollection 2021. Front Oncol. 2021. PMID: 34938662 Free PMC article.
-
Ebola virus antibody decay-stimulation in a high proportion of survivors.Nature. 2021 Feb;590(7846):468-472. doi: 10.1038/s41586-020-03146-y. Epub 2021 Jan 27. Nature. 2021. PMID: 33505020 Free PMC article.
-
M281, an Anti-FcRn Antibody: Pharmacodynamics, Pharmacokinetics, and Safety Across the Full Range of IgG Reduction in a First-in-Human Study.Clin Pharmacol Ther. 2019 Apr;105(4):1031-1039. doi: 10.1002/cpt.1276. Epub 2018 Dec 4. Clin Pharmacol Ther. 2019. PMID: 30402880 Free PMC article. Clinical Trial.
-
Population Pharmacokinetic Modelling of Intravenous Immunoglobulin Treatment in Patients with Guillain-Barré Syndrome.Clin Pharmacokinet. 2022 Sep;61(9):1285-1296. doi: 10.1007/s40262-022-01136-z. Epub 2022 Jul 4. Clin Pharmacokinet. 2022. PMID: 35781631 Free PMC article.
References
-
- Anderson D. H. (1983). Compartmental Modeling and Tracer Kinetics, Volume 50 of Lecture Notes in Biomathematics. Berlin; Heidelberg: Springer-Verlag.
-
- Banks H. T., Dediu S., Ernstberger S. L. (2007). Sensitivity functions and their use in inverse problems. J. Inv. Ill-Posed Problems 15, 683–708. 10.1515/jiip.2007.038 - DOI
-
- Bellman R., Åström K. (1970). On structural identifiability. Math. Biosci. 7, 329–339. 10.1016/0025-5564(70)90132-X - DOI
LinkOut - more resources
Full Text Sources
Other Literature Sources