. 2017 Mar 28:5:e3138.
doi: 10.7717/peerj.3138. eCollection 2017.

SLIMM: species level identification of microorganisms from metagenomes

Affiliations

SLIMM: species level identification of microorganisms from metagenomes

Temesgen Hailemariam Dadi et al. PeerJ. .

Abstract

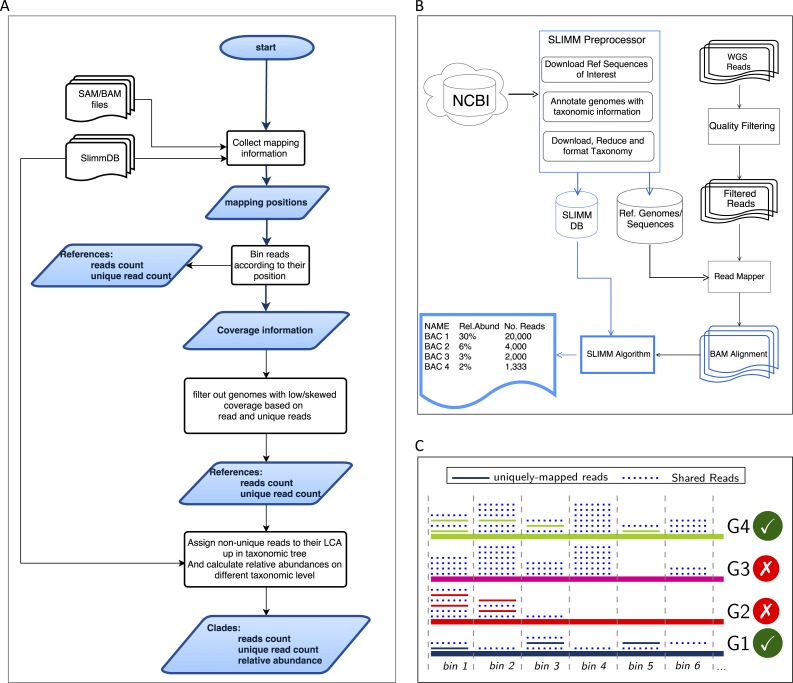
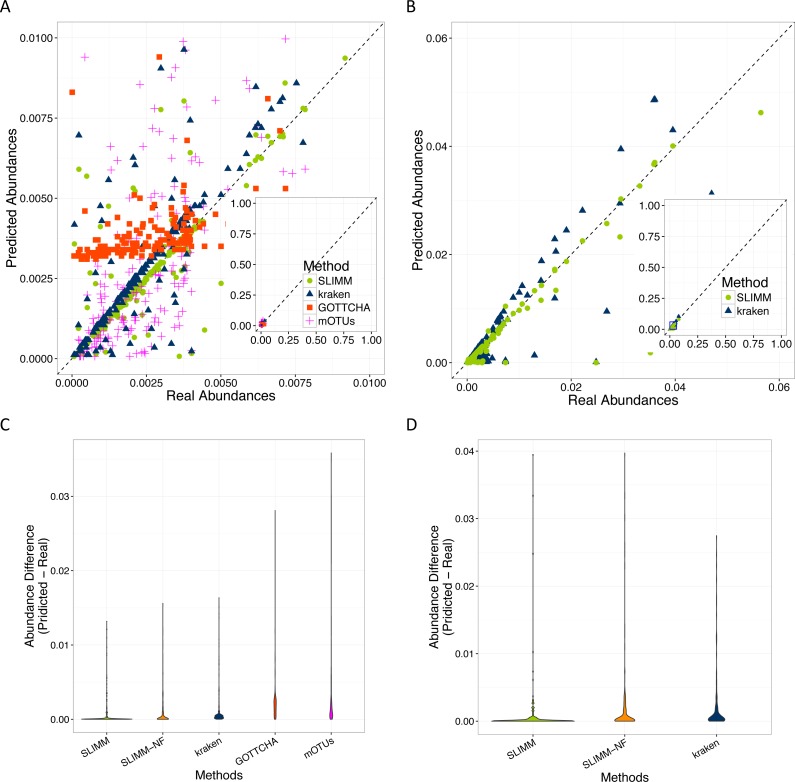
Identification and quantification of microorganisms is a significant step in studying the alpha and beta diversities within and between microbial communities respectively. Both identification and quantification of a given microbial community can be carried out using whole genome shotgun sequences with less bias than when using 16S-rDNA sequences. However, shared regions of DNA among reference genomes and taxonomic units pose a significant challenge in assigning reads correctly to their true origins. The existing microbial community profiling tools commonly deal with this problem by either preparing signature-based unique references or assigning an ambiguous read to its least common ancestor in a taxonomic tree. The former method is limited to making use of the reads which can be mapped to the curated regions, while the latter suffer from the lack of uniquely mapped reads at lower (more specific) taxonomic ranks. Moreover, even if the tools exhibited good performance in calling the organisms present in a sample, there is still room for improvement in determining the correct relative abundance of the organisms. We present a new method Species Level Identification of Microorganisms from Metagenomes (SLIMM) which addresses the above issues by using coverage information of reference genomes to remove unlikely genomes from the analysis and subsequently gain more uniquely mapped reads to assign at lower ranks of a taxonomic tree. SLIMM is based on a few, seemingly easy steps which when combined create a tool that outperforms state-of-the-art tools in run-time and memory usage while being on par or better in computing quantitative and qualitative information at species-level.

Keywords: Metagenomics; Microbial communities; Microbiology; Microorganisms; NGS data; Taxonomic profiling.


Conflict of interest statement

The authors declare there are no competing interests.

Figures

Figure 1
Figure 1. Overview of the SLIMM methodology: (A) The SLIMM algorithm: SLIMM takes two inputs, i.e., the SLIMMDB and an alignment file in either SAM or BAM format and calculates statistical data for each reference sequences in the database. SLIMM uses coverage information to leave out reference sequences from consideration and recalculate the statistics again. We use this, in turn, to receive read counts that are uniquely mapped to a clade at a given taxonomic rank. (B) SLIMM Pipeline: the preprocessing module of SLIMM downloads/updates all available genomes of a certain interest group (e.g., Archaea, Bacteria, Viruses or any combination of them) and tags the sequences with their corresponding taxonomic information. A read mapper is then used to map the WGS reads to these reference sequences. Then SLIMM algorithm uses the mapping results to produces taxonomic profile reports. (C) Reference filtering based on coverage information: an illustration of how SLIMM uses reference filtering based on coverage information: G2 and G3 could not pass the filtering steps because they did not contain enough coverage by uniquely mapped reads and all reads respectively.
Figure 2
Figure 2. PR Curves: comparison of SLIMM against existing methods (A) and (B): true Positive Rate(TPR)/recall drawn against precision. SLIMM showed the highest performance. GOTTCHA did not discover any false positives but is low in recall. PR curves different variants of SLIMM (C) and (D): SLIMM i.e., SLIMM-DG (with digital normalization), SLIMM-NF (without filtration step based on coverage landscape), SLIMM-NF-DG (without filtration but with digital normalization) and SLIMM using alignment produced by the read mapper Bowtie2.
Figure 3
Figure 3. Predicting abundances correctly (A)—Random Dataset and (B)—CAMI Dataset: Abundances predicted by different tools compared to the true abundance used for simulation. SLIMM predicted the abundances more accurately than the other tools. Kraken overestimates the abundance. GOTTCHA and mOTUs did not perform well in predicting the abundances. Violin plots (C)—Random Dataset and (D)—CAMI Dataset: SLIMM has the lowest divergence from true abundances.

References

    1. Brady A, Salzberg SL. Phymm and PhymmBL: metagenomic phylogenetic classification with interpolated Markov models. Nature Methods. 2009;6(9):673–676. doi: 10.1038/nmeth.1358. - DOI - PMC - PubMed
    1. Brown CT, Howe A, Zhang Q, Pyrkosz AB, Brom TH. A reference-free algorithm for computational normalization of shotgun sequencing data. 20121203.4802
    1. Döring A, Weese D, Rausch T, Reinert K. SeqAn an efficient, generic C++ library for sequence analysis. BMC Bioinformatics. 2008;9:11. doi: 10.1186/1471-2105-9-11. - DOI - PMC - PubMed
    1. Francis OE, Bendall M, Manimaran S, Hong C, Clement NL, Castro-Nallar E, Snell Q, Schaalje GB, Clement MJ, Crandall KA, Johnson WE. Pathoscope: species identification and strain attribution with unassembled sequencing data. Genome Research. 2013;23(10):1721–1729. doi: 10.1101/gr.150151.112. - DOI - PMC - PubMed
    1. Freitas TA, Li PE, Scholz MB, Chain PS. Accurate read-based metagenome characterization using a hierarchical suite of unique signatures. Nucleic Acids Research. 2015;43(10):e69. doi: 10.1093/nar/gkv180. - DOI - PMC - PubMed

LinkOut - more resources