. 2017 Mar 1:14:580-590.
doi: 10.1016/j.nicl.2017.02.021. eCollection 2017.

Increased long distance event-related gamma band connectivity in Alzheimer's disease

Affiliations

Increased long distance event-related gamma band connectivity in Alzheimer's disease

Erol Başar et al. Neuroimage Clin. .

Abstract

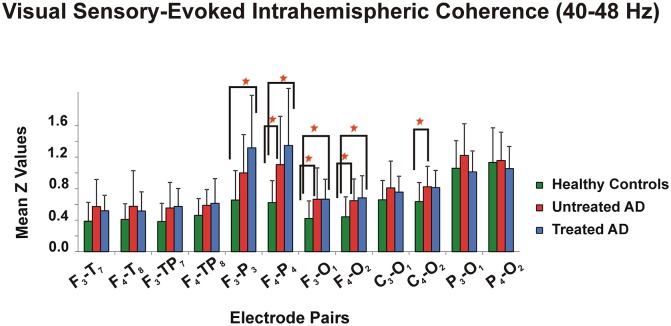
Background: Brain oscillatory responses can be used for non-invasive analyses of cortico-cortical connectivity, local neuronal synchronization, and coherence of oscillations in many neuropsychiatric conditions including Alzheimer's disease (AD). In the present paper, we examine sensory-evoked and event-related gamma coherences elicited by visual stimuli in three sub-gamma bands in two sub-groups of patients with AD (i.e., acetylcholinesterase-inhibitor treated and untreated) and healthy controls.

Methods: We studied a total of 39 patients with probable mild AD (according to NINCDS-ADRDA criteria) who had been sub-divided into untreated (n = 21) and treated (n = 18) (patients either on cholinergic monotherapy or combined therapy with memantine) AD groups, and 21 age-, gender-, and education-matched healthy elderly controls. A simple flash visual paradigm was applied for the acquisition of sensory-evoked coherences. Event-related coherences were elicited using a classical visual oddball paradigm. Both sensory-evoked and event-related gamma coherences were calculated for long-distance intrahemispheric pairs for three frequency ranges: 25-30 Hz, 30-35 Hz, and 40-48 Hz in post-stimulus 0-800 ms duration. The long-distance intrahemispheric pairs from both sides were fronto-parietal, fronto-temporal, fronto-temporoparietal, fronto-occipital, centro-occipital and parieto-occipital.

Results: The sensory-evoked or event-related gamma coherences revealed that both treated and untreated AD patients had significantly increased values compared to healthy controls in all three sub-gamma bands. Moreover, the treated AD patients demonstrated significantly higher fronto-parietal gamma coherences during both sensory stimulation and oddball paradigm and lower occipito-parietal coherences during oddball paradigm in comparison to untreated AD patients.

Conclusion: The present study demonstrated that an increase of gamma coherences was present in response to both visual sensory and cognitive stimulation in AD patients in all gamma sub-bands. Therefore, gamma oscillatory activity seems to be fundamental in brain functions at both the sensory and cognitive levels. The increase of gamma coherence values was not due to cholinergic treatment to any significant extent, as both treated and untreated AD patients had increased gamma coherence values compared to healthy controls. The use of coherence values reflecting brain connectivity holds potential for neuroimaging of AD and understanding brain dynamics related to the effects of medication.

Keywords: Alzheimer's disease; Coherence; Connectivity; EEG; Event-related; Gamma; Sensory-evoked.


Figures

Fig. 1
Fig. 1
Grand averages of visual sensory-evoked gamma (25–48 Hz) coherences for a) F3-P3 and b) F4-P4 electrode pairs. Green line refers healthy controls, red line refers untreated AD patients, and blue line refers treated AD patients.
Fig. 2
Fig. 2
Mean Z values with standard deviation of healthy controls, treated AD patients, and untreated AD patients for visual sensory-evoked coherences in the 25–30 Hz frequency range upon simple light stimulation (“*” represents p < 0.05).
Fig. 3
Fig. 3
Visual sensory-evoked coherences in the 25–30 Hz frequency range were significantly different between groups in the fronto-parietal, fronto-temporoparietal, and fronto-occipital regions. “*” indicates that untreated AD patients had significantly higher sensory-evoked coherences than healthy controls; “†” indicates that treated AD patients had significantly higher sensory-evoked coherences than healthy controls; “‡” indicates that treated AD patients had significantly higher sensory-evoked coherences than untreated AD patients; “§” indicates untreated AD patients had significantly higher sensory-evoked coherences than treated AD patients. Error bars indicate standard errors of the mean.
Fig. 4
Fig. 4
Mean Z values with standard deviation of healthy controls, treated AD patients, and untreated AD patients for visual sensory-evoked coherences in the 30–35 Hz frequency range upon simple light stimulation (“*” represents p < 0.05).
Fig. 5
Fig. 5
Visual sensory-evoked coherences in the 30–35 Hz frequency range were significantly different between groups in the fronto-parietal, fronto-temporoparietal, fronto-occipital, and centro-occipital regions. “*” indicates that untreated AD patients had significantly higher sensory-evoked coherences than healthy controls; “†” indicates that treated AD patients had significantly higher sensory-evoked coherences than healthy controls; “‡” indicates that treated AD patients had significantly higher sensory-evoked coherences than untreated AD patients; “§” indicates untreated AD patients had significantly higher sensory-evoked coherences than treated AD patients. Error bars indicate standard errors of the mean.
Fig. 6
Fig. 6
Mean Z values with standard deviation of healthy controls, treated AD patients, and untreated AD patients for visual sensory-evoked coherences in the 40–48 Hz frequency range upon simple light stimulation (“*” represents p < 0.05).
Fig. 7
Fig. 7
Visual sensory-evoked coherences in the 40–48 Hz frequency range were significantly different between groups in the fronto-parietal, fronto-temporal, fronto-temporoparietal, fronto-occipital, and centro-occipital regions. “*” indicates that untreated AD patients had significantly higher sensory-evoked coherences than healthy controls; “†” indicates that treated AD patients had significantly higher sensory-evoked coherences than healthy controls; “‡” indicates that treated AD patients had significantly higher sensory-evoked coherences than untreated AD patients; “§” indicates untreated AD patients had significantly higher sensory-evoked coherences than treated AD patients. Error bars indicate standard errors of the mean.
Fig. 8
Fig. 8
Grand averages of visual event-related gamma (25–48 Hz) coherences for a) F3-P3 and b) F4-P4 electrode pairs. Green line refers healthy controls, red line refers untreated AD patients, and blue line refers treated AD patients.
Fig. 9
Fig. 9
Mean Z values with standard deviation of healthy controls, treated AD patients, and untreated AD patients for visual event-related coherences in the 25–30 Hz frequency range upon application of target stimuli (“*” represents p < 0.05).
Fig. 10
Fig. 10
Visual event-related coherences in the 25–30 Hz frequency range were significantly different between groups in the fronto-parietal, fronto-temporal, fronto-temporoparietal, fronto-occipital, centro-occipital, and parieto-occipital regions. “*” indicates that untreated AD patients had significantly higher event-related coherences than healthy controls; “†” indicates that treated AD patients had significantly higher event-related coherences than healthy controls; “‡” indicates that treated AD patients had significantly higher event-related coherences than untreated AD patients; “§” indicates untreated AD patients had significantly higher event-related coherences than treated AD patients. Error bars indicate standard errors of the mean.
Fig. 11
Fig. 11
Mean Z values with standard deviation of healthy controls, treated AD patients, and untreated AD patients for visual event-related coherences in the 30–35 Hz frequency range upon application of target stimuli (“*” represents p < 0.05).
Fig. 12
Fig. 12
Visual event-related coherences in the 30–35 Hz frequency range were significantly different between groups in the fronto-parietal, fronto-temporoparietal, fronto-occipital, centro-occipital, and parieto-occipital regions. “*” indicates that untreated AD patients had significantly higher event-related coherences than healthy controls; “†” indicates that treated AD patients had significantly higher event-related coherences than healthy controls; “‡” indicates that treated AD patients had significantly higher event-related coherences than untreated AD patients; “§” indicates untreated AD patients had significantly higher event-related coherences than treated AD patients. Error bars indicate standard errors of the mean.
Fig. 13
Fig. 13
Mean Z values with standard deviation of healthy controls, treated AD patients, and untreated AD patients for visual event-related coherences in the 40–48 Hz frequency range upon application of target stimuli (“*” represents p < 0.05).
Fig. 14
Fig. 14
Visual event-related coherences in the 40–48 Hz frequency range were significantly different between groups in the fronto-parietal, fronto-temporal, fronto-temporoparietal, fronto-occipital and centro-occipital regions. “*” indicates that untreated AD patients had significantly higher event-related coherences than healthy controls; “†” indicates that treated AD patients had significantly higher event-related coherences than healthy controls; “‡” indicates that treated AD patients had significantly higher event-related coherences than untreated AD patients; “§” indicates untreated AD patients had significantly higher event-related coherences than treated AD patients. Error bars indicate standard errors of the mean.

Similar articles

Cited by

References

    1. Adrian E.D. Olfactory reactions in the brain of the hedgehog. J. Physiol. 1942;31:459–473. - PMC - PubMed
    1. Babiloni C., Del Percio C., Boccardi M., Lizio R., Lopez S., Carducci F., Marzano N., Soricelli A., Ferri R., Triggiani A.I., Prestia A., Salinari S., Rasser P.E., Basar E., Famà F., Nobili F., Yener G., Emek-Savaş D.D., Gesualdo L., Mundi C., Thompson P.M., Rossini P.M., Frisoni G.B. Occipital sources of resting-state alpha rhythms are related to local gray matter density in subjects with amnesic mild cognitive impairment and Alzheimer's disease. Neurobiol. Aging. 2015;36(2):556–570. - PMC - PubMed
    1. Babiloni C., Triggiani A.I., Lizio R., Cordone S., Tattoli G., Bevilacqua V., Soricelli A., Ferri R., Nobili F., Gesualdo L., Millán-Calenti J.C., Buján A., Tortelli R., Cardinali V., Barulli M.R., Giannini A., Spagnolo P., Armenise S., Buenza G., Scianatico G., Logroscino G., Frisoni G.B., Del Percio C. Classification of single normal and Alzheimer's disease individuals from cortical sources of resting state EEG rhythms. Front. Neurosci. 2016;10:47. - PMC - PubMed
    1. Bajo R., Maestú F., Nevado A., Sancho M., Gutiérrez R., Campo P., Castellanos N.P., Gil P., Moratti S., Pereda E., Del-Pozo F. Functional connectivity in mild cognitive impairment during a memory task: implications for the disconnection hypothesis. J. Alzheimers Dis. 2010;22(1):183–193. - PubMed
    1. Başar E. Elsevier; Amsterdam: 1980. EEG–Brain Dynamics. Relation Between EEG and Brain Evoked Potentials; pp. 1–411.

Publication types