. 2017 Jun;42(3):275-305.
doi: 10.1007/s10827-017-0641-0. Epub 2017 Apr 3.

Ionic currents influencing spontaneous firing and pacemaker frequency in dopamine neurons of the ventrolateral periaqueductal gray and dorsal raphe nucleus (vlPAG/DRN): A voltage-clamp and computational modelling study

Affiliations

Ionic currents influencing spontaneous firing and pacemaker frequency in dopamine neurons of the ventrolateral periaqueductal gray and dorsal raphe nucleus (vlPAG/DRN): A voltage-clamp and computational modelling study

Antonios G Dougalis et al. J Comput Neurosci. 2017 Jun.

Abstract

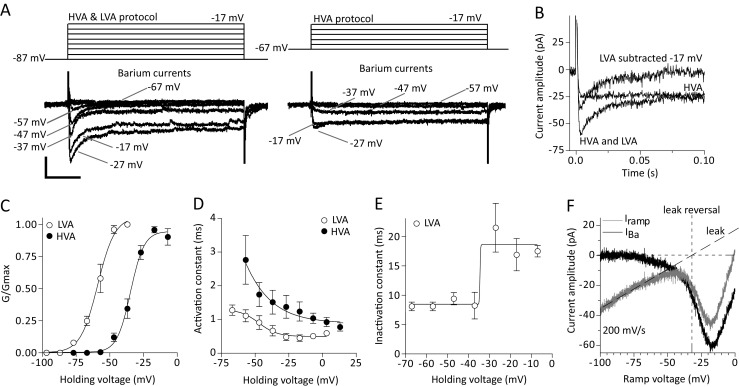
Dopamine (DA) neurons of the ventrolateral periaqueductal gray (vlPAG) and dorsal raphe nucleus (DRN) fire spontaneous action potentials (APs) at slow, regular patterns in vitro but a detailed account of their intrinsic membrane properties responsible for spontaneous firing is currently lacking. To resolve this, we performed a voltage-clamp electrophysiological study in brain slices to describe their major ionic currents and then constructed a computer model and used simulations to understand the mechanisms behind autorhythmicity in silico. We found that vlPAG/DRN DA neurons exhibit a number of voltage-dependent currents activating in the subthreshold range including, a hyperpolarization-activated cation current (IH), a transient, A-type, potassium current (IA), a background, 'persistent' (INaP) sodium current and a transient, low voltage activated (LVA) calcium current (ICaLVA). Brain slice pharmacology, in good agreement with computer simulations, showed that spontaneous firing occurred independently of IH, IA or calcium currents. In contrast, when blocking sodium currents, spontaneous firing ceased and a stable, non-oscillating membrane potential below AP threshold was attained. Using the DA neuron model we further show that calcium currents exhibit little activation (compared to sodium) during the interspike interval (ISI) repolarization while, any individual potassium current alone, whose blockade positively modulated AP firing frequency, is not required for spontaneous firing. Instead, blockade of a number of potassium currents simultaneously is necessary to eliminate autorhythmicity. Repolarization during ISI is mediated initially via the deactivation of the delayed rectifier potassium current, while a sodium background 'persistent' current is essentially indispensable for autorhythmicity by driving repolarization towards AP threshold.

Keywords: Autorhythmicity; Delayed rectifier; Depolarization block; Electrophysiology; Persistent sodium current.


Conflict of interest statement

Conflict of interest

The authors declare that they have no conflict of interest.

Software availability

The model and simulation experiments described herein have been conducted using free access software (NEURON, https://www.neuron.yale.edu/neuron/). Model parameters have been described extensively in the manuscript and model files are freely available from the authors upon request. Upon publication, the files will be made freely available to the modelDB database (https://senselab.med.yale.edu/modeldb/).

Figures

Fig. 1
Fig. 1
Hyperpolarization-activated cation current (IH current). a. Representative voltage-clamp electrophysiological traces from a vlPAG/DRN DA neuron showing the expression of a hyperpolarization-activated inward current (IH) through a single hyperpolarizing step from −62 to −152 mV (500 ms duration). This current was sensitive to ZD 7288 (30 μM), a reputed specific blocker of the IH conductance (scale bars, 50 pA and 125 ms). b. Electrophysiological traces of IH current activation taken from a vlPAG/DRN DA neuron. A series of voltage steps in 10 mV increments was delivered (holding potential −47 mV) from −62 to −152 mV for 1 s (scale bars, 25 pA and 100 ms). c. Average steady-state activation curve (G/Gmax) for the IH conductance for vlPAG/DRN neurons recorded through a series of hyperpolarizing voltage steps from −52 mV to −152 in 10 mV increments as shown in B (n = 6). Normalised conductance plots were fitted with a single Boltzmann function to calculate mean V50 and slope values (activation,-114 mV; slope, −12.7; n = 6). d. Voltage-dependence of IH current activation time constant. Activation time constant was voltage-dependent and become faster at more positive potentials (mean τact of 151 ms at −152 mV). Data were plotted against holding voltage and fitted with a single Boltzmann function to calculate mean V50 (−112.7 mV) and slope (6.1) values (n = 6). e. Representative current-clamp electrophysiological traces taken from a vlPAG/ DRN DA neuron showing the effect of ZD 7288 (30 μM) on firing frequency. The IH blocker did not have any effects on the frequency of firing on this cell (control, 2.3 Hz and in ZD 7288, 2.6 Hz) (scale bars, 10 mV and 1 s). f. Representative current-clamp electrophysiological traces from the neuron in E showing the effect of ZD 7288 (30 μM) on the hyperpolarization-induced voltage-sag. The IH blocker blocked the voltage-sag in response to hyperpolarizing current injection (−60 pA, scale bars, 20 mV and 1 s). g. Bar chart comparison of average firing frequency (Hz) before and after application of ZD 7288 (30 μM) as shown in E for eight vlPAG/DRN DA neurons. ZD 7288 did not induce any significant change in the firing frequency of vlPAG/DRN DA neurons (mean firing frequency in control, 3.1 Hz; in ZD 7288, 3.5 Hz, n = 7, paired t-test; NS, not significant). H. Bar chart comparison of average CV-ISI before and after application of ZD 7288 (30 μM) as shown in E for seven DA neurons. ZD 7288 did not induce any significant change in CV-ISI of vlPAG/DRN DA neurons (mean CV-ISI in control, 0.46; in ZD 7288, 0.44, n = 7, paired t-test; NS, not significant)
Fig. 2
Fig. 2
A-type (IA) potassium current. a. Electrophysiological traces of voltage-clamp recordings (single step from −62 to −102 mV for 250 ms) from a vlPAG/DRN DA neuron before and after addition of 4-aminopyridine (4-AP, 2 mM) in the presence of TTX (1 μM). The outward tail current elicited after the end of the hyperpolarizing step (return to the holding potential of −62 mV) was completely blocked by the IA potassium current blocker 4-AP (scale bars, 50 pA and 100 ms). b. Electrophysiological traces of voltage-clamp recordings (prepulse step of 250 ms from −62 to −112 mV before a series of test steps of 1 s in duration from −92 to +8 mV in 10 mV increments) from a vlPAG/DRN DA neuron before and after addition of 4-aminopyridine (4-AP, 2 mM). The transient outward currents elicited upon depolarization were blocked by the IA potassium current blocker 4-AP leaving a residual sustained current (scale bars, 500 pA and 100 ms). c. Overlaid electrophysiological traces from experiment shown in B depicting transient outward currents (test pulse to −52 mV) before and after addition of 4-aminopyridine (4-AP, 2 mM, inset, scale bars 100 pA and 200 ms) accompanied by an overlay of the digitally subtracted 4-AP sensitive current (bottom traces, scale bars 200 pA and 200 ms) for the whole series of steps shown in B (depicted test steps from −72 to −12 mV). Note that the currents before and after 4-AP ‘cross’ signifying that 4-AP blocks the IA transient outward current but also increases a background conductance. d. Activation of transient and sustained outward potassium currents recorded using a series of depolarizing test pulses (1 s duration, from −92 to +8 mV, 10 mV increments) via two different single prepulses (250 ms duration from −72 to −112 mV and −72 to −52 mV, protocols 1 and 2 respectively) in the presence of TTX (1 μM). Protocol 1 recruited fast activating transient and sustained outward currents using a prepulse to −112 mV to facilitate IA current’s recovery from inactivation, while protocol 2 recruited only slowly activating sustained outward currents using a prepulse to −52 mV to inactivate IA current (scale bars, 500 pA and 500 ms). Digital subtraction of the responses (protocol 1 minus protocol 2) was used to isolate the transient IA potassium conductance from background sustained currents. e. Overlaid electrophysiological traces obtained via voltage protocols 1 and 2 (taken from D). Responses for each protocol together with the resultant digitally subtracted IA current (protocol 1 minus protocol 2) are shown at a single test voltage step of +8 mV for clarity (scale bars, 500 pA and 200 ms). f. Inactivation of transient IA outward potassium current recorded using a series of depolarizing prepulses (1 s duration, from −152 to −52 mV) to differentially recover IA current followed by a test pulse (to −47 mV) to record its activation as a function of the prepulse potential (scale bars, 100 pA and 50 ms). g. Average steady-state activation and inactivation curves (G/Gmax against holding voltage) for the subtracted (protocol 1 minus protocol 2) IA current. Normalised conductance plots were fitted with a single Boltzmann function to calculate mean V50 (activation,-57.5 mV; inactivation, −87.4 mV) and slope (activation, 7.8; inactivation, −6.1) values (n = 6). h. Voltage-dependence of IA current activation time constant. Subtracted IA currents were fitted with a single exponential function (start to peak) at each test holding voltage to calculate the activation time constant. Activation time constant appeared voltage-dependent and became faster at more positive potentials (mean τact of 0.95 ms at +8 mV). Data were plotted against holding voltage and fitted with a single Boltzmann function to calculate mean V50 (−68.8 mV) and slope (−5.0) values (n = 6). i. Voltage-dependence of IA current inactivation time constant. Subtracted IA currents were fitted with a single exponential function (peak to end) at each test holding voltage to calculate the inactivation time constant. Inactivation time constant appeared voltage-dependent and became faster at more positive potentials (mean τina of 50.8 ms at +8 mV). Data were plotted against holding voltage and fitted with a single Boltzmann function to calculate mean V50 (−24.6 mV) and slope (−8.6) values (n = 6). j. Typical electrophysiological traces obtained via activation voltage protocol 1 (as shown in D) in the presence of 10 mM TEA to block delayed rectifier currents as an alternative method to obtain IA currents without digital subtraction between two protocols (e.g. Silva et al. 1990). IA currents obtained exhibited analogous behaviour to that obtained via the two protocol subtraction and the 4-AP subtraction methods (see also online resource 2; scale bars, 500 pA and 250 ms)
Fig. 3
Fig. 3
Delayed rectifier (IKdr) potassium current. a. Top: Representative electrophysiological traces of slowly-activating, sustained, outward potassium currents (IKdr) recorded using a prepulse (from-72 mV to −52 mV for 250 ms) before the delivery of series of depolarizing test steps (1 s duration, from −72 to +8 mV, 10 mV increments) in the presence of 1 μM TTX (scale bars, 100 pA, 100 ms). Bottom: Sustained outward currents and tail currents were sensitive to TEA (10 mM). b. Average steady-state activation curve (G/Gmax) for the slowly-activating, sustained potassium current. Normalised conductance plots were fitted with a single Boltzmann function to calculate mean V50 (−26.9 mV) and slope (13.4) values (n = 6). c. Voltage-dependence of IKdr current activation time constant. Currents were fitted with a single exponential function (start to peak) at each test holding voltage to calculate the activation time constant. Activation time constant appeared voltage-dependent and became faster at more positive potentials (mean τact of 2.8 ms at +8 mV). Data were plotted against holding voltage and fitted with a single Boltzmann function to calculate mean V50 (−38.4 mV) and slope (−6.9) values (n = 6). d. Overlaid electrophysiological traces of deactivating tail currents recorded at −72 mV. Tail currents were evaluated at −72 mV following a prepulse (to −52 mV) and a series of depolarizing test voltage steps (protocol as in A, shown truncated in the inset for clarity) that recruited the Ikdr current (scale bars, 50 pA, 25 ms). e. IKdr tail current deactivation time constant recorded at −72 mV as a function of a series of depolarizing test holding voltages. Tail currents were fitted with a single exponential function (peak to end) and results are plotted against test holding voltage before returning to −72 mV. Deactivation time constant appeared dependent on test voltage and became faster at −72 mV when neurons were returned to that potential from more positive test potentials (mean τdeact of 32 ms following a test pulse at −52 mV and 17 ms following a test pulse at +8 mV). Data were plotted against test holding voltage and fitted with a single Boltzmann function to calculate mean V50 (−38.9 mV) and slope (−11.5) values (n = 6)
Fig. 4
Fig. 4
Calcium currents (ICa). a. Typical electrophysiological traces of inward calcium currents recorded using a series of depolarizing test steps (250 ms duration, holding potential −67 mV, pulses from −67 to +3 mV, 10 mV increments) in the presence of TTX, 4-AP and TEA (see methods). Note that the calcium currents inactivate during the long test step (scale bars, 50 pA and 50 ms). b. Voltage-dependence of activation and inactivation time constants (τact and τina) of recorded calcium currents (as shown in A, n = 4). To measure τact and τina time constants calcium currents were fitted a single exponential function (start to peak and peak to end respectively) at each holding potential. Both τact and τina were voltage-dependent, becoming faster at more positive potentials (mean τact and τina at −47 mV, 1.27 ms and 114 ms; at −17 mV, 0.62 ms and 16.7 ms respectively). Plotted data were then fitted with a single Boltzmann function to calculate mean V50 (activation, −23.8 mV; inactivation, −39.0 mV) and slope (LVA, −6.9; HVA, −2.6) values (n = 4). c. Average steady-state activation curve (G/Gmax) for calcium currents recorded using a series of depolarising pulses (as shown in A). Normalised conductance plot was fitted with a single Boltzmann function to calculate mean V50 (−26.1 mV) and slope (5.0) values for steady state activation (n = 4). d. Fast voltage-ramp (500 mV/s, −107 to +13 mV) depicting the activation of a calcium currents. Two distinct peaks were identified (both sensitive to cadmium, not shown) that indicate that LVA and HVA calcium currents are expressed on this vlPAG/DRN neuron. Leak subtracted current (dotted line) revealed that LVA calcium currents peaked at around −60 mV and HVA calcium currents peaked at around −15 mV. Leak current reversal under these conditions was −55 mV. e. Steady-state activation curves (G/Gmax) for LVA and HVA calcium currents for the neuron shown in D. Normalised conductance plots were fitted with a single Boltzmann function to calculate V50 (LVA, −63.2 mV; HVA, −22.1 mV) and slope (LVA, 2.6; HVA, 6.7) values for steady-state activation. f. Representative electrophysiological traces recorded in current-clamp mode in normal (2 mM) or zero calcium (see methods) aCSF. Substitution of magnesium with calcium increased spontaneous firing of vlPAG/DRN DA neurons without affecting the firing rate regularity (scale bars, 10 mV and 2 s). g. Bar chart comparison of mean firing frequency before and after replacement of 2 mM calcium for magnesium as shown in F for seven vlPAG/DRN DA neurons. This replacement caused a statistically significant change in firing rate (mean firing frequency in 2 mM calcium, 3.3 Hz; in zero mM calcium, 4.9 Hz, n = 6, *P < 0.05, paired t-test). h. Bar chart comparison of CV-ISI before and after replacement of 2 mM calcium for magnesium as shown in F for seven vlPAG/DRN DA neurons. This replacement did not cause a statistically significant change in CV-ISI (mean CV-ISI in 2 mM calcium, 0.66; in zero mM calcium, 0.40, n = 6, P > 0.05, paired t-test, NS, not significant)
Fig. 5
Fig. 5
Barium currents (IBa). a. Typical electrophysiological traces of inward barium currents recorded using two different protocols (differing in their starting holding voltage) for isolating composite LVA/HVA (left) and HVA only (right) barium currents (see methods). Note the transient barium currents in the LVA/HVA protocol and the non-inactivating barium currents in the HVA protocol during the long test step (scale bars, 25 pA and 50 ms). b. Typical electrophysiological traces from HVA/LVA composite and HVA only protocols at a single potential of −17 mV taken from A. Subtraction of the current traces revealed the LVA transient component. c. Average steady-state activation curves (G/Gmax) for LVA and HVA barium currents. Normalised conductance plots were fitted with a single Boltzmann function to calculate mean V50 (LVA, −58.9 mV; HVA, −34.6 mV) and slope (LVA, 6.3; HVA, 5.1) values for activation (n = 6). d. Voltage-dependence of barium LVA and HVA current activation time constant. HVA and subtracted LVA currents were fitted a single exponential function (start to peak) at each test holding voltage to calculate τact for each component. Both HVA and LVA had a τact that was voltage-dependent becoming faster with more positive potentials (mean LVA and HVA τact at −47 mV, 0.91 ms and 1.74 ms; at +3 mV, 0.53 ms and 0.78 ms respectively). Plotted data fitted with a single Boltzmann function to calculate mean V50 (LVA, −49.2 mV; HVA, −39.7 mV) and slope (LVA, −5.8; HVA, −13.4) values (n = 6). e. Voltage-dependence of barium LVA current inactivation time constant. Subtracted LVA currents were fitted a single exponential function (peak to end) at each test holding voltage to calculate the inactivation time constant (τina). Inactivation time constant became slower at more positive voltages (mean τina at −47 mV and +3 mV, 8.5 ms and 16.8 ms respectively). Plotted data were fitted with a single Boltzmann function to calculate the mean V50 (−34.5 mV) and slope (0.37) values for τina (n = 6). f. Fast voltage-ramp (200 mV/s, −107 to +13 mV) taken from the cell shown in A depicting the activation of a background barium current. Leak subtracted current (dotted line) revealed that barium currents peaked at around −20 mV. Fast voltage-ramps in barium were less efficient than voltage steps in isolating the LVA transient (see also Fig. 4d, e for calcium voltage-ramps). Although we did not observe a well-defined peak at the voltage range of −65 to −55 mV we observed the development of an inward current at such potentials well before the expected start of the activation of HVA current (usually around −35 mV, peaking at −15 to −20 mV). Note the change in the slope of the development of the putative LVA and HVA inward barium currents. Plotted voltage-ramp data were fitted with a single Boltzmann function to calculate the mean V50 (−38.9 mV) and slope (6.3) values for barium current steady-state activation. Note that, in the presence of barium, leak current is reversing at around −25 mV which is 30 mV more positive that its reversal when using calcium as the charge carrier suggesting that a barium sensitive leak conductance is operant on vlPAG/DRN DA neurons
Fig. 6
Fig. 6
Transient and persistent sodium currents (INaT and INaP). a. Representative average electrophysiological traces depicting the activation of a transient inward sodium current recorded using a protocol that selectively inactivates axonal sodium currents as described previously (Milescu et al. 2010). Neurons were held at −107 mV and a depolarising pulse (4 ms) was delivered to −47 mV to elicit unclamped sodium currents, followed by a brief 5 ms hyperpolarisation to −77 mV to facilitate recovery of somatic (but not axonal) sodium currents before eliciting a series of test pulses in 5 mV increments and of 110 ms in duration to activate somatic sodium currents. Experiments were conducted in the presence of blockers of potassium and calcium conductances. Note the activation of the unclamped distorted sodium current in the initial depolarising 5 ms step and the gradual incremental nature of the sodium currents during the test pulse. b. Representative average electrophysiological traces taken from cell shown in A depicting the protocol used to study steady-state inactivation of somatic sodium channels. Holding current and initial depolarisation to activate unclamped sodium currents were identical to the one used for the study of steady-state activation (shown in A) but the subsequent 5 ms hyperpolarising pulse varied from −77 mV to −42 mV while the test pulse for studying the inactivation was set constant to −37 mV. c. Representative average electrophysiological traces taken from cell shown in A depicting the persistence of an inward current even after 100 ms of depolarization at different potentials. Test potential are displayed next to each trace. Traces displayed here have not been subtracted for linear leak current. The transient sodium current occurring at the beginning of the traces have been truncated for simplicity. d. Slow voltage-ramp (16 mV/s, −107 to +53 mV) depicting the activation of a background persistent sodium current. Leak subtracted current (dotted line) revealed the activation kinetics of the persistent sodium current (Imax of 15 pA at −57 mV). e. Average steady-state activation/inactivation curves (G/Gmax) for the transient and persistent sodium current (n = 6). Persistent sodium current curves have been quantified via both a prepulse step protocol shown in A and C (n = 6) and through slow voltage ramps as shown in D (n = 3). Normalised conductance plots were fitted with a single Boltzmann function to calculate mean steady-state activation V50 (transient, −45.2 mV; persistent, −56.6 mV) and its slope (transient, 5.3; persistent, 3.3). Ramp voltage determination of persistent sodium current activation had a mean V50 and slope of −60.7 and 2.3 respectively. Mean transient sodium current inactivation V50 and slope values were −62.8 mV and −6.4 respectively. f. Voltage-dependence of INaT current activation and inactivation time constants. INaT currents were fitted a single exponential function (start to peak) and two exponential functions (from peak to end) at each test holding voltage to calculate a single activation (τact) and two (τinaF and τinaS) inactivation time constants respectively. Activation time constant appeared voltage-dependent becoming faster at more positive potentials (mean τact of 705 μs at −47 mV and 147 μs at −2 mV). Data were plotted against holding voltage and fitted with a single Boltzmann function to calculate mean V50 (−34.4 mV) and slope (−5.6) values (n = 6). Inactivation was consistently better fitted with two rather than one exponential functions signifying the presence of a fast and a slow time constant (τinaF and τinaS). The slow decay constant contributed to about 5% of the maximal sodium current, while both fast and slow inactivation exhibited striking voltage dependency. The τinaF became faster at more positive potentials (mean τinaF of 889 μs at −47 mV and 410 μs at −2 mV). Similarly, τinaS also became faster at more positive potentials (mean τinaS of 17.4 ms at −47 mV and 4.2 ms at −2 mV). Data were plotted against holding voltage and fitted with a single Boltzmann function to calculate mean V50 (−46.4 mV and −50.5 mV) and slope (−11.3 and −7.7) values for the τinaF and τinaS components respectively (n = 6). g. Representative electrophysiological traces recorded under current clamp in standard aCSF using KGlu filled electrodes before and after perfusion of TTX (1 μM). Dotted lines are arranged in 10 mV intervals with top line representing the AP threshold. Note that, TTX caused the development of stable, non-oscillating membrane potential below AP threshold in vlPAG/DRN DA neurons. h. Representative electrophysiological trace of averaged (150) action potentials and average membrane potential after TTX superfusion (1 μM) for the cell shown in G. In this cell the membrane potential was on average 7.2 mV more hyperpolarized compared to the average action potential threshold (−43.1 mV)
Fig. 7
Fig. 7
Electrophysiological properties of model DA neuron. a. Representative 2 s simulation trace of spontaneous AP firing in model DA neuron (model parameters detailed in Table 1). Model DA neuron fired APs at 4.6 Hz. b. Detail of a representative AP in model DA neuron and in vitro DA neuron in vlPAG/DRN. Dotted horizontal lines depict the peak of the AP (+ 4 mV), AP threshold (−46 mV) and AHP maximal trough (−72 mV). c. Representative simulation traces depicting model DA neuron behaviour following a 1000 ms incremental hyperpolarizing current injection (−10 to −120 pA). Note that, increasing the magnitude of the hyperpolarizing current injection elicited larger voltage-sag responses and delayed repolarisation to firing in model DA neuron. d. Representative simulation traces of AP firing in model DA neuron following 1000 ms incremental depolarizing current injection (+10 to +120 pA). Note that, increasing the magnitude of the depolarizing current injection elicited higher frequency of firing and eventually lead to depolarization block (cessation of firing) in model DA neuron. e. Input-output relationship for instantaneous and sustained firing frequency following incremental injection of depolarizing current pulses (+10 to +120 pA) in model DA neuron as shown in D. f. Input-output relationship for instantaneous and sustained firing frequency following incremental injection of depolarizing current pulses (+10 to +120 pA) in in vitro vlPAG/DRN DA neurons (n = 5). g. Comparative input-output relationship for the hyperpolarization-induced voltage-sag in DA model (as shown in C) and in vitro vlPAG/DRN DA neurons (n = 8). h. Comparative input-output relationship for delayed repolarisation to firing following the termination of hyperpolarizing current pulses in DA model (as shown in C) and in vitro vlPAG/DRN DA neurons (n = 8)
Fig. 8
Fig. 8
Contribution of individual ionic currents to pacemaker firing frequency and autorhythmicity in model DA neuron. Representative simulation traces depicting the contribution of each individual conductance to AP firing frequency in model DA neuron. Maximal conductance of each current was reduced to 0% of its maximal conductance value (Gmax) and the effects on AP firing frequency were noted. The bar appearing at the end of each trace is the response to a 50 pA depolarising current injection (500 ms). a: The model DA neuron fired APs at a basal firing frequency of 4.6 Hz. b: IA current elimination lead to a two-fold increase in firing frequency of model DA neuron. c: Elimination of the IH current induced a small decrease in firing frequency of model DA neuron. d: Elimination of the ICaHVA did not modify firing frequency of model DA neuron. e: Elimination of the ICaLVA reduced the frequency of firing of model DA neuron by 25%. f: Concomitant elimination of both ICaHVA and ICaLVA calcium conductances did not eliminate spontaneous firing of model DA neuron. g: IM current elimination lead to a two-fold increase in firing frequency of model DA neuron. h: Elimination of IKdr current stopped spontaneous firing of model DA neuron. i: A small increase of IM current (to 125% of basal Gmax) in the absence of a IKdr current restored spontaneous firing of model DA neuron. j: Elimination of INaP current lead to the development of a stable non-oscillating membrane potential below AP threshold. However, upon depolarising current injection the model DA neuron still fired APs. k: Elimination of INaT current lead to the development of an oscillating membrane potential below AP threshold (oscillating range, max, −55 mV; min, −61 mV). Upon depolarising current injection the model DA neuron did not fire APs. l: Concomitant elimination of both INaT and INaP sodium conductances lead to the development of a stable non-oscillating membrane potential (−64 mV) below AP threshold and cessation of spontaneous AP firing. Upon depolarising current injection the model DA neuron did not fire APs. m: A small decrease (to 75% of Gmax) in INaP in the absence of INaT current stopped the development of a background oscillation in model DA neuron. n: A small decrease (to 75% of Gmax) in IM current in the absence of a INaT current was also successful (as was INaP alone, see above M) to stop the development of a background oscillation in model DA neuron
Fig. 9
Fig. 9
Contribution of individual ionic currents to interspike interval (ISI) repolarisation in model DA neuron. a: Simulation trace depicting the voltage trajectory during ISI between two successive APs in model DA neuron. b: Simulation trace depicting the current flowing through three individual outward potassium currents (A, M and Kdr) during the ISI of two successive APs (voltage response as shown in A). Note that, the deactivation of the IKdr facilitates repolarisation from AHP peak to AP threshold while the activation of the IM and IA potassium currents oppose repolarisation. c: Representative simulation traces depicting the kinetics of inward sodium, calcium and H-type currents during the ISI of two successive APs (voltage response as shown in A). Note that, a persistent sodium current (INaP) activated shortly after the AHP peak giving rise to a strong inward current. Similarly, but displaying very different kinetics in activation and magnitude of response, ICaLVA gave rise to a small but non-inactivating inward current during ISI. In contrast, ICaHVA current did not activate at all during ISI, while the small magnitude activation of the IH current (a declining inward conductance) gave rise to a net outward current during ISI.
Fig. 10
Fig. 10
Contribution of individual ionic currents to depolarization block (DB) in model DA neuron. a. Representative 5 s simulation traces depicting the responses of model DA neurons to a sequence of depolarizing current injections (500 ms, black lines) leading to DB under basal control conditions. b. Strong effects of increasing (left, 150% of Gmax) and decreasing (right, 50% of Gmax) of INaT on the threshold of DB. c. Strong effects of increasing (left, 150% of Gmax) and decreasing (right, 50% of Gmax) of INaP on the threshold of DB. The effects of manipulating INaP on DB threshold were in opposite polarity from those observed by manipulation of INaT (see B above). d. No apparent effects of increasing (left, 150% of Gmax) or decreasing (right, 50% of Gmax) of ICaHVA on the threshold of DB. e. No apparent effects of increasing (left, 150% of Gmax) or decreasing (right, 50% of Gmax) of ICaLVA on the threshold of DB

Similar articles

Cited by

References

    1. Beier KT, Steinberg EE, DeLoach KE, Xie S, Miyamichi K, Schwarz L, Gao XJ, Kremer EJ, Malenka RC, Luo L. Circuit architecture of VTA dopamine neurons revealed by systematic input-output mapping. Cell. 2015;162:622–634. doi: 10.1016/j.cell.2015.07.015. - DOI - PMC - PubMed
    1. Bishop MW, Chakraborty S, Matthews GA, Dougalis A, Wood NW, Festenstein R, Ungless MA. Hyperexcitable substantia nigra dopamine neurons in PINK1- and HtrA2/Omi-deficient mice. Journal of Neurophysiology. 2010;104:3009–3020. doi: 10.1152/jn.00466.2010. - DOI - PMC - PubMed
    1. Branch, S. Y., Sharma, R., & Beckstead, M. J. (2014) Aging decreases L-type calcium channel currents and pacemaker firing fidelity in substantia nigra dopamine neurons. The Journal of neuroscience: the official journal of the Society for Neuroscience, 34, 9310–9318 - PMC - PubMed
    1. Brevi S, de Curtis M, Magistretti J. Pharmacological and biophysical characterization of voltage-gated calcium currents in the endopiriform nucleus of the guinea pig. Journal of Neurophysiology. 2001;85:2076–2087. - PubMed
    1. Brown, D. A., & Adams, P. R. (1980) Muscarinic suppression of a novel voltage-sensitive K+ current in a vertebrate neurone. Nature, 283, 673–676. - PubMed