

Ultra-High Field Proton MR Spectroscopy in Early-Stage Amyotrophic Lateral Sclerosis
- PMID: 28367604
- PMCID: PMC5488866
- DOI: 10.1007/s11064-017-2248-2
Ultra-High Field Proton MR Spectroscopy in Early-Stage Amyotrophic Lateral Sclerosis
Erratum in
-
Erratum to: Ultra-High Field Proton MR Spectroscopy in Early-Stage Amyotrophic Lateral Sclerosis.Neurochem Res. 2017 Jun;42(6):1845-1846. doi: 10.1007/s11064-017-2302-0. Neurochem Res. 2017. PMID: 28523531 No abstract available.
Abstract
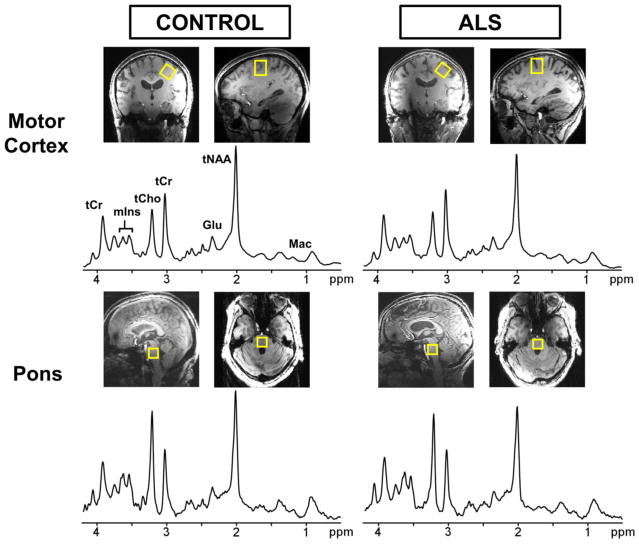
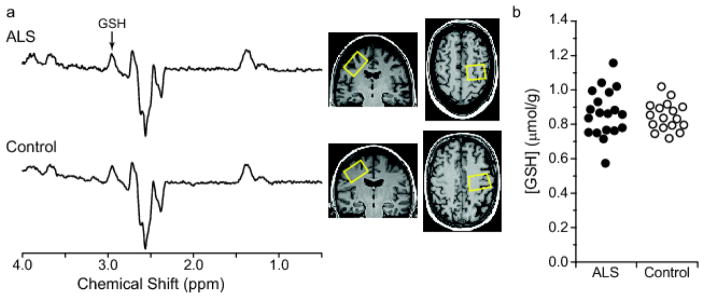
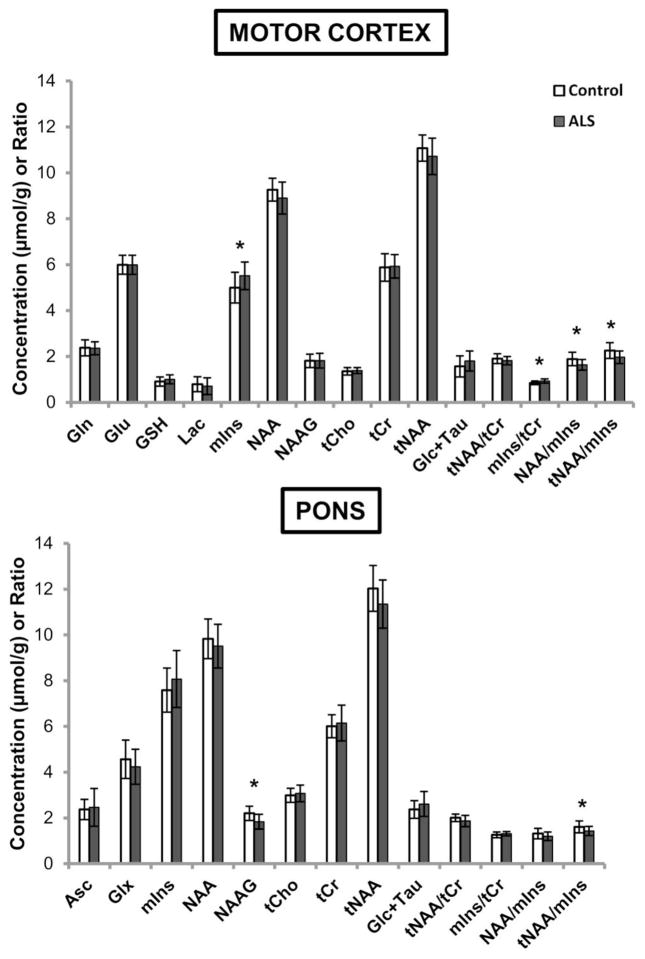
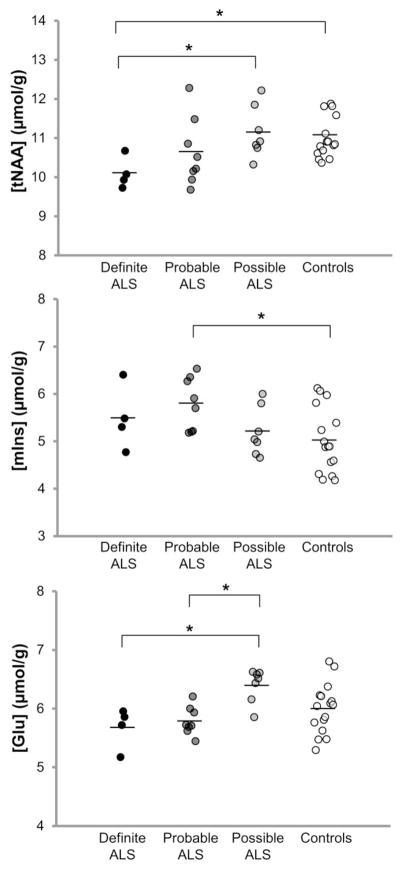
A major hurdle in the development of effective treatments for amyotrophic lateral sclerosis (ALS) has been the lack of robust biomarkers for use as clinical trial endpoints. Neurochemical profiles obtained in vivo by high field proton magnetic resonance spectroscopy (1H-MRS) can potentially provide biomarkers of cerebral pathology in ALS. However, previous 1H-MRS studies in ALS have produced conflicting findings regarding alterations in the levels of neurochemical markers such as glutamate (Glu) and myo-inositol (mIns). Furthermore, very few studies have investigated the neurochemical abnormalities associated with ALS early in its course. In this study, we measured neurochemical profiles using single-voxel 1H-MRS at 7 T (T) and glutathione (GSH) levels using edited MRS at 3 T in 19 subjects with ALS who had relatively high functional status [ALS Functional Rating Scale-Revised (ALSFRS-R) mean ± SD = 39.8 ± 5.6] and 17 healthy controls. We observed significantly lower total N-acetylaspartate over mIns (tNAA/mIns) ratio in the motor cortex and pons of subjects with ALS versus healthy controls. No group differences were detected in GSH at 3 and 7 T. In subjects with ALS, the levels of tNAA, mIns, and Glu in the motor cortex were dependent on the extent of disease represented by El Escorial diagnostic subcategories. Specifically, combined probable/definite ALS had lower tNAA than possible ALS and controls (both p = 0.03), higher mIns than controls (p < 0.01), and lower Glu than possible ALS (p < 0.01). The effect of disease stage on MRS-measured metabolite levels may account for dissimilar findings among previous 1H-MRS studies in ALS.
Keywords: 7 T; ALS; El Escorial; ¹H magnetic resonance spectroscopy.
Figures
References
-
- Kiernan MC, Vucic S, Cheah BC, Turner MR, Eisen A, Hardiman O, Burrell JR, Zoing MC. Amyotrophic lateral sclerosis. Lancet. 2011;377(9769):942–55. - PubMed
-
- Bensimon G, Lacomblez L, Meininger V. A controlled trial of riluzole in amyotrophic lateral sclerosis. ALS/Riluzole Study Group. N Engl J Med. 1994;330(9):585–91. - PubMed
-
- Turner MR, Kiernan MC, Leigh PN, Talbot K. Biomarkers in amyotrophic lateral sclerosis. Lancet Neurol. 2009;8(1):94–109. - PubMed
-
- Foerster BR, Pomper MG, Callaghan BC, Petrou M, Edden RA, Mohamed MA, Welsh RC, Carlos RC, Barker PB, Feldman EL. An imbalance between excitatory and inhibitory neurotransmitters in amyotrophic lateral sclerosis revealed by use of 3-T proton magnetic resonance spectroscopy. JAMA Neurol. 2013;70(8):1009–16. - PMC - PubMed
MeSH terms
Grants and funding
LinkOut - more resources
Full Text Sources
Other Literature Sources
Medical
Miscellaneous
