

Quantitative Susceptibility Mapping Using the Multiple Dipole-inversion Combination with k-space Segmentation Method
- PMID: 28367904
- PMCID: PMC5743526
- DOI: 10.2463/mrms.mp.2016-0062
Quantitative Susceptibility Mapping Using the Multiple Dipole-inversion Combination with k-space Segmentation Method
Abstract
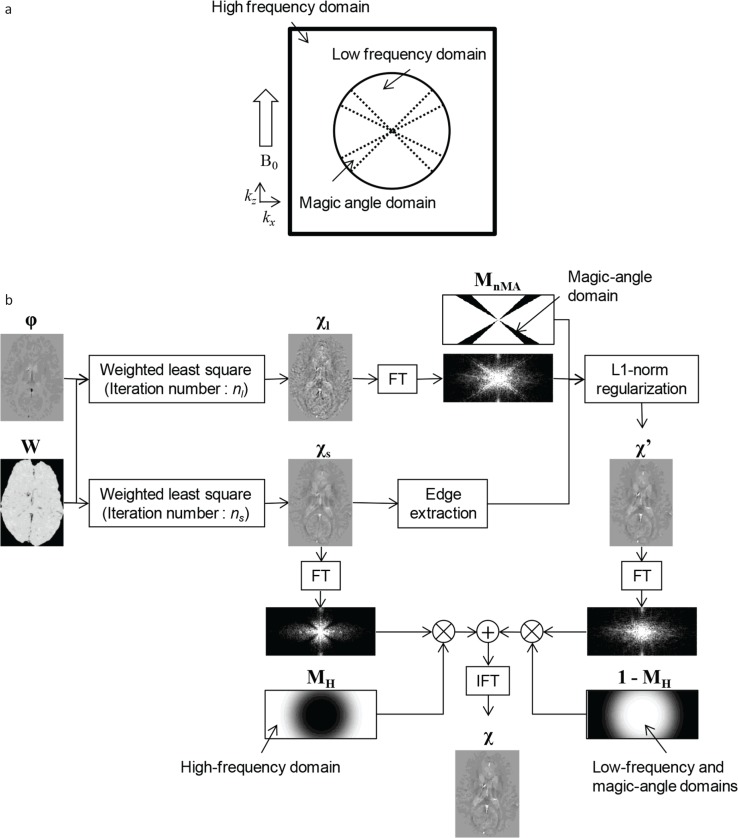
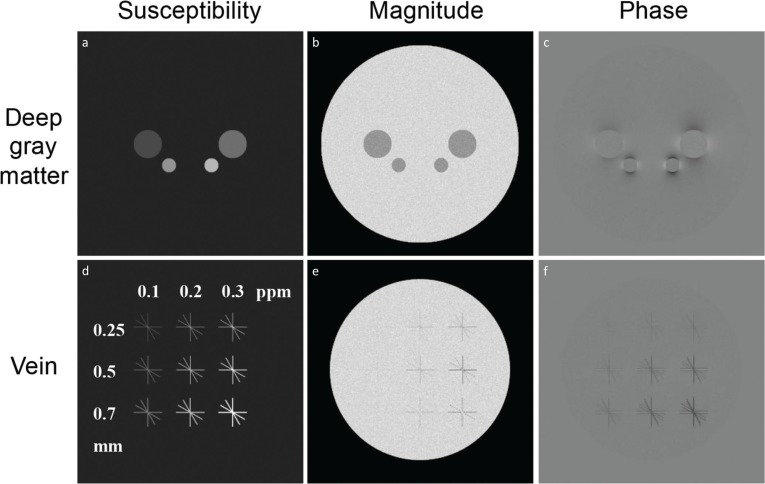
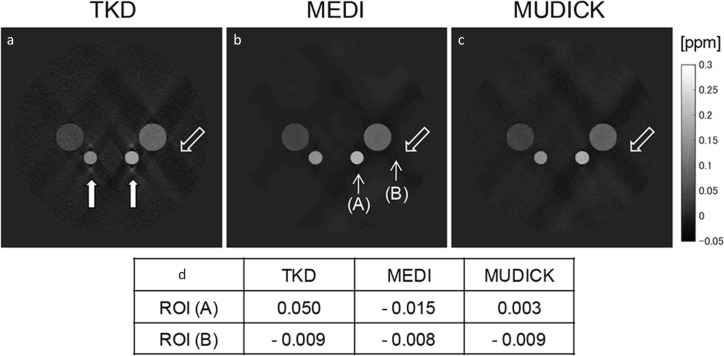
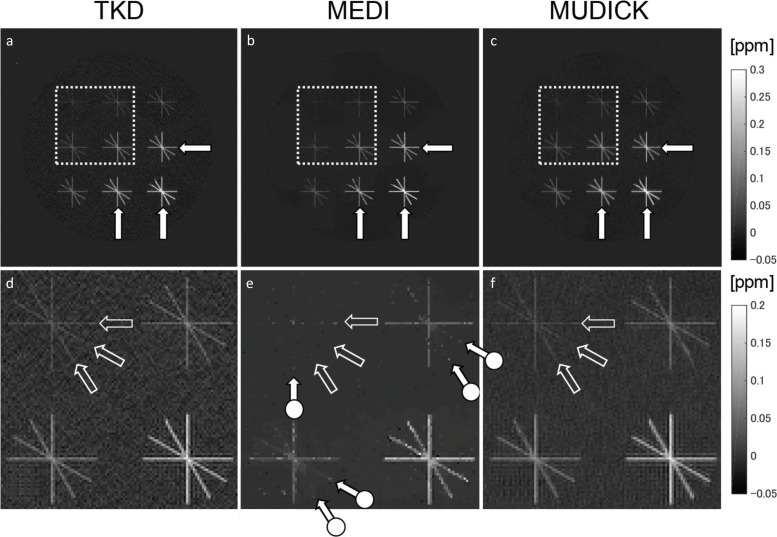
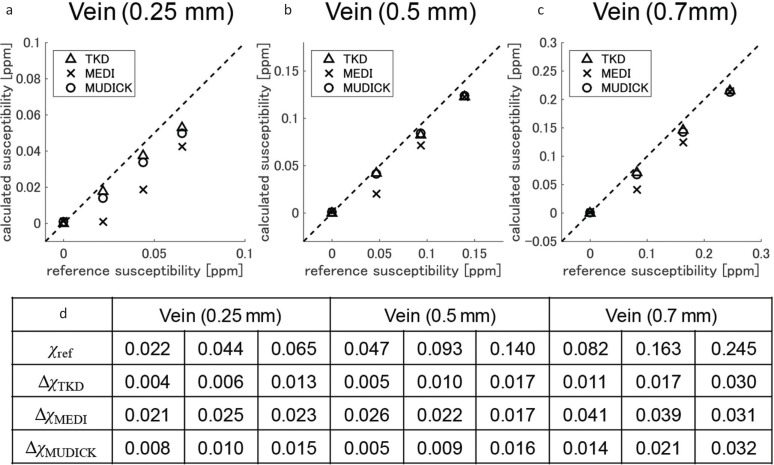
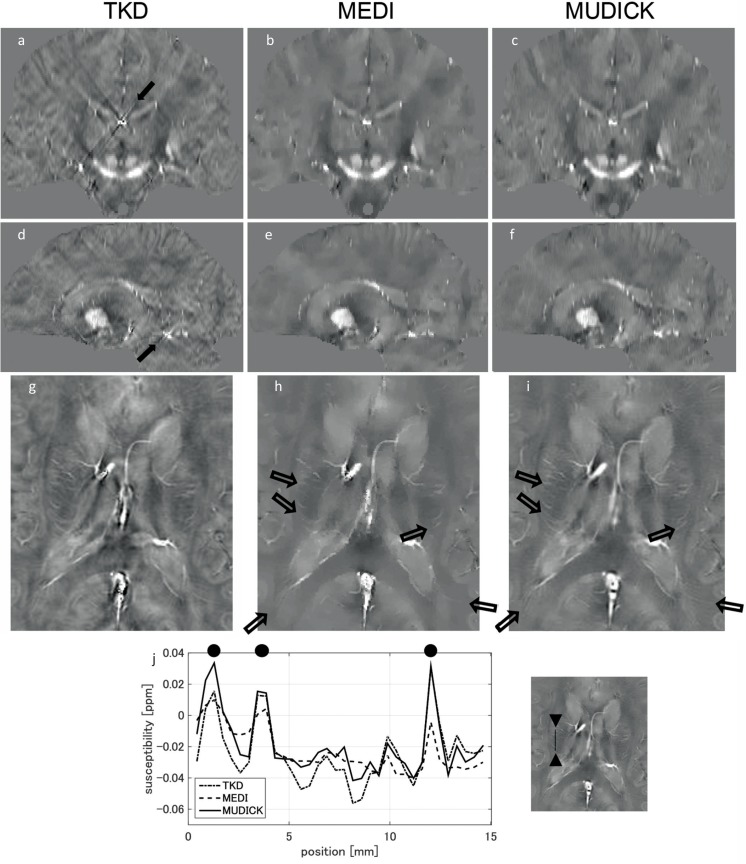
Quantitative susceptibility mapping (QSM) is a new magnetic resonance imaging (MRI) technique for noninvasively estimating the magnetic susceptibility of biological tissue. Several methods for QSM have been proposed. One of these methods can estimate susceptibility with high accuracy in tissues whose contrast is consistent between magnitude images and susceptibility maps, such as deep gray-matter nuclei. However, the susceptibility of small veins is underestimated and not well depicted by using the above approach, because the contrast of small veins is inconsistent between a magnitude image and a susceptibility map. In order to improve the estimation accuracy and visibility of small veins without streaking artifacts, a method with multiple dipole-inversion combination with k-space segmentation (MUDICK) has been proposed. In the proposed method, k-space was divided into three domains (low-frequency, magic-angle, and high-frequency). The k-space data in low-frequency and magic-angle domains were obtained by L1-norm regularization using structural information of a pre-estimated susceptibility map. The k-space data in high-frequency domain were obtained from the pre-estimated susceptibility map in order to preserve small-vein contrasts. Using numerical simulation and human brain study at 3 Tesla, streaking artifacts and small-vein susceptibility were compared between MUDICK and conventional methods (MEDI and TKD). The numerical simulation and human brain study showed that MUDICK and MEDI had no severe streaking artifacts and MUDICK showed higher contrast and accuracy of susceptibility in small-veins compared to MEDI. These results suggest that MUDICK can improve the accuracy and visibility of susceptibility in small-veins without severe streaking artifacts.
Keywords: k-space; quantitative susceptibility mapping; regularization; vein.
Conflict of interest statement
All authors are salaried employees of Hitachi, Ltd.
Figures
Similar articles
-
Quantitative susceptibility map reconstruction using annihilating filter-based low-rank Hankel matrix approach.Magn Reson Med. 2020 Mar;83(3):858-871. doi: 10.1002/mrm.27976. Epub 2019 Aug 29. Magn Reson Med. 2020. PMID: 31468595
-
A method for estimating and removing streaking artifacts in quantitative susceptibility mapping.Neuroimage. 2015 Mar;108:111-22. doi: 10.1016/j.neuroimage.2014.12.043. Epub 2014 Dec 20. Neuroimage. 2015. PMID: 25536496 Free PMC article.
-
Human brain atlas for automated region of interest selection in quantitative susceptibility mapping: application to determine iron content in deep gray matter structures.Neuroimage. 2013 Nov 15;82:449-69. doi: 10.1016/j.neuroimage.2013.05.127. Epub 2013 Jun 12. Neuroimage. 2013. PMID: 23769915 Free PMC article.
-
Quantitative Susceptibility Mapping: Concepts and Applications.Clin Neuroradiol. 2015 Oct;25 Suppl 2:225-30. doi: 10.1007/s00062-015-0432-9. Epub 2015 Jul 22. Clin Neuroradiol. 2015. PMID: 26198880 Review.
-
Quantitative susceptibility mapping: current status and future directions.Magn Reson Imaging. 2015 Jan;33(1):1-25. doi: 10.1016/j.mri.2014.09.004. Epub 2014 Oct 25. Magn Reson Imaging. 2015. PMID: 25267705 Review.
Cited by
-
MR Imaging in the 21st Century: Technical Innovation over the First Two Decades.Magn Reson Med Sci. 2022 Mar 1;21(1):71-82. doi: 10.2463/mrms.rev.2021-0011. Epub 2021 Apr 16. Magn Reson Med Sci. 2022. PMID: 33867419 Free PMC article. Review.
-
Susceptibility difference weighted imaging in vertical-field MRI.Radiol Phys Technol. 2018 Jun;11(2):255-261. doi: 10.1007/s12194-018-0458-1. Epub 2018 Apr 26. Radiol Phys Technol. 2018. PMID: 29700796
-
Acetazolamide-Loaded Dynamic 7T MR Quantitative Susceptibility Mapping in Major Cerebral Artery Steno-Occlusive Disease: Comparison with PET.AJNR Am J Neuroradiol. 2020 May;41(5):785-791. doi: 10.3174/ajnr.A6508. Epub 2020 Apr 16. AJNR Am J Neuroradiol. 2020. PMID: 32299799 Free PMC article.
-
Preoperative Cerebral Oxygen Extraction Fraction Imaging Generated from 7T MR Quantitative Susceptibility Mapping Predicts Development of Cerebral Hyperperfusion following Carotid Endarterectomy.AJNR Am J Neuroradiol. 2017 Dec;38(12):2327-2333. doi: 10.3174/ajnr.A5390. Epub 2017 Oct 5. AJNR Am J Neuroradiol. 2017. PMID: 28982786 Free PMC article.
-
Region Expansion of Background Field Removal with Local Spherical Harmonics Approximation for Whole-brain Quantitative Susceptibility Mapping.Magn Reson Med Sci. 2023 Oct 1;22(4):497-514. doi: 10.2463/mrms.mp.2021-0043. Epub 2022 Nov 12. Magn Reson Med Sci. 2023. PMID: 36372397 Free PMC article.
References
-
- Lotfipour AK, Wharton S, Schwarz ST, et al. High resolution magnetic susceptibility mapping of the substantia nigra in Parkinson’s disease. J Magn Reson Imaging 2012; 35: 48–55. - PubMed
MeSH terms
LinkOut - more resources
Full Text Sources
Other Literature Sources
Medical