. 2017 Jun 21;63(3):247-261.
doi: 10.1262/jrd.2016-168. Epub 2017 Mar 31.

High-resolution profiles of gene expression and DNA methylation highlight mitochondrial modifications during early embryonic development

Affiliations

High-resolution profiles of gene expression and DNA methylation highlight mitochondrial modifications during early embryonic development

Likun Ren et al. J Reprod Dev. .

Abstract

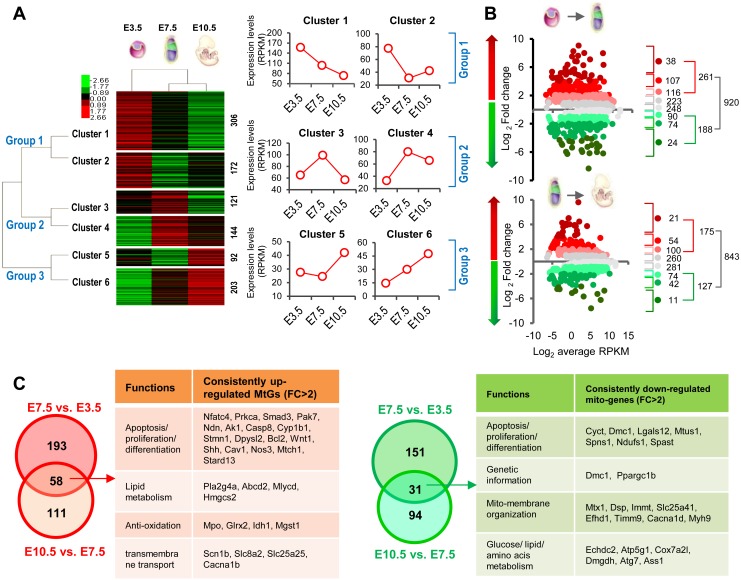
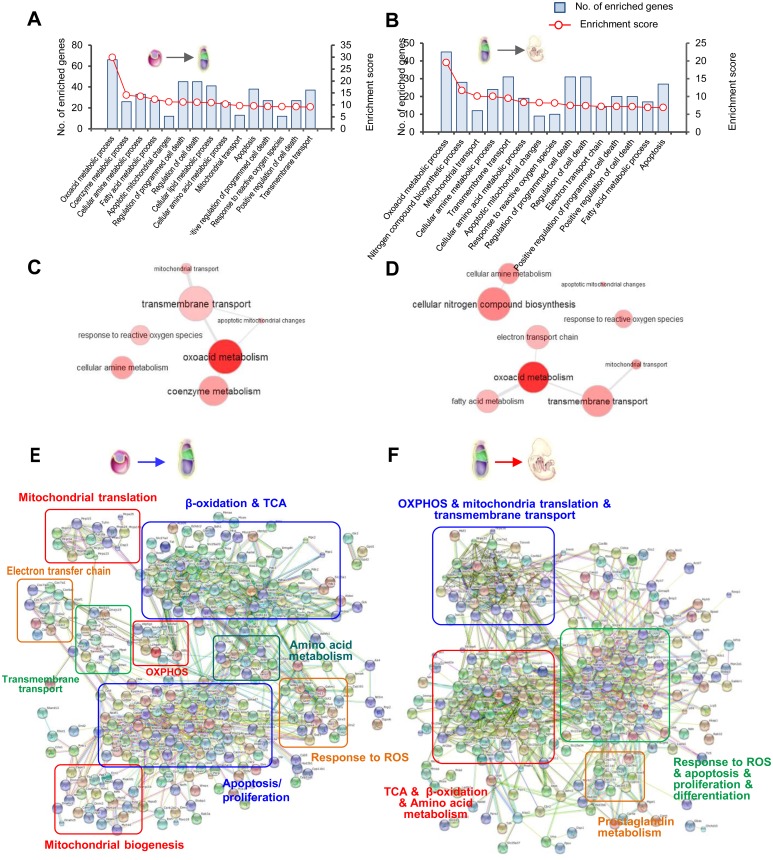
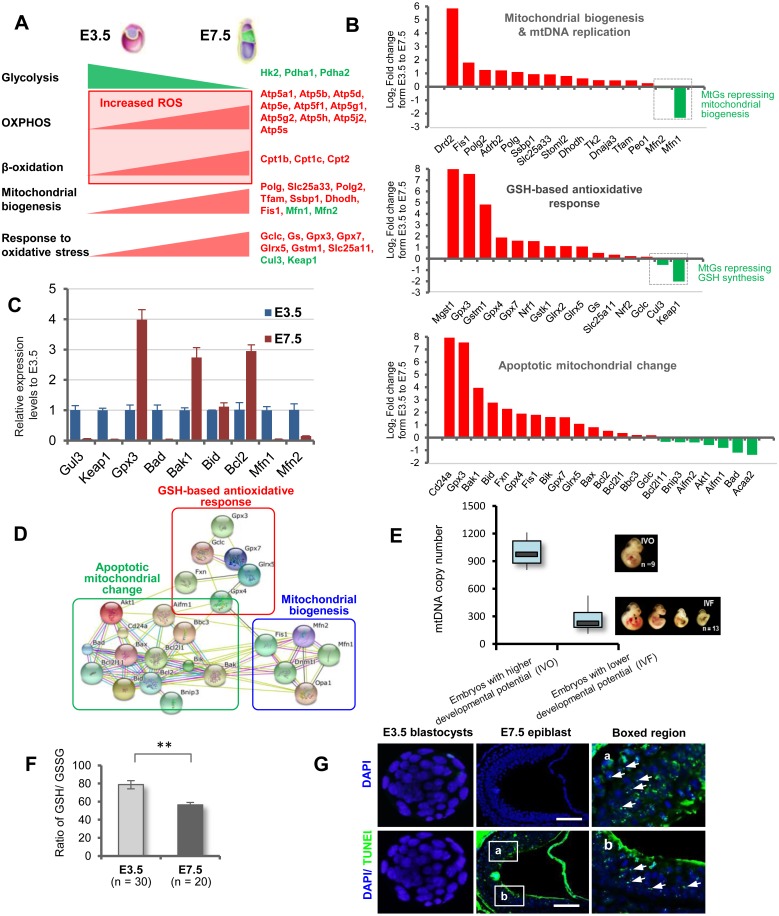
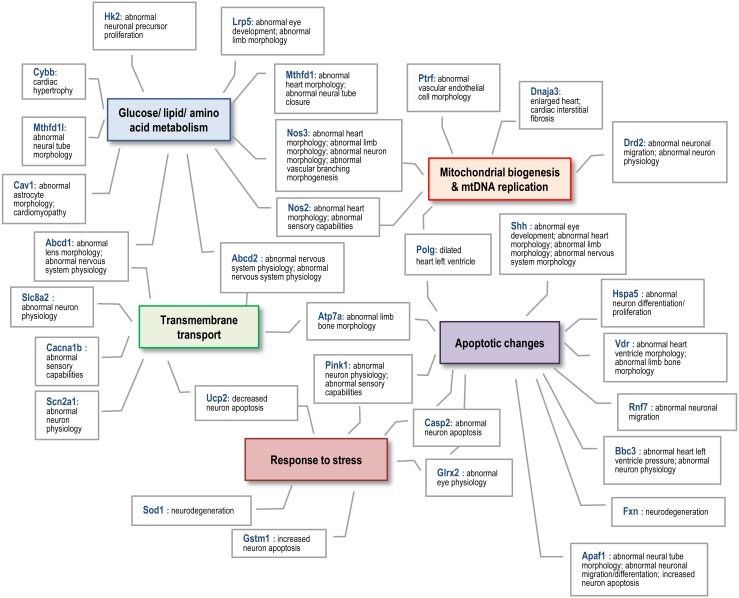
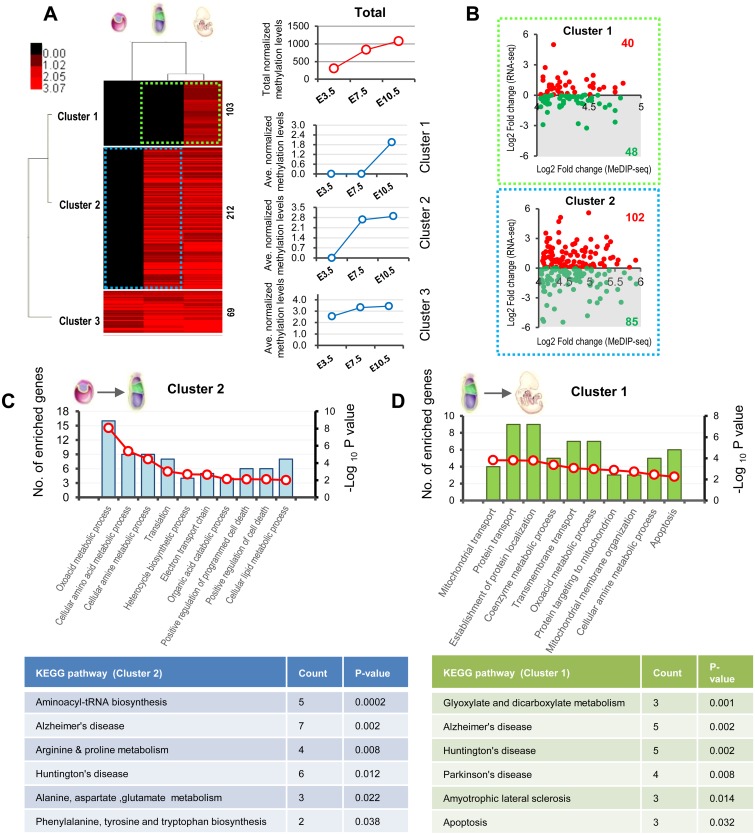
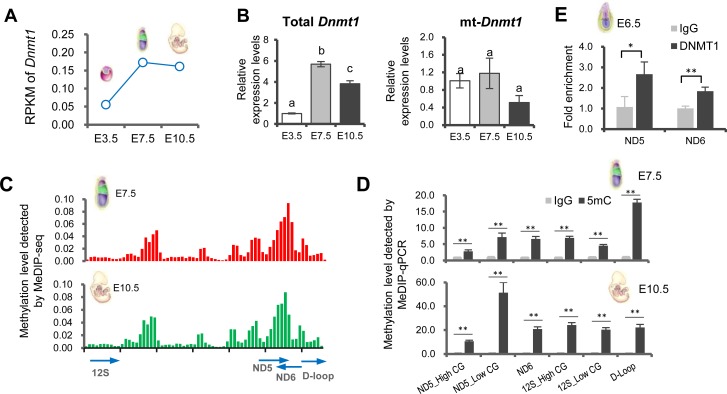
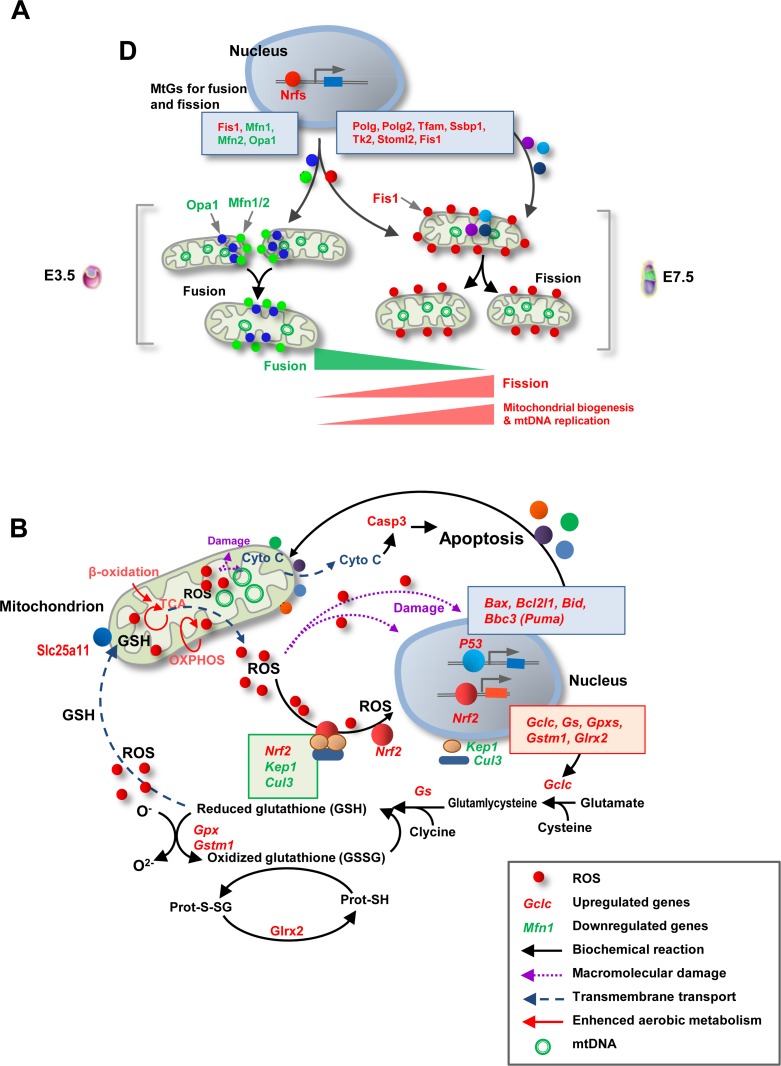
Well-organized mitochondrial functions and dynamics are critical for early embryonic development and are operated via a large number of mitochondria-related genes (MtGs) encoded by both the nuclear and the mitochondrial genome. However, the mechanisms underlying mitochondrial modifications during the critical window between blastocyst implantation and postimplantation organogenesis are poorly understood. Herein, we performed high-resolution dynamic profiling of MtGs to acquire a more detailed understanding of mitochondrial modifications during early development. Our data suggest that the resumption of mitochondrial mass growth is not only facilitated by increased mitochondrial biogenesis and mitochondrial DNA (mtDNA) replication, but also by the appropriate balance between mitochondrial fission and fusion. In addition, increased levels of reactive oxygen species (ROS) resulting from enhanced mitochondrial functions may be the critical inducer for activating the glutathione (GSH)-based stress response system in early embryos. The appropriate balance between the mitochondrial stress response and apoptosis appears to be significant for cell differentiation and early organogenesis. Furthermore, we found that most MtGs undergo de novo promoter methylation, which may have functional consequences on mitochondrial functions and dynamics during early development. We also report that mtDNA methylation can be observed as early as soon after implantation. DNMT1, the predominant enzyme for maintaining DNA methylation, localized to the mitochondria and bound to mtDNA by the implantation stage. Our study provides a new insight into the involvement of mitochondria in early mammalian embryogenesis. We also propose that the epigenetic modifications during early development are significant for modulating mitochondrial functions and dynamics.

Keywords: DNA methylation; Early embryos; Glutathione; Mitochondria; Reactive oxygen species.


Figures

Fig. 1.
Fig. 1.
General dynamic profiling of mitochondria-related genes (MtGs) during early development. (A) Hierarchical clustering analysis based on the dynamic expression levels of MtGs of embryos from pre- to postimplantation. Normalized expression levels (RPKM) are represented by different colors: red indicates high abundance and green indicates low abundance. The number of MtGs in each cluster is presented on the right side. General trends in expression changes are indicated by the average RPKM value of MtGs in each cluster. (B) Fold change (FC) distribution analysis of MtGs between E3.5 blastocysts to E7.5 epiblasts as well as between E7.5 epiblasts and E10.5 embryos. Only MtGs with statistically significant changes in expression were included (P < 0.05). (C) Venn diagrams of upregulated (left panel, red) and downregulated (right panel, green) MtGs for two developmental transitions. Tables show the major functions of MtGs that are consistently upregulated (left) or downregulated (right) during early development.
Fig. 2.
Fig. 2.
General functional profiling of MtGs whose expression significantly changed (P < 0.05, FC > 2) during early development. (A–B) Classification of GO terms based on the functional annotation of biological processes (BPs) enriched in the transition from E3.5 blastocysts to E7.5 epiblasts, as well as from E7.5 epiblasts to E10.5 embryos. The left ordinate represents the number of enriched MtGs corresponding to each term and the right ordinate represents the enrichment score (defined as −Log10 P-value). (C–D) Graph visualization of enriched BPs in A and B based on REVIGO analysis. Bubble color indicates P-value. Functionally associated BPs are linked. (E–F) Interaction networks of MtGs during early development created by a web-based search of the STRING database. Boxed regions represent tightly interconnected functional clusters.
Fig. 3.
Fig. 3.
Mitochondrial modifications during implantation stage. (A) Model illustrating the ‘embryonic shift’ from anaerobic to aerobic metabolism, as well as the resumption of mitochondrial biogenesis and the enhanced response to oxidative stress. Red text indicates upregulated MtGs, while green text indicates downregulated MtGs. (B) Fold changes of representative MtGs involved in essential mitochondrial modifications by the implantation stage. (C) Relative expression levels of some representative MtGs in E3.5 blastocysts and E7.5 epiblasts determined by qRT-PCR. (D) Interaction networks of MtGs responsible for essential mitochondrial modifications taking place during the implantation stage. (E) Boxplot quantitative comparison of mtDNA copy numbers between E10.5 embryos with higher and lower survival rates. (F) Ratios of reduced glutathione (GSH) to oxidized glutathione (GSSG) in E3.5 blastocysts and E7.5 epiblasts; ** P < 0.01. (G) Representative images of apoptosis detected by TUNEL in E3.5 blastocysts and E7.5 epiblasts. Rightmost panels: higher magnification of boxed regions in E7.5 epiblasts. The nuclei of blastomeres were labeled with DAPI. Representative TUNEL-positive apoptotic nuclei are indicated with arrows. Scale bars, 100 μm.
Fig. 4.
Fig. 4.
Schematic diagram of the functional associations among MtGs that are annotated with aberrant organogenesis during the postimplantation stage. Colored boxes indicate mitochondrial modifications that may be essential for embryonic survival and normal organogenesis during the implantation and postimplantation periods.
Fig. 5.
Fig. 5.
Dynamics of promoter DNA methylation of nDNA-encoded MtGs and functional consequences during early development (A) Hierarchical clustering analysis based on dynamic methylation levels of MtGs during the transition from pre- to postimplantation embryos. Normalized methylation levels are represented by different colors: red indicates relatively hypermethylated promoters and black indicates relatively hypomethylated promoters. The numbers of MtGs in each cluster are displayed on the right side of the plot. Graphs next to the plot display promoter methylation levels during early development. The red line (upper graph) indicates total normalized methylation values while blue lines (three lower graphs) correspond to average normalized methylation levels in each cluster. (B) Scatter plots of expression changes versus mean differences of methylation for the MtGs of cluster 1 (upper plot, boxed by green dotted line) and cluster 2 (lower plot, boxed by blue dotted line) whose promoters underwent de novo methylation before E7.5 and E10.5, respectively. Green dots indicate MtGs that are downregulated during the process of promoter de novo methylation, while red dots indicate upregulated MtGs (C–D) Functional profiling of MtGs corresponding to the green dots of the shaded regions of the scatter plots in (B) and may be negatively regulated by promoter de novo methylation taking place between E3.5 and E7.5 or between E7.5 and E10.5.
Fig. 6.
Fig. 6.
MtDNA methylation in postimplantation embryos. (A) Expression dynamics of Dnmt1 during early development as assessed by RNA-seq. (B) Relative expression levels of total Dnmt1 and mt-Dnmt1 during early development as determined by qRT-PCR. (C) MtDNA methylation levels are presented as enriched MeDIP-seq reads (y-axis) on mtDNA positions (x-axis) in E7.5 epiblasts (upper plot) and E10.5 embryos (lower plot). (D) Relative methylation levels at selected regions of mtDNA as detected by MeDIP-qPCR in E7.5 epiblasts (upper plot) and E10.5 embryos (lower plot). (E) Relative enrichment of DNMT1 at selected regions (Nd5 and Nd6) of mtDNA as determined by CHIP-qPCR in E6.5 embryos. Values indicated by different letters are significantly different (P < 0.05). * P < 0.05; ** P < 0.01.
Fig. 7.
Fig. 7.
Schematic diagrams illustrating essential mitochondrial modifications during early development. (A) The resumption of mitochondrial biogenesis by the implantation stage appears to be facilitated not only by increased mitochondrial biogenesis and mtDNA replication but also by the skewed balance between fission and fusion. (B) Enhanced aerobic metabolism by the implantation stage, especially OXPHOS, leads to increased ROS production, which appears be the inducer of GSH biosynthesis. The apoptotic and survival signals in early embryos may be balanced by the GSH-based stress response.

References

    1. Harvey A, Gibson T, Lonergan T, Brenner C. Dynamic regulation of mitochondrial function in preimplantation embryos and embryonic stem cells. Mitochondrion 2011; 11: 829–838. - PubMed
    1. Ramalho-Santos J, Varum S, Amaral S, Mota PC, Sousa AP, Amaral A. Mitochondrial functionality in reproduction: from gonads and gametes to embryos and embryonic stem cells. Hum Reprod Update 2009; 15: 553–572. - PubMed
    1. Mootha VK, Bunkenborg J, Olsen JV, Hjerrild M, Wisniewski JR, Stahl E, Bolouri MS, Ray HN, Sihag S, Kamal M, Patterson N, Lander ES, Mann M. Integrated analysis of protein composition, tissue diversity, and gene regulation in mouse mitochondria. Cell 2003; 115: 629–640. - PubMed
    1. Jian B, Yang S, Chen D, Zou L, Chatham JC, Chaudry I, Raju R. Aging influences cardiac mitochondrial gene expression and cardiovascular function following hemorrhage injury. Mol Med 2011; 17: 542–549. - PMC - PubMed
    1. Hsiao CP, Wang D, Kaushal A, Saligan L. Mitochondria-related gene expression changes are associated with fatigue in patients with nonmetastatic prostate cancer receiving external beam radiation therapy. Cancer Nurs 2013; 36: 189–197. - PMC - PubMed