. 2017 Apr 3:8:14727.
doi: 10.1038/ncomms14727.

Dopamine neuronal loss contributes to memory and reward dysfunction in a model of Alzheimer's disease

Affiliations

Dopamine neuronal loss contributes to memory and reward dysfunction in a model of Alzheimer's disease

Annalisa Nobili et al. Nat Commun. .

Abstract

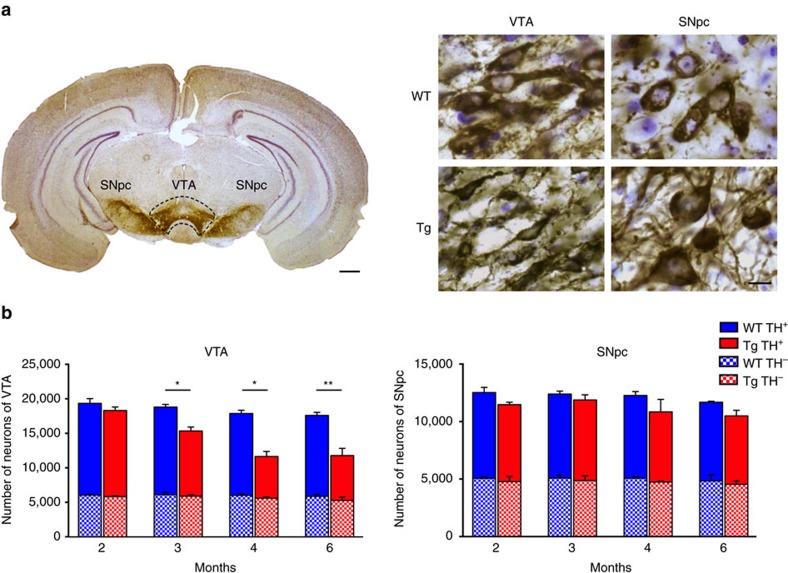
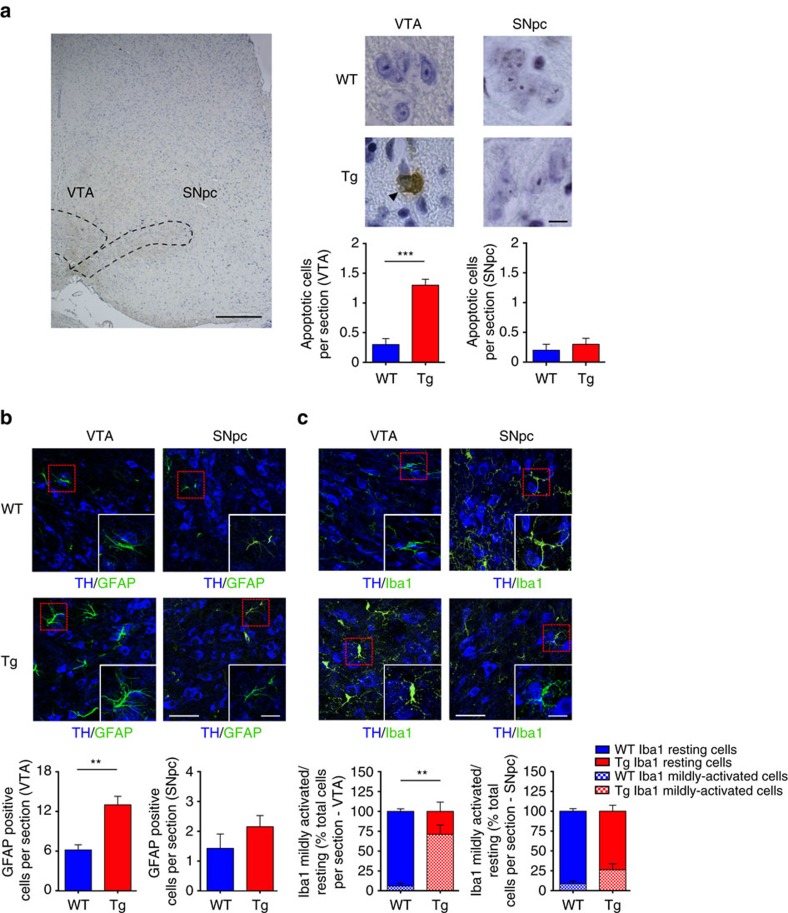
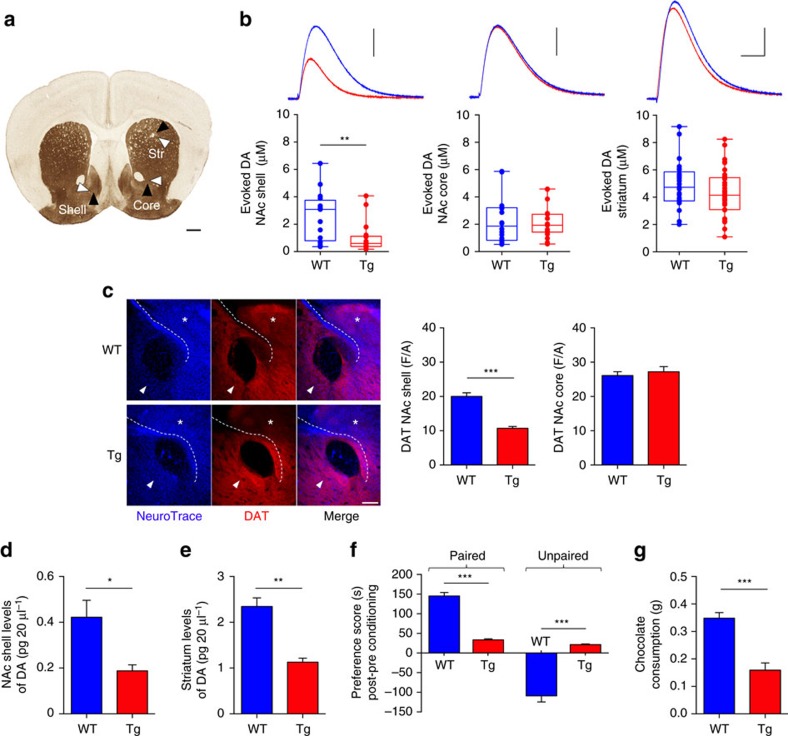
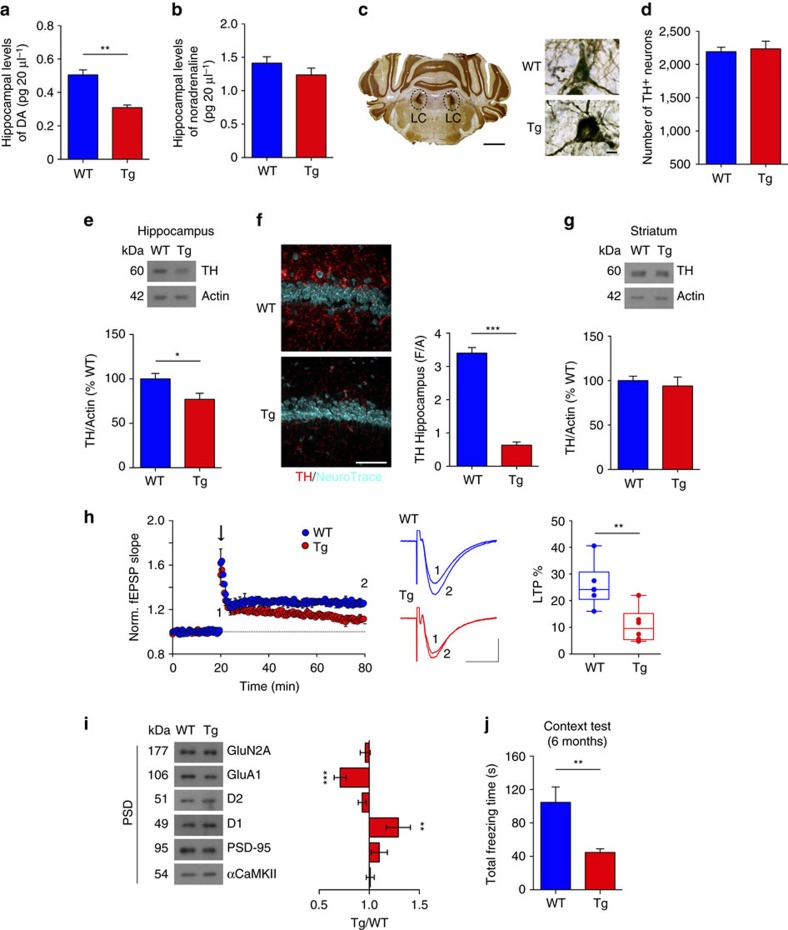
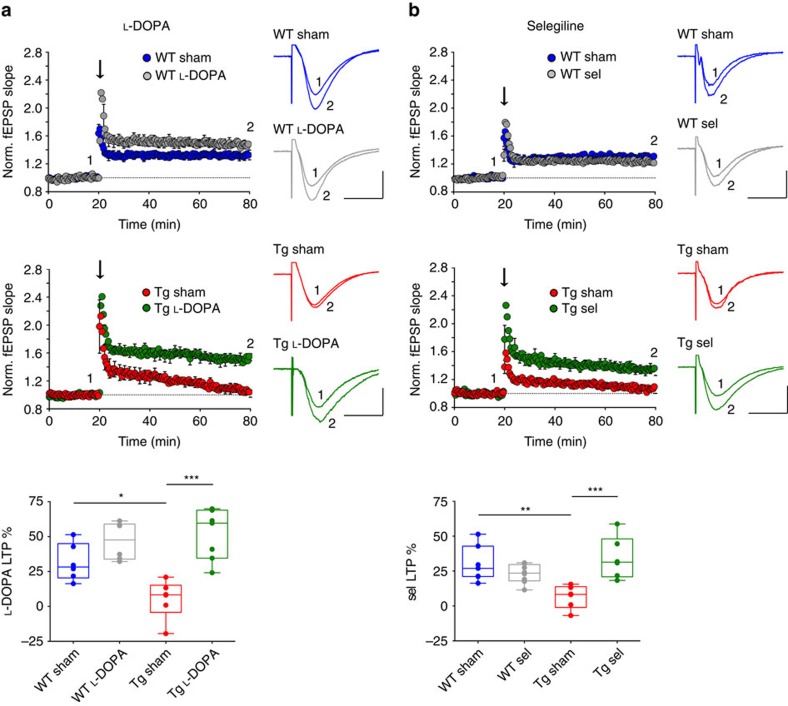
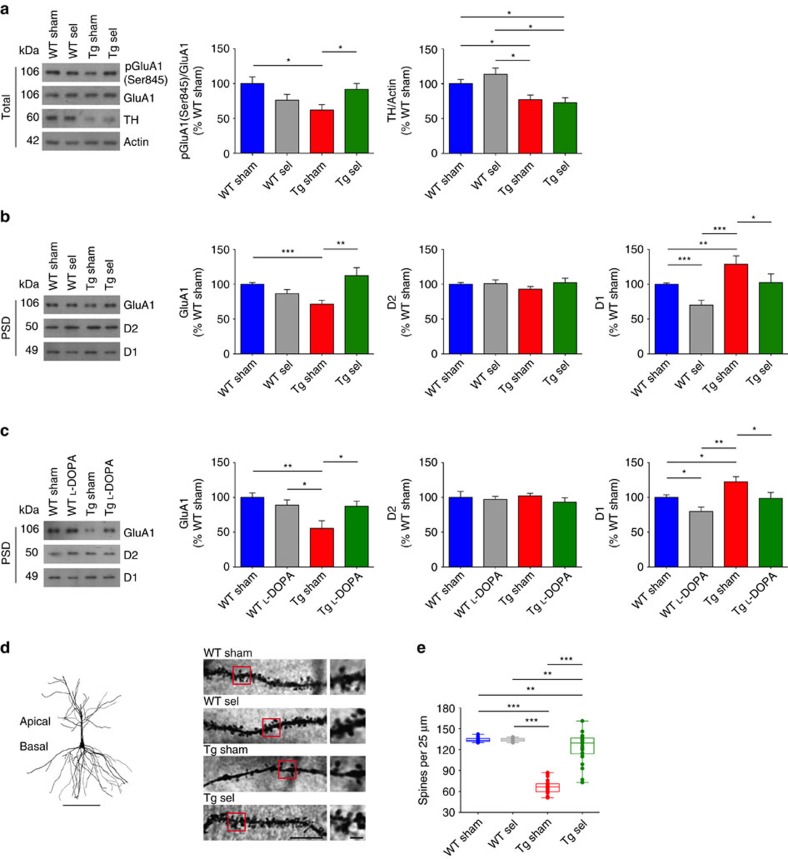
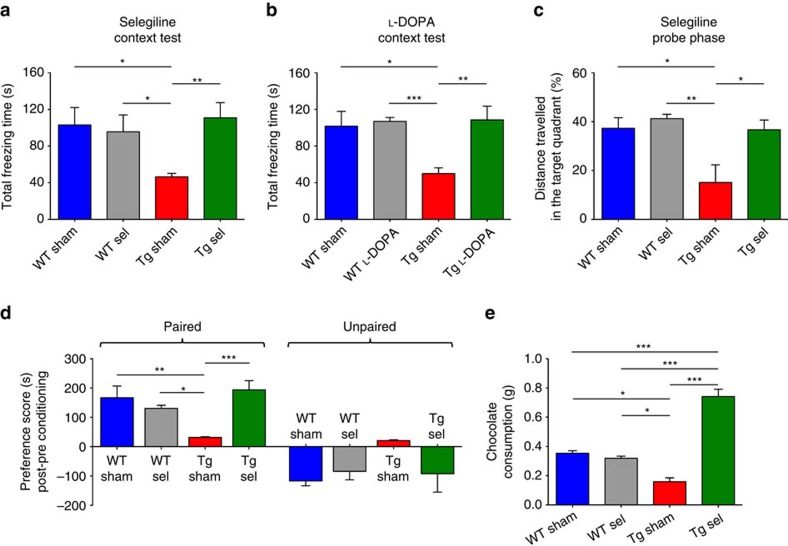
Alterations of the dopaminergic (DAergic) system are frequently reported in Alzheimer's disease (AD) patients and are commonly linked to cognitive and non-cognitive symptoms. However, the cause of DAergic system dysfunction in AD remains to be elucidated. We investigated alterations of the midbrain DAergic system in the Tg2576 mouse model of AD, overexpressing a mutated human amyloid precursor protein (APPswe). Here, we found an age-dependent DAergic neuron loss in the ventral tegmental area (VTA) at pre-plaque stages, although substantia nigra pars compacta (SNpc) DAergic neurons were intact. The selective VTA DAergic neuron degeneration results in lower DA outflow in the hippocampus and nucleus accumbens (NAc) shell. The progression of DAergic cell death correlates with impairments in CA1 synaptic plasticity, memory performance and food reward processing. We conclude that in this mouse model of AD, degeneration of VTA DAergic neurons at pre-plaque stages contributes to memory deficits and dysfunction of reward processing.


Conflict of interest statement

The authors declare no competing financial interests.

Figures

Figure 1
Figure 1. Tg2576 mice show selective loss of VTA DAergic neurons starting at 3 months of age.
(a) Coronal brain section from a 6-month-old WT mouse showing intense TH immunoreactivity (brown) in the VTA and SNpc. Sections were Nissl-counterstained (light blue). The dashed line indicates the anatomical boundaries separating the VTA from the SNpc (scale bar, 500 μm). On the right are higher magnification images (scale bar, 10 μm) showing TH+ and Nissl-counterstained neurons in the VTA and SNpc of WT and Tg2576 (Tg) mice (n=7 mice per genotype; 9 sections per animal). (b) The bar graphs show stereological quantification of TH+ and TH cell numbers in the VTA and SNpc in WT and Tg2576 mice at the indicated ages (n=7 mice per genotype per age; 9 sections per animal). DAergic neuronal loss in Tg2576 mice is selective for the VTA with the onset at 3 months of age (two-tailed unpaired t-test: 3 and 4 months, *P=0.003; 6 months, **P=0.002). Data represent mean±s.e.m.
Figure 2
Figure 2. VTA DAergic neuronal death in Tg2576 mice at pre-plaque stage is associated with apoptosis and glia inflammation.
(a) Coronal brain hemi-section delineating VTA and SNpc areas (dashed lines; scale bar, 250 μm) and representative photomicrographs of TUNEL-positive neurons from 3-month-old WT and Tg2576 mice (scale bar, 10 μm). The intense dark-brown staining indicates apoptotic cells (arrowhead). Sections were Nissl-counterstained (light blue). The bar graphs represent the average number of TUNEL-positive apoptotic neurons per section in the analysed areas (n=7 mice per genotype, 9 sections per animal; two-tailed unpaired t-test ***P<1.00 × 10⁻⁴). (b) Analysis of confocal Z-stack double-labelling of TH- and GFAP- immunostaining in brain sections containing the VTA and SNpc from 3-month-old mice (scale bar, 50 μm). Insets show individual GFAP-positive cells at higher magnification (scale bar, 20 μm). The bar plots represent the mean number of GFAP-positive cells per section in the indicated areas (n=7 mice per genotype, 9 sections per animal; two-tailed unpaired t-test **P=0.002). (c) Double-labelling for TH and Iba1 in brain sections containing the VTA and SNpc from 3-month-old mice (scale bar, 50 μm). The insets show examples of resting microglia in WT mice and in the SNpc of Tg2576 mice, characterized by round cell bodies and long processes, and a mildly activated cell in the VTA of Tg2576 mice with more intense fluorescence, enlarged cell body and retracted processes (scale bar, 20 μm). Note also the increased proliferation of Iba1-positive cells in the Tg2576 VTA. The bar plots represent the mean number of Iba1-positive resting and mildly activated cells shown as percentage of the total number of Iba1-positive cells per section (n=4 mice per genotype, 9 sections per animal; for the ratio of resting/mildly activated cells: two-tailed unpaired t-test **P=0.003). Data are mean±s.e.m.
Figure 3
Figure 3. Reduced DA outflow in the NAc shell and deficits in mesolimbic reward processing in 6-month-old Tg2576 mice.
(a) Summary of stimulating (black arrowheads) and recording electrode (white arrowheads) placements during amperometric measurements of evoked DA in the NAc (Shell, Core) and striatum (Str; scale bar, 500 μm). (b) Evoked DA concentration in the indicated areas (n=16–25 slices from 6–8 WT mice, 18–43 slices from 6–10 Tg2576 mice) and example traces from 6-month-old WT and Tg2576 mice (vertical scale bars: NAc shell and core, 50 pA; striatum, 100 pA; horizontal scale bar, 250 ms) recorded with a carbon fibre electrode of equal calibration (two-tailed unpaired t-test **P=0.004). In this and other figures, in box-and-whisker plots the centre lines denote medians, edges represent upper and lower quartiles and whiskers show minimum and maximum values. Points are individual experiments. (c) Z-stack double immunofluorescent labelling for NeuroTrace and DAT in NAc coronal sections showing the NAc shell (asterisk) and core (arrowhead; scale bar, 200 μm). Bar plots show densitometric values of DAT levels in 6-month-old mice (n=3 per genotype, 4 sections per animal; two-tailed unpaired t-test ***P=1.00 × 10⁻⁷). (d,e) Microdialysis measurements of DA outflow in the NAc shell (d) and dorsal striatum (e) in 6-month-old mice (d: n=6 WT and 5 Tg2576; one-way ANOVA: F1,9=5.138, *P=0.049; e: n=4 WT and 5 Tg2576; one-way ANOVA: F1,7=13.067, **P=0.009). (f) Chocolate-induced place preference in 6-month-old mice (n=5 mice per genotype) showing average time spent in paired and unpaired chambers in post-conditioning session, minus the time spent in the same chambers during the pre-conditioning session of a CPP test (two-way repeated measures ANOVA: chamber, F1,8=280.76, P<1.00 × 10⁻⁴; chamber × genotype, F1,8=231.34, P<1.00 × 10⁻⁴; genotype, F1,8=0.84, P=0.380; ***P<1.00 × 10⁻⁴ with Tukey's post hoc test). (g) Chocolate consumption during CPP conditioning sessions (n=5 mice per genotype; two-tailed unpaired t-test ***P<1.00 × 10⁻⁴). Data in cg represent mean±s.e.m.
Figure 4
Figure 4. Six-month-old Tg2576 mice show reduced DA outflow in the hippocampus and synaptic plasticity and memory deficits.
(a,b) In vivo microdialysis for DA (a) and noradrenaline (b) in the hippocampus of 6-month-old WT (n=6) and Tg2576 (n=5) mice (a: F1,9=5.138, **P=0.009; (b): F1,9=0.688, P=0.428, one-way ANOVA). (c) TH immunoreactivity (brown) in the LC (scale bar, 500 μm) of a 6-month-old WT mouse and images of TH+ neurons in WT and Tg2576 mice (scale bar, 10 μm). (d) Quantification of LC TH+ neurons in 6-month-old mice (n=6 per genotype; 9 sections per animal). (e) Immunoblots of total hippocampal TH protein from 6-month-old mice (n=6 per genotype) and densitometric quantification of changes in grey values (two-tailed unpaired t-test *P=0.037). (f) TH/NeuroTrace double-labelling in CA1 sections (scale bar, 50 μm) and TH densitometric levels in 6-month-old mice (n=3 per genotype, 4 sections per animal; two-tailed unpaired t-test ***P=5.00 × 10⁻⁵). (g) As in e showing total TH protein from the dorsal striatum (n=6 mice per genotype). (h) Normalized CA3-to-CA1 fEPSP mean slope (±s.e.m. every 2 min) recorded from the CA1 dendritic region in slices from 6-month-old mice. A high frequency conditioning train was delivered (arrow) following a 20 min baseline. Traces (scale bars, 100 μV, 10 ms) are fEPSPs recorded during baseline (1) and 1 h after the train (2). The plot indicates the degree of potentiation at 55–60 min after the train (WT: n=6 slices from 4 mice; Tg2576: n=6 slices from 5 mice; two-tailed unpaired t-test **P=0.006). (i) Immunoblots of hippocampal PSD proteins from 6-month-old mice (n=8 per genotype), probed with the indicated antibodies, and densitometric quantification of changes in grey values expressed as mean ratio of Tg/WT (two-tailed unpaired t-test: D1, **P=0.002; GluA1, ***P=0.001). (j) Total freezing time during the CFC context test (6 mice per genotype; two-tailed unpaired t-test **P=0.009). Except from the box-and-whisker plot in h, values represent mean±s.e.m.
Figure 5
Figure 5. Sub-chronic L-DOPA or selegiline treatment rescues CA3-to-CA1 plasticity deficits in 6-month-old Tg2576 mice.
(a,b) Running plots show normalized fEPSP mean slope (±s.e.m. displayed every 2 min) recorded from the dendritic region of CA1 neurons in hippocampal slices from 6-month-old saline-treated (sham) and L-DOPA- (a) or selegiline (sel)-treated (b) WT and Tg2576 mice. The arrows indicate when a high frequency train was delivered by stimulating the Schaffer collateral pathway in the CA3 region. Traces are superimposed fEPSPs recorded during baseline (1) and 1 h after the train (2). The box-and-whisker plots below indicate the degree of potentiation, measured as fEPSP slope increase from baseline, 55–60 min after the train (a, WT: n=6 slices from 3 sham, 6 slices from 4 L-DOPA-treated mice; Tg: n=6 slices from 3 sham, 7 slices from 3 L-DOPA-treated mice; two-way ANOVA: genotype × treatment, F1,21=6.51, P=0.019; genotype, F1,21=3.22, P=0.087; treatment, F1,21=26.09, P<1.00 × 10⁻⁴; WT sham-Tg sham *P<0.050, Tg sham-Tg L-DOPA ***P<0.001 with Bonferroni's post hoc test. (b) WT: n=7 slices from 3 sham mice, 8 slices from 4 sel-treated mice; Tg2576: n=6 slices from 3 sham, 6 slices from 4 sel-treated mice; two-way ANOVA: genotype × treatment, F1,23=16.61, P=5.00 × 10⁻⁴; genotype, F1,23=2.00, P=0.171; treatment, F1,23=5.99, P=0.022; WT sham-Tg sham **P<0.010, Tg sham-Tg sel ***P<0.001 with Bonferroni's post hoc test. Both L-DOPA and selegiline increase LTP in Tg2576 mice while having no effect on WT animals (scale bars for traces: 100 μV, 10 ms).
Figure 6
Figure 6. Sub-chronic selegiline or L-DOPA treatment rescues hippocampal PSD composition and dendritic spine density in Tg2576 mice.
(ac) Representative immunoblots of total (a) and PSD (b) hippocampal proteins from 6-month-old WT and Tg2576 mice treated with selegiline (sel) or saline (sham) and PSD proteins (c) prepared from L-DOPA or saline-treated mice, probed with the indicated antibodies, and densitometric quantification of changes in grey values. For total proteins actin was used as loading control. Selegiline does not rescue TH protein levels but selegiline and L-DOPA restore PSD composition in Tg2576 mice (a: 8 mice per group; two-tailed unpaired t-test for pGluA1/GluA1: WT sham-Tg sham *P=0.012, Tg sham-Tg sel *P=0.027; for TH/actin: WT sham-Tg sham *P=0.029, WT sham-Tg sel *P=0.022, WT sel-Tg sham *P=0.017, WT sel-Tg sel *P=0.015; (b) 10 mice per group; two-tailed unpaired t-test for GluA1: WT sham-Tg sham ***P=8.00 × 10⁻⁴, Tg sham-Tg sel **P=0.010; for D1: WT sham-WT sel ***P=2.00 × 10⁻⁴, WT sham-Tg sham **P=0.009, WT sel-Tg sham ***P=3.00 × 10⁻⁴, Tg sham-Tg sel *P=0.028; (c) 8 mice per group; two-tailed unpaired t-test for GluA1: WT sham-Tg sham **P=0.008, WT L-DOPA-Tg sham *P=0.031, Tg sham-Tg L-DOPA *P=0.032; for D1: WT sham-WT L-DOPA *P=0.020, WT sham-Tg sham *P=0.028, WT L-DOPA-Tg sham **P=0.002, Tg sham-Tg L-DOPA *P=0.039). (d) Reconstruction of a WT sham Golgi-stained CA1 pyramidal neuron (scale bar, 100 μm) and representative segments of apical dendrites from 6-month-old sel- and sham-treated mice (scale bar, 10 μm). Insets show high-magnification micrographs (scale bar, 2 μm). (e) Spine density (mean spine number per 25 μm dendrite segment) is increased in Tg2576 animals after selegiline treatment (d,e: n=3 mice per group, 10 pyramidal neurons per mouse; two-tailed unpaired t-test: WT sham-Tg sham ***P<1.00 × 10⁻⁴, WT sham-Tg sel **P=0.010, WT sel-Tg sham ***P<1.00 × 10⁻⁴, WT sel-Tg sel **P=0.010, Tg sham-Tg sel ***P<1.00 × 10⁻⁴). Data represent mean±s.e.m.
Figure 7
Figure 7. Sub-chronic selegiline or L-DOPA treatment rescues memory performance and reward processing in Tg2576 mice.
(a,b) Total freezing time during the CFC context test in 6-month-old sham- and sel-treated mice (a; 6 mice per group) and in sham- and L-DOPA-treated mice (b; 5 mice per group). Both drugs restore contextual fear memory in Tg2576 mice (a: two-tailed unpaired t-test: WT sham-Tg sham *P=0.015, WT sel-Tg sham *P=0.025, Tg sham-Tg sel **P=0.004; (b): two-tailed unpaired t-test: WT sham-Tg sham *P=0.018, WT L-DOPA-Tg sham ***P=1.30 × 10⁻⁴, Tg sham-Tg L-DOPA **P=0.007). (c) Percentage of distance travelled in the target quadrant (previously containing the platform) during the Probe phase of the MWM test for 6-month-old sham- and sel-treated mice (n=5 mice per group). Tg sham mice swam less in the target quadrant in comparison to the remaining groups, while selegiline was able to restore spatial memory performance (two-tailed unpaired t-test: WT sham-Tg sham *P=0.030, WT sel-Tg sham **P=0.008, Tg sham-Tg sel *P=0.031). (d) Chocolate-induced place preference in 6-month-old sham- and sel-treated mice (n=4 WT sham, 4 WT sel, 4 Tg sham and 6 Tg sel mice) showing mean time spent in paired and unpaired chambers in post-conditioning session, minus the time spent in the same chambers during the pre-conditioning session of a CPP test (two-way repeated measures ANOVA: chamber, F1,14=36.97, P<1.00 × 10⁻⁴; chamber × treatment, F3,14=231.34, P<0.050; treatment, F3,14=0.50, P=0.680; WT sham-Tg sham **P<0.010, WT sel-Tg sham *P<0.050, Tg sham-Tg sel ***P<0.001 with Tukey's post hoc test). (e) Chocolate consumption during conditioning sessions of the CPP test shown in d (one-way ANOVA: F3,14=37.10, P<1.00 × 10⁻⁴; WT sham-Tg sham *P<0.050, WT sham-Tg sel ***P<0.001, WT sel-Tg sham *P<0.050, WT sel-Tg sel ***P<0.001, Tg sham-Tg sel ***P<0.001 with Tukey's post hoc test). All data represent mean±s.e.m.

Similar articles

Cited by

References

    1. Nelson P. T. et al.. Correlation of Alzheimer disease neuropathologic changes with cognitive status: a review of the literature. J. Neuropathol. Exp. Neurol. 71, 362–381 (2012). - PMC - PubMed
    1. Scheltens P. et al.. Alzheimer's disease. Lancet 388, 505–517 (2016). - PubMed
    1. D'Amelio M. & Rossini P. M. Brain excitability and connectivity of neuronal assemblies in Alzheimer's disease: from animal models to human findings. Prog. Neurobiol. 99, 42–60 (2012). - PubMed
    1. Roy D. S. et al.. Memory retrieval by activating engram cells in mouse models of early Alzheimer's disease. Nature 531, 508–512 (2016). - PMC - PubMed
    1. Scheff S. W., Price D. A., Schmitt F. A. & Mufson E. J. Hippocampal synaptic loss in early Alzheimer's disease and mild cognitive impairment. Neurobiol. Aging 27, 1372–1384 (2006). - PubMed

Publication types

MeSH terms