

Tight cohesion between glycolipid membranes results from balanced water-headgroup interactions
- PMID: 28367975
- PMCID: PMC5382269
- DOI: 10.1038/ncomms14899
Tight cohesion between glycolipid membranes results from balanced water-headgroup interactions
Abstract
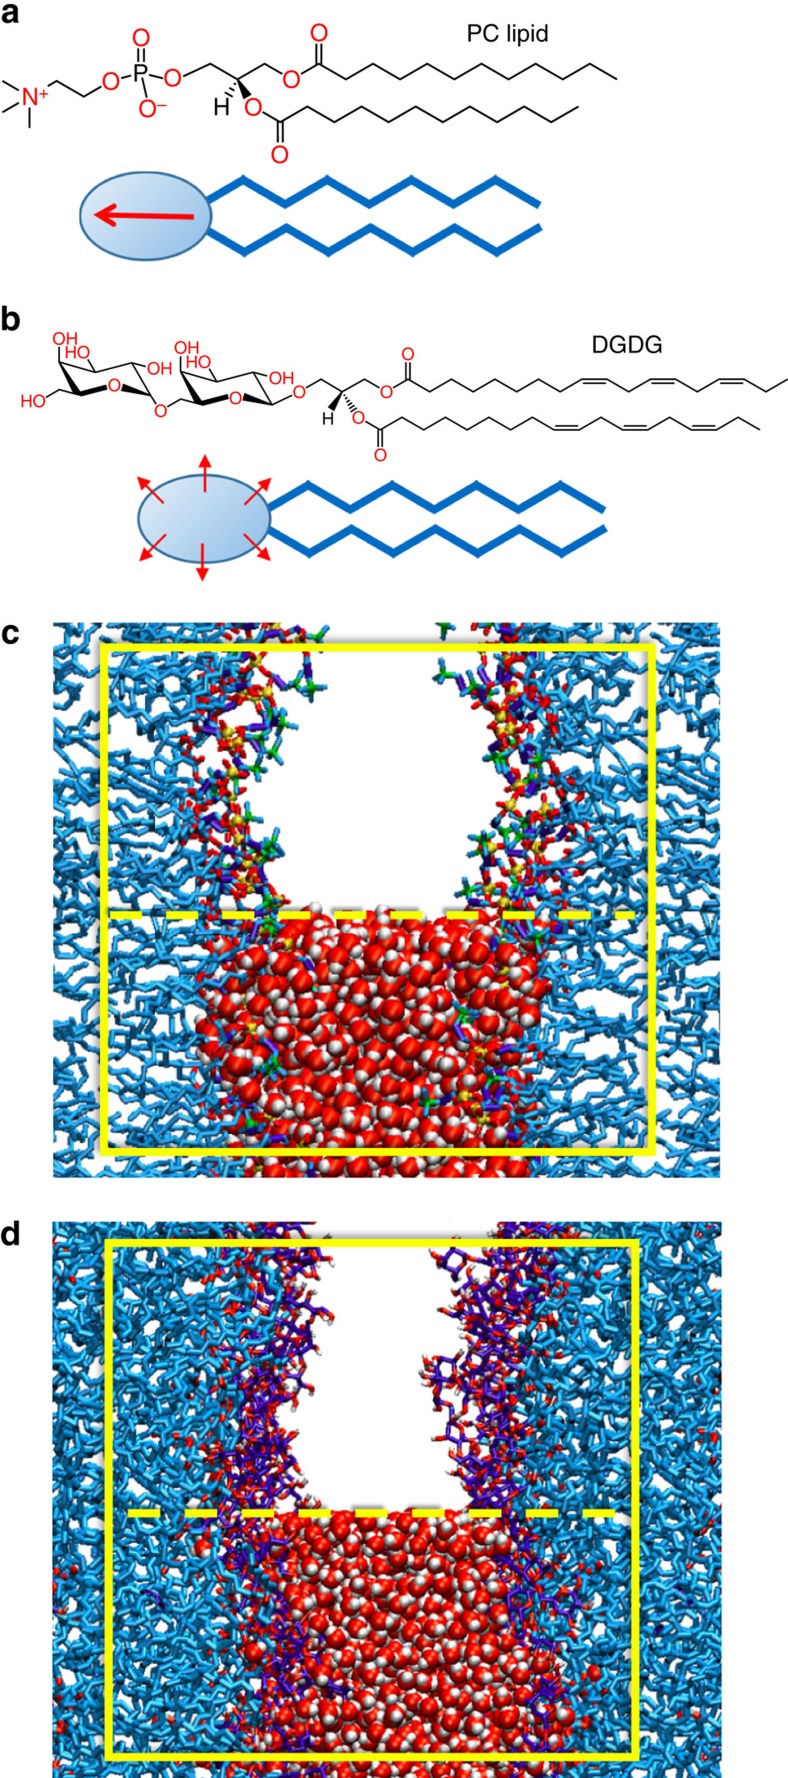
Membrane systems that naturally occur as densely packed membrane stacks contain high amounts of glycolipids whose saccharide headgroups display multiple small electric dipoles in the form of hydroxyl groups. Experimentally, the hydration repulsion between glycolipid membranes is of much shorter range than that between zwitterionic phospholipids whose headgroups are dominated by a single large dipole. Using solvent-explicit molecular dynamics simulations, here we reproduce the experimentally observed, different pressure-versus-distance curves of phospholipid and glycolipid membrane stacks and show that the water uptake into the latter is solely driven by the hydrogen bond balance involved in non-ideal water/sugar mixing. Water structuring effects and lipid configurational perturbations, responsible for the longer-range repulsion between phospholipid membranes, are inoperative for the glycolipids. Our results explain the tight cohesion between glycolipid membranes at their swelling limit, which we here determine by neutron diffraction, and their unique interaction characteristics, which are essential for the biogenesis of photosynthetic membranes.
Conflict of interest statement
The authors declare no competing financial interests.
Figures
 −
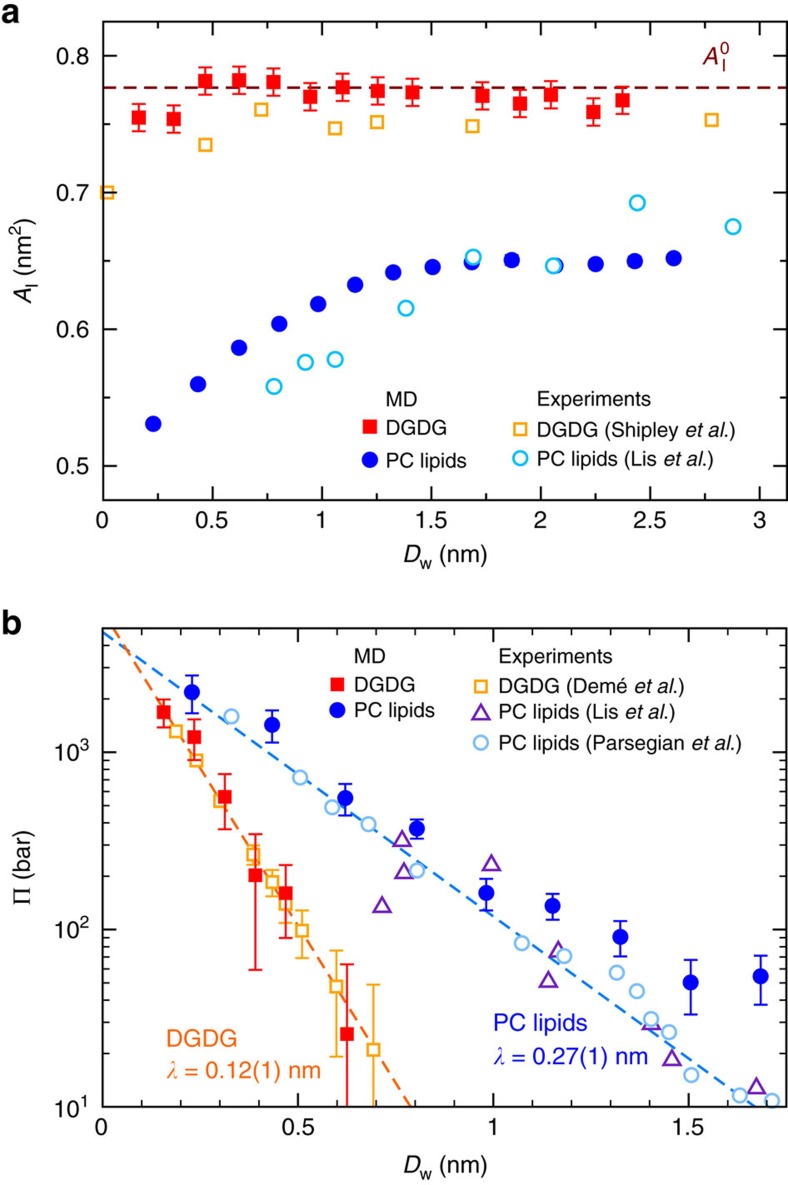
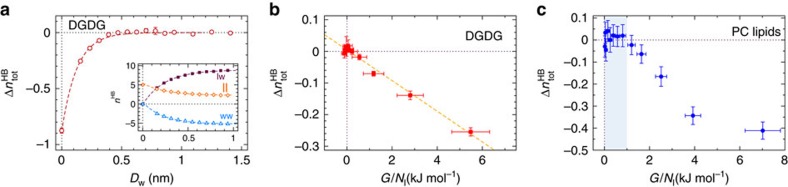
− , see main text. Dashed lines indicate exponential fits with the same decay length λ=0.26±0.01 nm for all three curves. (b) The total number of HBs versus the interaction free energy for DGDG. Dashed line: Linear regression through all data points. (c) The same plot for PC lipids. Shaded region: High hydration limit where
  ≈0. The error bars in all three panels represent 1 s.d. of uncertainty.
Similar articles
-
Effects of cholesterol on dry bilayers: interactions between phosphatidylcholine unsaturation and glycolipid or free sugar.Biophys J. 2007 Aug 15;93(4):1204-14. doi: 10.1529/biophysj.107.108886. Epub 2007 May 25. Biophys J. 2007. PMID: 17526577 Free PMC article.
-
Glycolipid membranes through atomistic simulations: effect of glucose and galactose head groups on lipid bilayer properties.J Phys Chem B. 2007 Aug 30;111(34):10146-54. doi: 10.1021/jp0730895. Epub 2007 Aug 3. J Phys Chem B. 2007. PMID: 17676793
-
Intermolecular interactions in dry and rehydrated pure and mixed bilayers of phosphatidylcholine and digalactosyldiacylglycerol: a Fourier transform infrared spectroscopy study.Biophys J. 2003 Sep;85(3):1682-90. doi: 10.1016/S0006-3495(03)74598-6. Biophys J. 2003. PMID: 12944283 Free PMC article.
-
Self-assembly of synthetic glycolipid/water systems.Adv Colloid Interface Sci. 1999 Apr 30;80(3):233-70. doi: 10.1016/s0001-8686(98)00085-2. Adv Colloid Interface Sci. 1999. PMID: 10696261 Review.
-
Interaction of dirhamnolipid biosurfactants with phospholipid membranes: a molecular level study.Adv Exp Med Biol. 2010;672:42-53. doi: 10.1007/978-1-4419-5979-9_3. Adv Exp Med Biol. 2010. PMID: 20545272 Review.
Cited by
-
The Exploration of the Thermococcus barophilus Lipidome Reveals the Widest Variety of Phosphoglycolipids in Thermococcales.Front Microbiol. 2022 Jul 5;13:869479. doi: 10.3389/fmicb.2022.869479. eCollection 2022. Front Microbiol. 2022. PMID: 35865931 Free PMC article.
-
Galactolipids Are Essential for Internal Membrane Transformation during Etioplast-to-Chloroplast Differentiation.Plant Cell Physiol. 2019 Jun 1;60(6):1224-1238. doi: 10.1093/pcp/pcz041. Plant Cell Physiol. 2019. PMID: 30892620 Free PMC article.
-
Interplay of Trans- and Cis-Interactions of Glycolipids in Membrane Adhesion.Front Mol Biosci. 2021 Nov 19;8:754654. doi: 10.3389/fmolb.2021.754654. eCollection 2021. Front Mol Biosci. 2021. PMID: 34869588 Free PMC article.
-
Lateral membrane organization as target of an antimicrobial peptidomimetic compound.Nat Commun. 2023 Jul 7;14(1):4038. doi: 10.1038/s41467-023-39726-5. Nat Commun. 2023. PMID: 37419980 Free PMC article.
-
Interacting Bacteria Surfaces.Biophys J. 2018 Apr 10;114(7):1515-1517. doi: 10.1016/j.bpj.2018.03.010. Biophys J. 2018. PMID: 29642022 Free PMC article. No abstract available.
References
-
- Stoffel W. & Bosio A. Myelin glycolipids and their functions. Curr. Opin. Neurobiol. 7, 654–661 (1997). - PubMed
-
- Boudière L. et al.. Glycerolipids in photosynthesis: composition, synthesis and trafficking. Biochim. Biophys. Acta 1837, 470–480 (2014). - PubMed
-
- Block M. A., Dorne A.-J., Joyard J. & Douce R. Preparation and characterization of membrane fractions enriched in outer and inner envelope membranes from spinach chloroplasts. ii. biochemical characterization. J. Biol. Chem. 258, 13281–13286 (1983). - PubMed
-
- Petroutsos D. et al.. Evolution of galactoglycerolipid biosynthetic pathways–from cyanobacteria to primary plastids and from primary to secondary plastids. Prog. Lipid. Res. 54, 68–85 (2014). - PubMed
Publication types
MeSH terms
Substances
LinkOut - more resources
Full Text Sources
Other Literature Sources
