. 2017 Apr 3:8:14861.
doi: 10.1038/ncomms14861.

The conserved protein Seb1 drives transcription termination by binding RNA polymerase II and nascent RNA

Affiliations

The conserved protein Seb1 drives transcription termination by binding RNA polymerase II and nascent RNA

Sina Wittmann et al. Nat Commun. .

Abstract

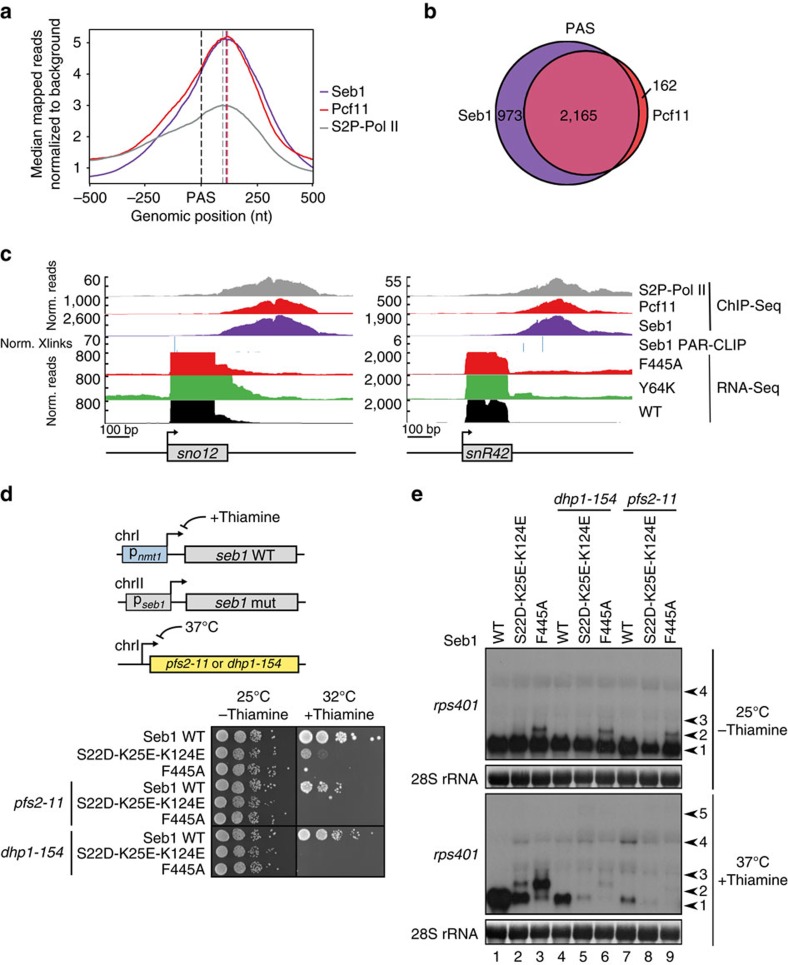
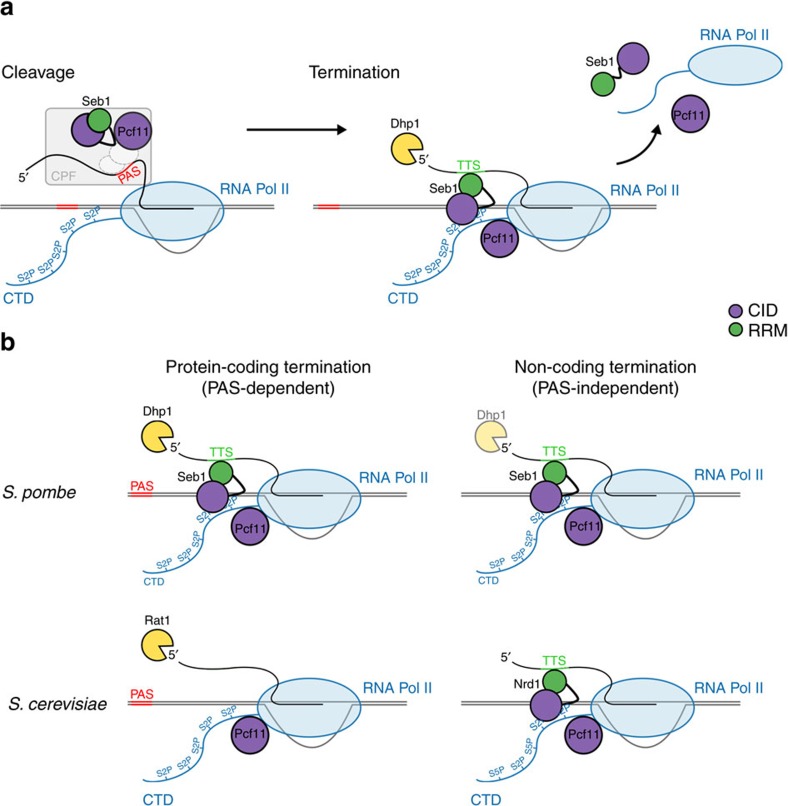
Termination of RNA polymerase II (Pol II) transcription is an important step in the transcription cycle, which involves the dislodgement of polymerase from DNA, leading to release of a functional transcript. Recent studies have identified the key players required for this process and showed that a common feature of these proteins is a conserved domain that interacts with the phosphorylated C-terminus of Pol II (CTD-interacting domain, CID). However, the mechanism by which transcription termination is achieved is not understood. Using genome-wide methods, here we show that the fission yeast CID-protein Seb1 is essential for termination of protein-coding and non-coding genes through interaction with S2-phosphorylated Pol II and nascent RNA. Furthermore, we present the crystal structures of the Seb1 CTD- and RNA-binding modules. Unexpectedly, the latter reveals an intertwined two-domain arrangement of a canonical RRM and second domain. These results provide important insights into the mechanism underlying eukaryotic transcription termination.


Conflict of interest statement

The authors declare no competing financial interests.

Figures

Figure 1
Figure 1. Seb1 localizes to the 3′ end of genes and interacts with the CPF.
(a) Comparative overview of homologous CID-containing proteins from S. pombe, S. cerevisiae and H. sapiens. CTD specificities are based on this study, published data or inferred from sequence alignments (in Supplementary Fig. 2d). (b) The Seb1 binding motif as determined by PAR-CLIP is shown. The motif occurrence is 42.74% in a window of ±25 nt around the crosslinked site (XXmotif E-value: 5.34 × 10−55). (c) Averaged occupancy profiles of Seb1 and input from ChIP, PAR-CLIP crosslinks and occurrence of the Seb1 binding motif UGUA, normalized to transcript levels are shown. The profiles are aligned to the TSS and PAS as indicated. Genes that have less than a 250 nt distance to their downstream gene or that are shorter than 500 nt were excluded from the analysis (n=4,228). The PAR-CLIP and motif profiles were smoothed using a Gaussian smoothing function and adjusted to bring to scale with the ChIP-seq profile. (d) Overlap between Seb1 binding in PAR-CLIP and ChIP as well as motif occurrence are shown as Venn diagrams. Presence of crosslinks, ChIP peak summits, or a higher than average motif occurrence in a window of 10 nt before to 250 nt after the TSS are shown on the left, and 250 nt around the PAS on the right. The same subset of genes was used as in c.
Figure 2
Figure 2. The Seb1-CID preferentially binds to S2P-CTD and is required for viability.
(a) Spot test showing growth of Seb1 deletion mutants on media containing or lacking thiamine (+ and – thiamine, respectively). The strains carry a thiamine-repressible WT and a mutated Seb1 copy under control of the endogenous promoter. (b) Binding of Seb1-CID1-152 to the FAM-tagged two-repeat non-phosphorylated or phosphorylated CTD peptides measured by FA. Error bars show the standard deviation of at least three independent repeats. (c) Binding assays of IgG purified Seb1-HA-TAP to biotinylated non-phosphorylated or phosphorylated four-repeat CTD peptides immobilized on streptavidin beads analysed by western blot using α-HA antibody. (d) Crystal structure of the Seb1-CID1-152. Amino acids that were later changed by mutagenesis in vivo are depicted as sticks. Yellow amino acids are involved in S5P recognition, red amino acids are important for S2P binding and Y64 (brown) interacts with the CTD independently of any phosphate moieties. (e) Structure of S. cerevisiae Rtt103 in complex with S2P-CTD (PDBID 2L0I). Topologically conserved residues, which are also found in Seb1 at equivalent positions (compare with d) and are involved in S2P-CTD recognition, are shown in red. R108 contacts the phosphate on S2 in most states of the NMR ensemble (dotted black line) while K105 binds only in some (dotted grey line). A key conserved Tyr is shown in brown. (f) Structure of S. cerevisiae Nrd1 in complex with S5P-CTD (PDBID 2LO6). Relevant amino acids located at equivalent positions to those shown for the Seb1-CID are coloured as in d. Residues contacting S5P are conserved in Seb1 (compare with d) and shown in yellow. (g) Binding of WT and mutated Seb1-CID1–152 (as indicated) to S2-phosphorylated FAM-tagged double-repeat CTD peptides measured by FA. Error bars show the standard deviation of three technical replicates. (h) Same as g but binding to S5-phosphorylated CTD peptides was measured. (i) Same as g but binding to non-phosphorylated CTD peptides was measured. (j) Spot test showing the effect of the indicated Seb1-CID point mutations on cell growth on media containing or lacking thiamine as in a.
Figure 3
Figure 3. The Seb1-RRM domain has an unusual structure and RNA binding is essential.
(a) Crystal structure of the Seb1-RRM388–540 domain is shown as a cartoon representation, coloured in blue to red from the N- to the C-terminus. The position of the canonical RRM and the additional RRM-like domain is indicated below the structure. The two domains are interwoven and cross over between β2 and β3. (b) Electrostatic surface of the Seb1-RRM388–540 shown in the same orientations as in a. Positively charged areas are coloured in blue and negatively charged areas in red. Arrows indicate a contiguous positively charged region tentatively assigned to interaction with the RNA phosphate backbone. (c) Plot showing a solution SAXS curve of the Seb1-RRM388–540 (green). To compare the solution and crystallographic conformations of the Seb1-RRM388–540, a scattering profile was computed from the X-ray structure (black) and fitted to the solution scattering data. The quality of the fit as expressed as χ is indicated. (d) Flexibility analysis of the Seb1-RRM388–540 (green) and a lysozyme standard (grey, BioisisID: LYSOZP) via dimensionless Kratky plot is shown. The intersection of the lines indicates the Guinier–Kratky point (formula image
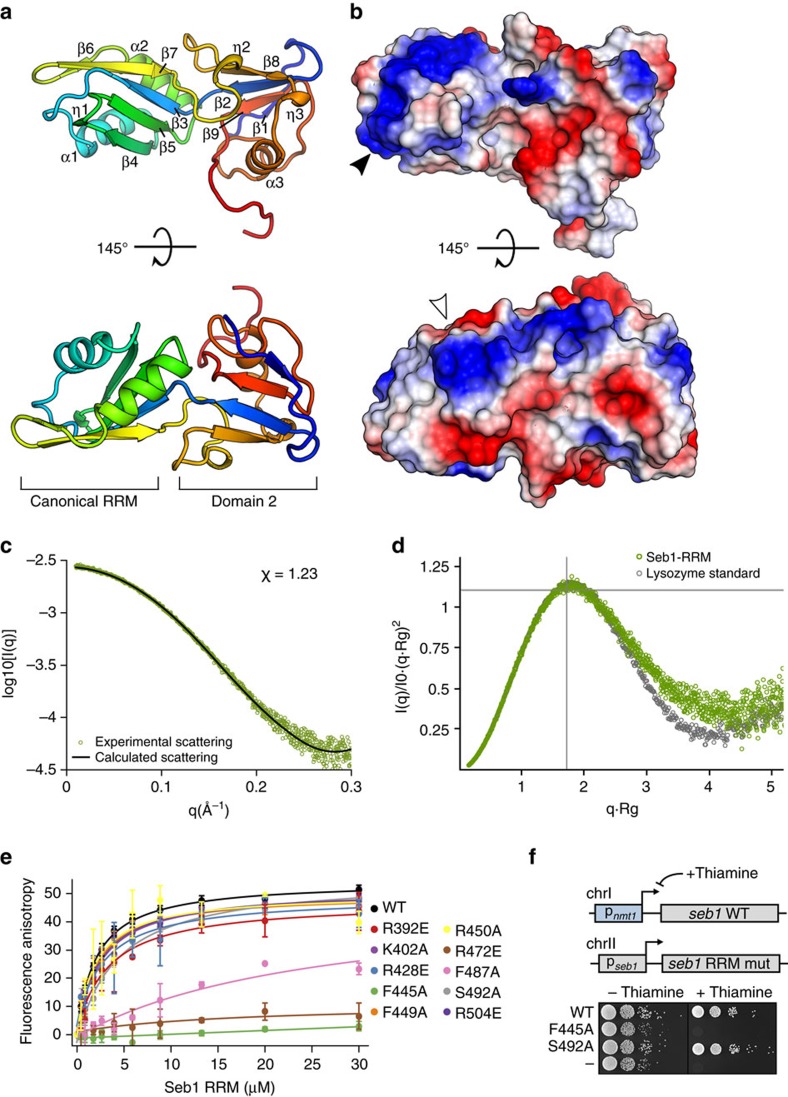
, 1.104), the peak position of an ideal globular and rigid protein. Rigid proteins show a characteristic parabolic shape with a peak at the indicated position (as is the case here), while unfolded proteins would plateau with increasing q-values. (e) Analysis of Seb1-SUMO-RRM388–540 binding to FAM-tagged AUUAGUAAAA RNA by FA. Error bars indicate standard deviation of three technical replicates. (f) Spot test showing the effect of the indicated Seb1-RRM point mutations on cell growth.
Figure 4
Figure 4. Seb1 point mutations cause transcriptional read-through genome-wide.
(a) Analysis of Seb1-HA recruitment to the rps401 gene by ChIP-qPCR. Positions of primers used are shown in the schematics above. Seb1-WT was depleted in thiamine-containing media for 24 h. Error bars indicate the standard error of biological duplicates. (b) Left: same as a but a phosphorylation-independent antibody against the Pol II-CTD was used (8WG16). Right: Same as a but signal was normalized to Pol II levels (shown on the left). (c) Median mapped reads determined by RNA-Seq in the indicated point mutants were centred on the PAS. All curves are normalized to the same starting value using the same subset of genes as in Fig. 1c. (d) Read-through of the different point mutants was determined by dividing mapped reads in the window PAS ±50 nt by the read count within the gene-body (n=5,119). The log2 fold change in read-through as compared to WT is shown. The significance of the overall difference between WT and each mutant was determined by the Wilcoxon–Mann–Whitney test and is indicated below each box. (e) Northern blot showing different transcripts derived from the rps401 gene in the indicated mutants (cells were grown as in a). Arrows on the right mark individual transcripts and the position of the probe used relative to the gene is indicated in the schematics above. (f) Venn diagram depicting the overlap between genes that show significantly (P<0.05) more read-through than WT calculated as in d and determined by the Kruskal–Wallis test for the indicated strains. Protein-coding (top, n=4,105) and non-coding (bottom, n=1,013) genes are shown separately. No genes could be found in the strains S22D-K25E and S492A that have significantly more read-through than WT. (g) The log2 fold read-through was calculated as in d for the same subset of genes as in Fig. 1c but here, all genes were split into two groups, those containing crosslinks detectable by PAR-CLIP at 250 nt±PAS (n=1,536) and those that do not (n=2,692). The significance of the difference between the two groups was calculated for each mutant as in d. In box plots in this figure, the centre line is the median, the box limits are from the second to the third quartile (so 25% to 75% of the data points), and the whiskers extend from there to the min and max values, with outliers indicated by dots outside the whiskers.
Figure 5
Figure 5. Seb1 and Pcf11 are recruited to the same genes.
(a) Averaged occupancy profiles of Seb1-TAP, Pcf11-TAP and S2P-Pol II on protein-coding genes as determined by ChIP-seq was calculated and centred at the PAS. Genes with a distance less than 500 nt to their downstream gene were excluded (n=2,811). (b) Venn diagram depicting the overlap between genes that are bound by Seb1 and those that are bound by Pcf11 at PAS±250 nt. The summits of the ChIP-seq peaks were used to define binding in this window, the same subset of genes was used as in a. (c) Profiles of mapped reads normalized to adh1 as determined by RNA-Seq of WT, Y64K and F445A after 24 h in thiamine-containing media, crosslinking sites normalized to transcript abundance from Seb1 PAR-CLIP and mapped reads normalized to a background control from ChIP-Seq of Seb1-TAP, Pcf11-TAP and S2P-Pol II are shown for two sn/snoRNA genes as indicated. (d) Spot test showing the effect of the indicated Seb1 point mutations in combination with either of the temperature-sensitive alleles dhp1-154 or pfs2-11, as indicated, on cell growth. (e) Northern blot showing different transcripts derived from the rps401 gene in the same strains as shown in d. Cells were grown in thiamine-containing medium for 24 h at 25 °C and shifted to 37 °C for the last 3 h before collection. The same probe was used as in Fig. 4e.
Figure 6
Figure 6. Model for the function of Seb1 and Pcf11 in transcription termination.
(a) A proposed model for 3′ end formation and transcription termination that relies on the cooperative action of the CID-proteins Seb1 and Pcf11. Seb1 and Pcf11 are recruited to the 3′ ends through interaction with components of the CPF complex. During transcript cleavage by the CPF/CF, Pol II is phosphorylated on S2 which allows direct CTD interaction of Seb1 and Pcf11. In addition, the Seb1 binding motif, which serves as a termination signal (TTS), is transcribed allowing for Seb1 interaction with the nascent transcript via its RRM domain. Seb1 and Pcf11, probably together with the exonuclease Dhp1, lead to the disassembly of the Pol II complex from the DNA template. (b) Fission yeast utilize a conserved mechanism for termination of the PAS-dependent (protein-coding) and PAS-independent (non-coding) genes. This is in contrast to budding yeast which relies on two different mechanisms for termination. In fission yeast, Seb1 and Pcf11 are necessary for termination of Pol II on both classes of genes. In budding yeast, protein-coding genes are terminated by Pcf11 and Rat1, whereas non-coding transcripts are terminated by Nrd1. Pcf11 is involved in termination of all Pol II transcribed genes in both yeasts.

Similar articles

Cited by

References

    1. Greger I. H. & Proudfoot N. J. Poly(A) signals control both transcriptional termination and initiation between the tandem GAL10 and GAL7 genes of Saccharomyces cerevisiae. EMBO J. 17, 4771–4779 (1998). - PMC - PubMed
    1. Martens J. A., Laprade L. & Winston F. Intergenic transcription is required to repress the Saccharomyces cerevisiae SER3 gene. Nature 429, 571–574 (2004). - PubMed
    1. Kim M. et al.. The yeast Rat1 exonuclease promotes transcription termination by RNA polymerase II. Nature 432, 517–522 (2004). - PubMed
    1. Kobor M. S. & Greenblatt J. Regulation of transcription elongation by phosphorylation. Biochim. Biophys. Acta 1577, 261–275 (2002). - PubMed
    1. Buratowski S. The CTD code. Nat. Struct. Biol. 10, 679–680 (2003). - PubMed

Publication types

MeSH terms