. 2017 Apr 3:7:45847.
doi: 10.1038/srep45847.

Comparing multifocal pupillographic objective perimetry (mfPOP) and multifocal visual evoked potentials (mfVEP) in retinal diseases

Affiliations

Comparing multifocal pupillographic objective perimetry (mfPOP) and multifocal visual evoked potentials (mfVEP) in retinal diseases

Faran Sabeti et al. Sci Rep. .

Abstract

Multifocal pupillographic objective perimetry (mfPOP) shows regions of slight hypersensitivity away from retinal regions damaged by diabetes or age-related macular degeneration (AMD). This study examines if such results also appear in multifocal visual evoked potentials (mfVEPs) recorded on the same day in the same patients. The pupil control system receives input from the extra-striate cortex, so we also examined evidence for such input. We recruited subjects with early type 2 diabetes (T2D) with no retinopathy, and patients with unilateral exudative AMD. Population average responses of the diabetes patients, and the normal fellow eyes of AMD patients, showed multiple regions of significant hypersensitivity (p < 0.05) on both mfPOP and mfVEPs. For mfVEPs the occipital electrodes showed fewer hypersensitive regions than the surrounding electrodes. More advanced AMD showed regions of suppression becoming centrally concentrated in the exudative AMD areas. Thus, mfVEP electrodes biased towards extra-striate cortical responses (surround electrodes) appeared to show similar hypersensitive visual field locations to mfPOP in early stage diabetic and AMD damage. Our findings suggest that hypersensitive regions may be a potential biomarker for future development of AMD or non-proliferative diabetic retinopathy, and may be more informative than visual acuity which remains largely undisturbed during early disease.


Conflict of interest statement

Faran Sabeti – Research support NuCoria Pty Ltd., Acton, ACT. Australia. Andrew James - Research support and Patent NuCoria NuCoria Pty Ltd., Acton, ACT. Australia. Corinne Carle – Patent NuCoria Pty Ltd., Acton, ACT. Australia. Rohan Essex – None. Andrew Bell – None. Ted Maddess - Research support and Patent NuCoria Pty Ltd., Acton, ACT. Australia.

Figures

Figure 1
Figure 1. Mean deviations reproduced from 3 published mfPOP studies of retinal disease.
In each case the grey-level plots indicate the average results of up to 50 left and right eyes of patients showing the average difference from normative data at each visual field location. In each panel the background grey indicates no difference from normal, darker tones indicate loss of sensitivity, lighter: hypersensitivity. (A) Is from eyes from a study in which persons commenced ranibizumab (Lucentis) treatment for the first time in one eye (N = 20). Individual eyes with hypersensitive regions showed significantly better reduction in retinal thickness (P < 0.0005). (B) Mean deviations for 50 eyes of T2D patients with up to 25 years of disease but no vascular changes. Asymmetry between eyes yielded AUC values up to 0.94. (C) Mean deviations from normal data for 18 eyes with small to moderate drusen. (D) Mean deviations from normal data for 20 eyes with exudative (Wet) AMD. C and D are from the same study. In all cases data from right eyes was flipped left to right before averaging. Thus all data is presented as for left eyes, with the temporal field on the left side of each panel. All averaged field data in the paper are presented in the same way. The stimulus array of B had twice the diameter of the other stimuli, extending to ± 30 degrees eccentricity. The response units shown are those used in the original reports.
Figure 2
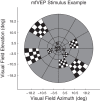
Figure 2. The mfVEP stimuli presented 84 M-scaled stimuli to each eye concurrently using the mfPOP dichoptic system.
The figure illustrates the sparse stimuli wherein transient (33 ms) checkerboard stimuli are presented in one of two alternative contrast formats against a mean luminance grey background. The two contrasts can be appreciated by following the check colouring around each ring. The thin black lines were not present and are shown here only to illustrate where checkerboards could appear. The central 1 degree contained a red fixation cross. Recording run duration was 240 seconds divided into eight segments of 30 s.
Figure 3
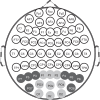
Figure 3. The EEG electrode array was based on a standard 10–10 layout.
Responses in this study were the root mean square of response waveforms across two sets of electrodes, for each of the 84 stimulus locations. The first electrode set consisted of the occipital pole electrodes shown in light grey and also Iz, PO1 and PO3, which are not shown to avoid clutter. PO1 and PO3 are additional to the 10–10 array and are between PO3 and Oz and PO4 and Oz, giving extra weight to the striate visual cortex. The second set comprised the surrounding electrodes shown here in dark grey, and also contained P9 and P10 which are not shown.
Figure 4
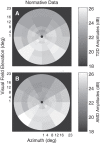
Figure 4. Mean response amplitudes for control subjects in AMD and T2D.
A and B show the means across the Occipital Pole electrode data for the normal control eyes, where the input for each region was the peak RMS value from each electrode for each region. Data are presented as if for left eyes with the temporal field at left. (A) Normative data for the 44 normal control eyes of the T2D study. (B) The normative data from the 56 normal control eyes of the AMD study. The minimum amplitude in either plot is 22.3 dB. The black background corresponds to 18 dB allowing small differences it be seen across the field. The T2D and AMD data were collected 4 months apart and there were no common subjects, nevertheless they are remarkably similar. The gradient of responses from superior to inferior is typical for VEPs for scalp electrodes.
Figure 5
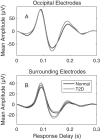
Figure 5. Mean waveforms computed across eyes, subjects, visual field regions (n = 84) for the two electrode arrays from the T2D study.
(A) Occipital pole electrodes (n = 12) for normal subjects (black waveform) and T2D patients with no retinopathy. Each trace is the average of 2 × 23 × 84 × 9 = 34,776 measured responses (eyes × subjects × stimulus regions × electrodes). Patient (grey) and control (black) waveforms are very similar. (B) Averages for the 2 × 23 × 84 × 8 = 30,912 waveforms from the surround electrodes. On average the surround electrode responses of the patients appear to be larger than those of the control subjects. Quantification of these effects by visual field regions follows. The thin black lines of B indicate the means -1 SE and +1 SE for the T1D and Normal waveforms respectively with correction for multiple comparisons. The lack of overlap would indicate significant difference. Age and sex corrected estimates indicated a difference of the first peak of 0.272 dB at p < 0.001.
Figure 6
Figure 6. Mean mfVEP waveforms for each of the 84 visual field locations.
Mean waveforms were computed across subjects and electrodes, black traces are for left eyes, and grey for right. Where right eye data overlaps left only grey is seen. The data are means across the 51 control subjects from both studies. (A) Occipital electrode data show inversion of waveform sign about the horizontal meridian (polar angle = 0 on ordinate). (B) Surround electrodes show a mixture near fixation and no inversion peripherally. Eyes were averaged as if both were left eyes with the temporal field on the left. The axes are a log-polar layout as on the cortex, with log-eccentricity from fixation on the abscissa running from 20 degrees temporal (20T) to 20 degrees nasal (20N), and polar angle on the ordinate. The left and right half-rows thus represent the radial spokes of the stimulus array (cf. Fig. 2).
Figure 7
Figure 7. T2D mean response deviations.
(A & C) Mean deviations from normative data (e.g. Fig. 3) computed across T2D subjects and eyes obtained from a linear model, which also included terms for age relative to 60 years and gender. (A) Deviations from normality computed across the Occipital electrodes. (C) Deviations from normality computed across the surrounding electrodes. (B & D) Indicate those regions deviating significantly from normal (p < 0.05). White regions indicate those which across the 40 subjects and eyes had RMS peak values that were larger than normal. Significant depression of responses would have been indicated in black, but there were no such regions. Consistent with Fig. 4 more regions show significantly elevated responses for the Surrounding electrodes than for the Occipital electrodes.
Figure 8
Figure 8. Mean response deviations from the normative data (e.g. Fig. 3B) for three severities of AMD.
Response deviations measured from Occipital (A to C) or Surrounding (D to E) electrodes. The plots are thus similar to Fig. 5A,C. The grey background indicates 0 difference from normal. The top row (A,D) are for the 4 fellow eyes that showed a clinically normal fundus appearance for persons aged 74 years. The middle row (C,E) are for the 17 eyes with early AMD characterised by drusen and pigmentary changes. The bottom row represent the 17 eyes with exudative AMD (exudative).
Figure 9
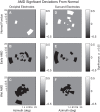
Figure 9. Significant regional visual field deviations across three AMD severities.
Visual field regions from Fig. 6 showing significant (p < 0.05) deviations from normal. White regions indicate larger responses than normal, black regions indicate significant response suppression. The exudative AMD eyes (C, F) show marked central loss, while the average losses are more scattered for the Early AMD eyes. Consistent with Fig. 5 the Surrounding electrodes show more regions of response enhancement or fewer regions that are suppressed at peripheral locations.

Similar articles

Cited by

References

    1. Maddess T., Bedford S. M., Goh X. L. & James A. C. Multifocal pupillographic visual field testing in glaucoma. Clin Experiment Ophthalmol 37, 678–686, doi: 10.1111/j.1442-9071.2009.02107.x (2009). - DOI - PubMed
    1. Bell A., James A. C., Kolic M., Essex R. W. & Maddess T. Dichoptic multifocal pupillography reveals afferent visual field defects in early type 2 diabetes. Invest Ophthalmol Vis Sci 51, 602–608, doi: 10.1167/iovs.09-3659 (2010). - DOI - PubMed
    1. Carle C. F., Maddess T. & James A. C. Contraction anisocoria: segregation, summation, and saturation in the pupillary pathway. Invest Ophthalmol Vis Sci 52, 2365–2371, doi: 10.1167/iovs.10-6335 (2011). - DOI - PubMed
    1. Sabeti F., James A. C. & Maddess T. Spatial and temporal stimulus variants for multifocal pupillography of the central visual field. Vision Res 51, 303–310, doi: 10.1016/j.visres.2010.10.015 (2011). - DOI - PubMed
    1. Sabeti F., Maddess T., Essex R. W. & James A. C. Multifocal pupillographic assessment of age-related macular degeneration. Optom Vis Sci 88, 1477–1485, doi: 10.1097/OPX.0b013e318235af61 (2011). - DOI - PubMed

MeSH terms