. 2017 Apr 3:7:44921.
doi: 10.1038/srep44921.

Memory and synaptic plasticity are impaired by dysregulated hippocampal O-GlcNAcylation

Affiliations

Memory and synaptic plasticity are impaired by dysregulated hippocampal O-GlcNAcylation

Yong Ryoul Yang et al. Sci Rep. .

Abstract

O-GlcNAcylated proteins are abundant in the brain and are associated with neuronal functions and neurodegenerative diseases. Although several studies have reported the effects of aberrant regulation of O-GlcNAcylation on brain function, the roles of O-GlcNAcylation in synaptic function remain unclear. To understand the effect of aberrant O-GlcNAcylation on the brain, we used Oga+/- mice which have an increased level of O-GlcNAcylation, and found that Oga+/- mice exhibited impaired spatial learning and memory. Consistent with this result, Oga+/- mice showed a defect in hippocampal synaptic plasticity. Oga heterozygosity causes impairment of both long-term potentiation and long-term depression due to dysregulation of AMPA receptor phosphorylation. These results demonstrate a role for hyper-O-GlcNAcylation in learning and memory.


Conflict of interest statement

The authors declare no competing financial interests.

Figures

Figure 1
Figure 1
Normal morphological features and dendritic spine density in Oga+/− brains (a) Beta galactosidase (LacZ) staining of the Oga+/− adult brain, confirming the expression pattern of OGA in the hippocampus. Scale bar, 200 μm. (b) Immunoblot analysis showing elevated O-GlcNAcylation in Oga+/− hippocampal lysates compared with that in the WT hippocampal lysates. (c) Representative images of hippocampal neurons from WT and Oga+/− mice immunolabeled for O-GlcNAc (green). Scale bar, 200 μm. (d) Nissl staining of the hippocampus from coronal brain sections. Scale bar, 100 μm. (e) Immunostaining for a neuronal cell marker (neuronal nuclei; NeuN), glial marker (glial fibrillary acidic protein; GFAP), and nuclei (4′,6-diamidino-2-phenylindole; DAPI) in the hippocampus of WT and Oga+/− mice at eight weeks of age. Three sections were obtained from three mice. Scale bar, 100 μm. (f) Representative pictures of brain tissues. (g) Whole-brain weight (without skull) isolated from the WT and Oga+/− mice at eight weeks of age (n = 5). (h) Representative images of dendritic segments of Golgi-stained CA1 pyramidal neurons from WT and Oga+/− mice (scale bar = 10 μm) (i) Spine number was quantified along a 10 μm segment from the primary apical dendritic branch origin of Golgi-impregnated CA1 pyramidal neurons (n = 15–20 dendrites from three mice). Error bars represent ± standard error of the mean (SEM). NS: not significant (unpaired t-test). Full-length blots/gels are presented in Supplementary Figure S4.
Figure 2
Figure 2
Spatial learning memory deficits in Oga+/− mice (a) Latency in attaining the goal and (b) number of errors committed before reaching the goal in the Barnes maze task. (WT, n = 9; Oga+/−, n = 9, one-way ANOVA followed by the Tukey’s test to unpaired t-test) (c) Representative traces of WT and Oga+/− mice in the Barnes maze task. (d) Total distance, (e) time spent in the target area, and (f) time of latency to attaining the target hole during a probe trial on day 5. (g) Total distance, (h) time spent in the target area, and (i) time of latency to attain the target hole during a probe trial on day 12. (WT, n = 9; Oga+/−, n = 9) (j) Schematic diagram of the context-dependent fear conditioning procedure (k) Percentage time freezing during the 3 min of the context test 24 h after fear conditioning. (WT, n = 9; Oga+/−, n = 8). Error bars represent ± standard error of the mean (SEM). NS: not significant, ***P < 0.001, **P < 0.01, *P < 0.05 (unpaired t-test).
Figure 3
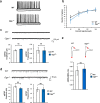
Figure 3. Normal synaptic transmission in Oga+/− mice.
(a) Representative traces of action potentials triggered by −100–200 pA current injection in the hippocampal CA1 region of WT and Oga+/− mice. (b) Number of action potentials trigged by the injection of current at different levels (WT, n = 11; Oga+/−, n = 9; unpaired t-test, not significant) (c) Representative mEPSC traces from WT and Oga+/− hippocampal CA1 pyramidal neurons (upper). Average values for mEPSC amplitude (lower left) and frequency (lower right) (WT, n = 9; Oga+/−, n = 10; unpaired t-test, NS: not significant) (d) Representative mIPSC traces from WT and Oga+/− hippocampal CA1 pyramidal neurons (upper). Average values for mIPSC amplitude (lower left) and frequency (lower right). (WT, n = 10; Oga+/−, n = 8; unpaired t-test, NS: not significant) (e) AMPA/NMDA current ratio (WT, n = 20; Oga+/−, n = 17; Mann-Whitney U test, NS: not significant).
Figure 4
Figure 4. Impaired long-term potentiation (LTP) and long-term depression (LTD) in Oga+/− mice.
(a) Input-output curves for basal synaptic transmission in area CA1 of the hippocampus. Representative traces are shown for the input (fiber volley) and the output (field excitatory postsynaptic potential; fEPSP). (WT, n = 9; Oga+/−, n = 10; unpaired t-test, not significant) (b) Paired-pulse facilitation (PPF) in WT and Oga+/− hippocampal CA1 pyramidal neurons. Representative traces from WT and Oga+/− at 50 ms interstimulus interval are shown. (WT, n = 8; Oga+/−, n = 10; unpaired t-test, not significant) (c) High frequency stimulation (HFS)-induced LTP (WT, n = 10; Oga+/−, n = 9). Traces show averaged fEPSP indicated with 1 and 2. A bar graph is depicted 50 min after LTP. (d) LFS-induced LTD (WT, n = 7; Oga+/−, n = 8). Traces show averaged fEPSP indicated with 1 and 2. A bar graph is depicted 50 min after LTD. Error bars represent ± standard error of the mean (SEM). ***P < 0.001 (unpaired t-test).
Figure 5
Figure 5. Deficit in chemically induced LTP and LTD in Oga+/− mice.
(a) Representative immunoblots showing effects of chemical LTP and LTD induction on AMPAR subunits GluA1 S845, S831 phosphorylation. Acute hippocampal slices were stimulated with either glycine (200 μM) for chemical LTP or NMDA (20 μM) for chemical LTD. Levels of phospho-S845 and phospho-S831 of GluA1, and levels of total O-GlcNAc-modified proteins were analyzed by immunoblotting. (b) Chemical LTP and LTD significantly increases and decreases the levels of GluA1 S845 phosphorylation, respectively in WT (n = 4, normalized to control). However, acute hippocampal slices from Oga+/− mice failed to exhibit a significant change in GluA1 S845 phosphorylation following chemical LTP and LTD induction (n = 3, normalized to control). One-way ANOVA followed by the Tukey’s test was used. (c) Chemical LTP significantly increases the levels of GluA1 S831 phosphorylation in WT (n = 3, normalized to control), but not in Oga+/− mice (n = 3, normalized to control). Error bars represent ± standard error of the mean (SEM). NS: not significant, *p < 0.05, **p < 0.01, ***p < 0.001; one-way ANOVA followed by the Tukey’s test. Full-length blots/gels are presented in Supplementary Figure S4.

Similar articles

Cited by

References

    1. Hart G. W., Slawson C., Ramirez-Correa G. & Lagerlof O. Cross talk between O-GlcNAcylation and phosphorylation: roles in signaling, transcription, and chronic disease. Annu Rev Biochem 80, 825–858, doi: 10.1146/annurev-biochem-060608-102511 (2011). - DOI - PMC - PubMed
    1. Okuyama R. & Marshall S. UDP-N-acetylglucosaminyl transferase (OGT) in brain tissue: temperature sensitivity and subcellular distribution of cytosolic and nuclear enzyme. J Neurochem 86, 1271–1280 (2003). - PubMed
    1. Yang Y. R. et al.. O-GlcNAcase is essential for embryonic development and maintenance of genomic stability. Aging Cell 11, 439–448, doi: 10.1111/j.1474-9726.2012.00801.x (2012). - DOI - PubMed
    1. Yuzwa S. A. et al.. Increasing O-GlcNAc slows neurodegeneration and stabilizes tau against aggregation. Nat Chem Biol 8, 393–399, doi: 10.1038/nchembio.797 (2012). - DOI - PubMed
    1. Marotta N. P. et al.. O-GlcNAc modification blocks the aggregation and toxicity of the protein alpha-synuclein associated with Parkinson’s disease. Nat Chem 7, 913–920, doi: 10.1038/nchem.2361 (2015). - DOI - PMC - PubMed

Publication types

MeSH terms

Substances