. 2017 May;23(5):579-589.
doi: 10.1038/nm.4307. Epub 2017 Apr 3.

Oncostatin M drives intestinal inflammation and predicts response to tumor necrosis factor-neutralizing therapy in patients with inflammatory bowel disease

Collaborators, Affiliations

Oncostatin M drives intestinal inflammation and predicts response to tumor necrosis factor-neutralizing therapy in patients with inflammatory bowel disease

Nathaniel R West et al. Nat Med. 2017 May.

Erratum in

Abstract

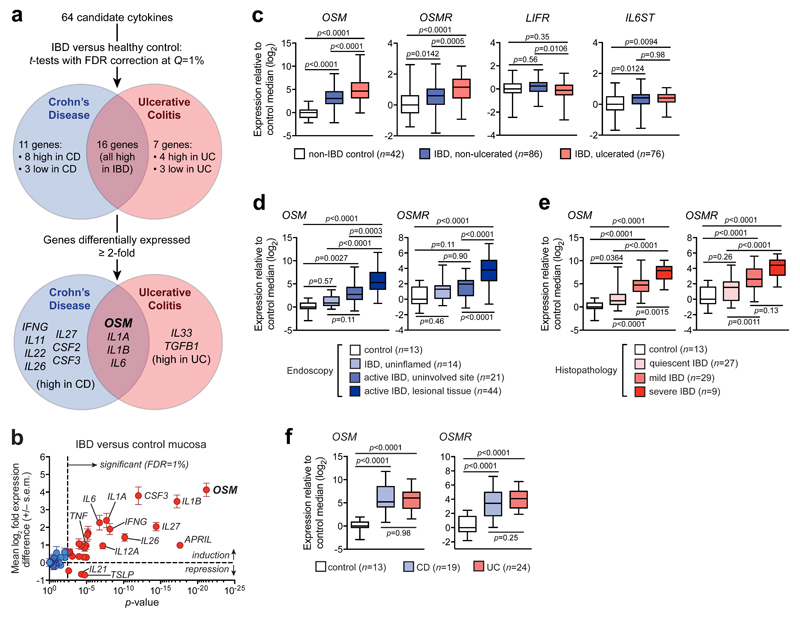
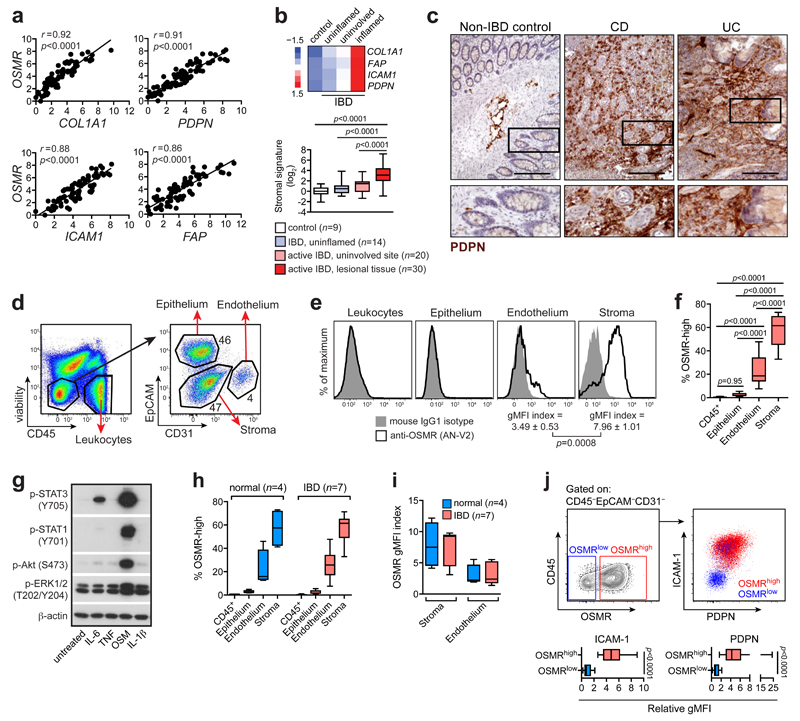
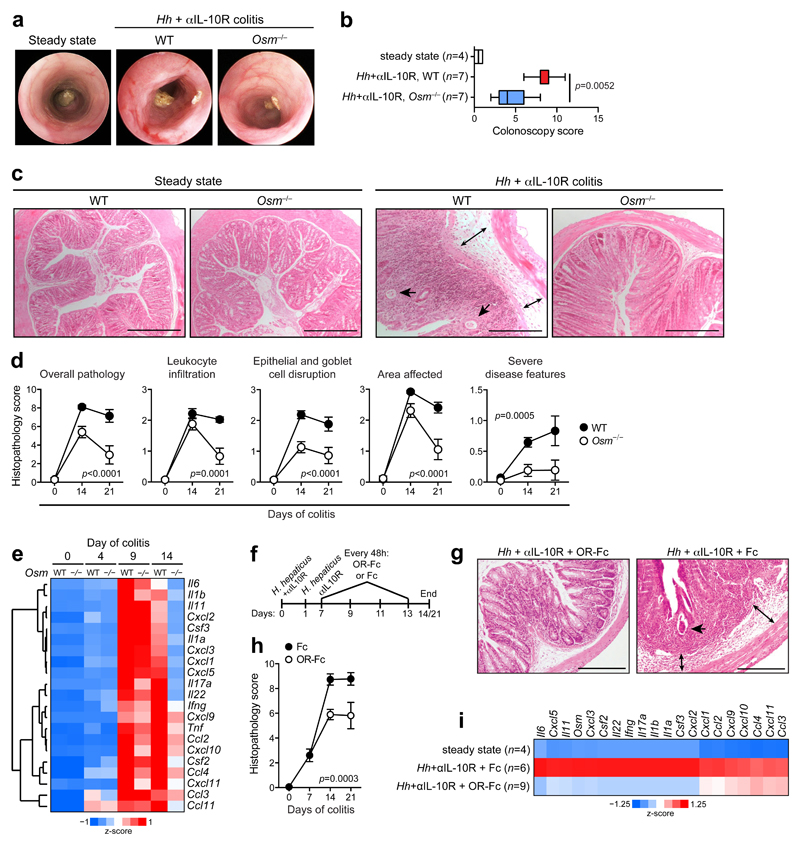
Inflammatory bowel diseases (IBD), including Crohn's disease (CD) and ulcerative colitis (UC), are complex chronic inflammatory conditions of the gastrointestinal tract that are driven by perturbed cytokine pathways. Anti-tumor necrosis factor-α (TNF) antibodies are mainstay therapies for IBD. However, up to 40% of patients are nonresponsive to anti-TNF agents, which makes the identification of alternative therapeutic targets a priority. Here we show that, relative to healthy controls, inflamed intestinal tissues from patients with IBD express high amounts of the cytokine oncostatin M (OSM) and its receptor (OSMR), which correlate closely with histopathological disease severity. The OSMR is expressed in nonhematopoietic, nonepithelial intestinal stromal cells, which respond to OSM by producing various proinflammatory molecules, including interleukin (IL)-6, the leukocyte adhesion factor ICAM1, and chemokines that attract neutrophils, monocytes, and T cells. In an animal model of anti-TNF-resistant intestinal inflammation, genetic deletion or pharmacological blockade of OSM significantly attenuates colitis. Furthermore, according to an analysis of more than 200 patients with IBD, including two cohorts from phase 3 clinical trials of infliximab and golimumab, high pretreatment expression of OSM is strongly associated with failure of anti-TNF therapy. OSM is thus a potential biomarker and therapeutic target for IBD, and has particular relevance for anti-TNF-resistant patients.


Conflict of interest statement

Competing Interests

NRW, ANH, BMJO, and FP are inventors of patents relating to OSM as a therapeutic target for IBD. NRW, ANH, BMJO, SPLT, and FP are shareholders in ImmElpis Pharma Ltd. SK has received honoraria and/or research support from Allergan, Abbvie, Astra-Zeneca, ChemoCentryx Inc., Dr Falk Pharma, Ferring, Gilead, GSK, Merck, Mitsubishi-Tanabe Pharma, Pfizer, and Vifor Pharma. SPLT has received research support from Abbvie, IOIBD, Lilly, UCB, Vifor, and the Norman Collison Foundation. SPLT receives consulting fees from Abbvie, Amgen, Biogen, Boehringer Ingelheim, Bristol-Myers Squibb, Celgene, Chemocentryx, Cosmo, Ferring, Giuliani SpA, GSK, Lilly, MSD, Neovacs, NovoNordisk, Norman Collison Foundation, Novartis, NPS Pharmaceuticals, Pfizer, Proximagen, Receptos, Shire, Sigmoid Pharma, Takeda, Topivert, UCB, VHsquared, and Vifor Pharma. SPLT has received speaker fees from Abbvie, Biogen, Ferring, and Takeda. BL, FB, CB, and SEP are employees of Janssen Research and Development LLC. SB and MC are currently employees of GSK. FP receives consultancy fees from Janssen and GSK (unrelated to this work).

Figures

Figure 1
Figure 1. Expression of OSM and OSMR in the inflamed intestinal tissue of patients with IBD.
(a) Identification of cytokines associated with intestinal inflammation in CD and UC patients. Data were derived from Gene Expression Omnibus (GEO) datasets GSE57945 (n=42 controls and n=162 CD) and GSE59071 (n=11 controls and n=74 UC). Briefly, mRNA expression of 64 cytokines was compared in IBD versus healthy control intestinal tissue using t-tests with false discovery rate correction (Q=1%). Significant hits were further selected using a fold difference threshold of ≥2. (b) RNA sequencing analysis of 64 cytokine genes in pediatric treatment-naïve CD patients (n=162) versus non-IBD controls (n=42; GEO #GSE57945). Blue symbols, not statistically significant after t-tests with FDR correction (Q=1%); red symbols, significantly altered cytokines. (c) Expression of OSM, OSMR, LIFR, and IL6ST (gp130) in the GSE57945 dataset. Statistics: one-way ANOVA with Tukey’s multiple comparisons tests (df=201). (df) Q-PCR analysis of OSM and OSMR in intestinal mucosal biopsies from IBD patients and healthy controls (Oxford cohort, see Supplementary Table 2 for details). Statistical comparisons made using one-way ANOVA with Tukey’s multiple comparisons tests (df=88 (d) ; df=74 (e); df=53 (f)). (d) Specimens categorized by macroscopic evidence of disease activity determined during endoscopy (includes IBD patients with no macroscopic inflammation (uninflamed), uninflamed specimens from patients with inflammation elsewhere in the bowel (uninvolved), and macroscopically inflamed specimens (lesional tissue)). (e) Samples categorized by inflammation severity, determined by routine clinical histopathological assessment of matched biopsies. (f) Analysis of inflamed lesions from active CD or UC.
Figure 2
Figure 2. Association of OSM with response to anti-TNF therapy.
(a) Identification of an OSM-associated inflammatory module in IBD. Expression of genes encoding chemokines and cytokines was examined in two cohorts, including healthy controls and patients with CD or UC (see Supplementary Fig. 2). Samples were grouped using unsupervised hierarchical clustering and 21 genes that correlated closely with OSM in both cohorts were identified. (b) Unsupervised hierarchical clustering of OSM-associated module genes in colonic biopsies of UC patients refractory to corticosteroids or immunosuppression prior to infliximab therapy (GEO #GSE12251). Patients form two groups after clustering: one with low (blue dendrogram) and one with high OSM-associated module expression (red dendrogram). Patients with complete histological and endoscopic disease resolution are indicated in white, while non-responsive patients are indicated in black (see bar below dendrograms). Data are median-normalized and log2 transformed. Rates of infliximab response in these patients are shown in panel (c). Statistics: Fisher’s exact test. (d) Receiver operator characteristic analysis of OSM and OSMR expression, distinguishing infliximab responders and non-responders in the GSE12251 dataset. (eg) An independent cohort of patients with moderate-to-severe UC treated with infliximab as part of a long-term safety study (clinical trial NCT00207688). (e and f) Mayo scores and colonic OSM expression at baseline and 8 weeks after therapy in different response groups (see Methods for definition of clinical response). Statistics: one-way ANOVA with Tukey’s multiple comparisons tests (df=27 (e) and df=47 (f)). (g) Pearson correlation of baseline OSM expression (relative units) and Mayo score.
Figure 3
Figure 3. Non-hematopoietic stromal cells are prevalent in inflamed intestinal tissue and express high levels of OSMR.
(a) Spearman correlation of OSMR expression with stromal genes in pooled healthy control and IBD biopsies assessed by Q-PCR (Oxford cohort, n=73). (b) Mean mRNA z-scores for the indicated stromal genes (top) and stromal signature expression (bottom) in intestinal biopsies from healthy controls or IBD patients (uninflamed, no endoscopic evidence of disease; uninvolved, uninflamed samples from patients with active disease; inflamed, samples from inflamed lesions). The stromal signature represents the average log2 expression of COL1A1, FAP, ICAM1, and PDPN. Statistics: one-way ANOVA with Tukey’s multiple comparisons tests (df=69). (c) Immunohistochemical staining of PDPN in colon tissue from representative non-IBD control, CD, and UC patients (scale bar=250µm). (df) Flow cytometry analysis of human intestinal mucosa (n=11 donors). (d) Identification of leukocytes, epithelial cells, endothelial cells, and stroma. (e) OSMR expression and isotype-normalized geometric mean fluorescence intensity (gMFI). Mean (+/− s.e.m.) gMFI compared using t-tests (t=3.924, df=20). (f) OSMR expression frequencies compared using one-way ANOVA with Tukey’s multiple comparisons tests (df=40). (g) Cropped Western blot images of cytokine-stimulated CCD18Co cell lysates. (h) OSMR expression frequencies in colon mucosal cell populations from non-IBD controls or patients with IBD. (i) Intensity of OSMR expression on colon endothelial and stromal cells from non-IBD controls or patients with IBD. (j) Representative flow cytometry staining of OSMR, ICAM-1, and PDPN on colon stroma, with ICAM-1 and PDPN gMFIs quantified below. Statistics: Mann-Whitney U tests (n=11).
Figure 4
Figure 4. OSM promotes inflammatory behavior in human intestinal stroma.
(a) Q-PCR analysis of OSM-induced genes in triplicate cultures of CCD18Co cells (normal human colonic stroma), relative to untreated conditions. Results are representative of three independent experiments. (bc) Analysis of OSMRlow and OSMRhigh stromal cells purified from resected human intestinal tissue using fluorescence-activated cell sorting (FACS). (b) Post-sorting cell purities from a representative non-IBD control. (c) Q-PCR analysis of stromal and inflammatory genes in the purified stromal fractions from n=3 donors. (d) Q-PCR analysis of triplicate CCD18Co cultures (representative of three independent experiments). Cells were stimulated with human OSM, TNF, IL-6, or combinations of the three for 2 hours and compared to untreated controls. Statistics: one-way ANOVA with Dunnett’s multiple comparisons tests (df=14). (e) Q-PCR analysis of primary intestinal stromal cultures from 10 donors, stimulated as in panel (d). Data represent fold changes between matched untreated and cytokine-stimulated samples. Statistics: Wilcoxon signed rank test, versus a theoretical median of 1. (f) Q-PCR analysis of CXCL9 and CCL2 expression in cytokine-stimulated stromal cultures from non-IBD controls (n=7) and IBD patients (n=3). Data represent fold changes between matched untreated and cytokine-stimulated samples. Statistics: t-tests (df=8). For CXCL9, t=3.594 (OSM), t=3.493 (TNF), and t=8.278 (OSM+TNF). For CCL2, t=1.928 (OSM), t=3.940 (TNF), and t=4.87 (OSM+TNF).
Figure 5
Figure 5. The OSM-stromal cell axis is conserved in anti-TNF resistant murine colitis.
(a) Induction of colitis using the Hh+αIL-10R protocol. Mice are sacrificed at day 14 or day 21, which corresponds to peak disease severity. (b) Total live CD45+ cells in the colon lamina propria at day 14 (n=8 steady state and n=9 colitic mice, representative of >3 independent experiments). (c) Q-PCR analysis of Osm and Osmr expression in whole-colon tissue from steady state (n=8) and colitic mice (n=15), representative of >3 independent experiments. (d) OSM measured by ELISA in mouse colon explant supernatants and cecal stool extracts from one of two independent experiments (steady state mice, n=4; colitic mice, n=10). In panels bd, groups are compared using Mann-Whitney U-tests. (e) Q-PCR gene expression analysis of FACS-purified populations from mouse colon (representative of two independent experiments). Each data point represents lamina propria cells pooled from two mice. Stromal cells were defined as CD45EpCAMCD31. (f) Immunofluorescent detection of PDPN+ stromal cells in healthy and inflamed mouse colon tissue. Scale bars, 250 µm (left) and 100 µm (right). (g) Detection of Osmr expression in healthy and inflamed mouse colon tissue using in situ hybridization (punctate red signal). Tissues were counterstained with hematoxylin. Examples of Osmr-expressing cells in healthy tissue are indicated with arrowheads. Scale bars, 250 µm (top) and 100 µm (bottom). PDPN and Osmr images are representative of 3 different mice per condition.
Figure 6
Figure 6. OSM promotes anti-TNF resistant colitis in vivo.
(ad) Hh+αIL-10R colitis in wild type C57BL/6 mice and Osm−/− littermates. (a) Representative colonoscopy images at day 21, with endoscopic pathology scores shown in panel b (compared using Mann-Whitney U-test). Data represent one of three independent experiments. (c) Representative H&E stained mid-colon cross-sections of healthy mice and colitic animals (day 21). Single arrows, crypt abscesses; double-arrows, submucosal edema. Scale bars: 500µm (steady state) and 250µm (colitic). (d) Histopathology scores for days 14 and 21. n≥7 mice per time-point, pooled from three experiments. P-values reflect differences between genotypes and are derived from two-way ANOVA. (e) Cytokine and chemokine mRNA expression in whole colon tissue from mice subjected to Hh+αIL-10R colitis for 4, 9, or 14 days (n=4–6 per group). Expression was averaged for mice within each genotype and timepoint group, and converted to z-scores. (f) Therapeutic blockade of OSM in the Hh+αIL-10R model. OR-Fc (150 µg every two days) or a molar-equivalent dose of Fc control protein were injected intraperitoneally starting at day 7. (g, h) Representative H&E stained mid-colon cross-sections of OR-Fc or Fc treated mice and associated histopathology scores (n=5–13 mice per group, pooled from three experiments). P-values reflect differences between treatments and are derived from two-way ANOVA. Single arrows, crypt abscesses; double-arrows, submucosal edema and inflammatory infiltrate. Scale bar=250 µm. (i) Expression of the OSM-associated inflammatory module in colons of mice treated as depicted in panel f. Data represent one of three independent experiments.

Comment in

Similar articles

Cited by

References

    1. Uniken Venema WT, Voskuil MD, Dijkstra G, Weersma RK, Festen EA. The genetic background of inflammatory bowel disease: from correlation to causality. J Pathol. 2017;241:146–158. - PubMed
    1. Basson A, Trotter A, Rodriguez-Palacios A, Cominelli F. Mucosal Interactions between Genetics, Diet, and Microbiome in Inflammatory Bowel Disease. Front Immunol. 2016;7:290. - PMC - PubMed
    1. de Souza HSP, Fiocchi C. Immunopathogenesis of IBD: current state of the art. Nat Rev Gastroenterol Hepatol. 2016;13:13–27. - PubMed
    1. Maloy KJ, Powrie F. Intestinal homeostasis and its breakdown in inflammatory bowel disease. Nature. 2011;474:298–306. - PubMed
    1. Neurath MF. Cytokines in inflammatory bowel disease. Nat Rev Immunol. 2014;14:329–342. - PubMed

MeSH terms