. 2017 Aug 10;36(32):4551-4561.
doi: 10.1038/onc.2017.89. Epub 2017 Apr 3.

circRNA_100290 plays a role in oral cancer by functioning as a sponge of the miR-29 family

Affiliations

circRNA_100290 plays a role in oral cancer by functioning as a sponge of the miR-29 family

L Chen et al. Oncogene. .

Retraction in

Abstract

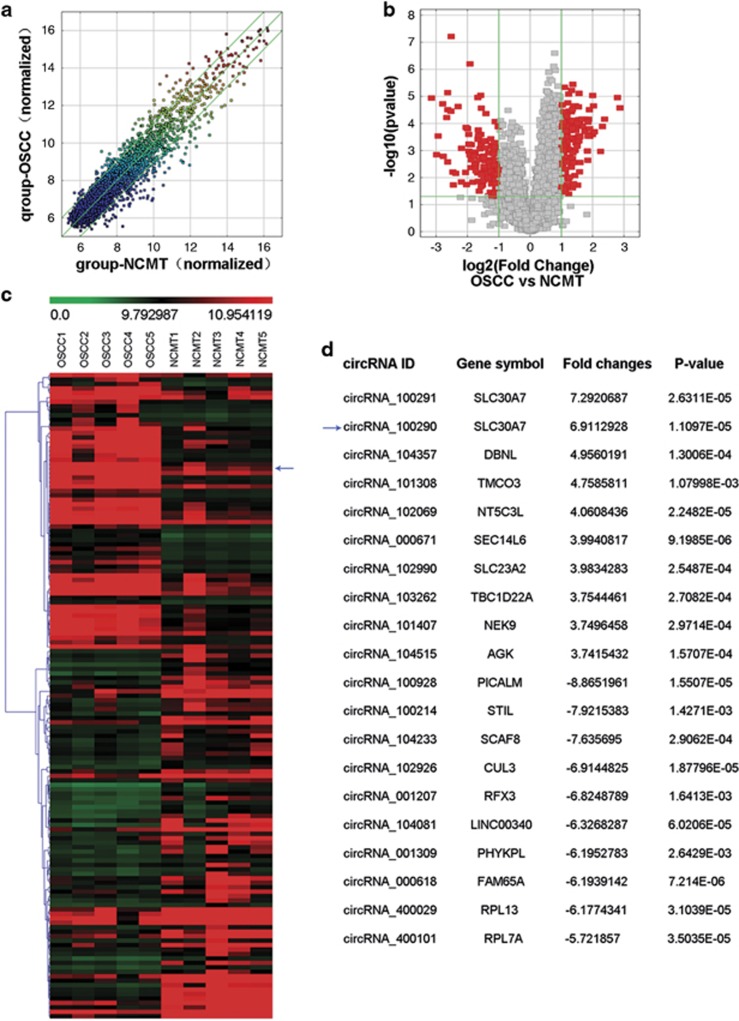
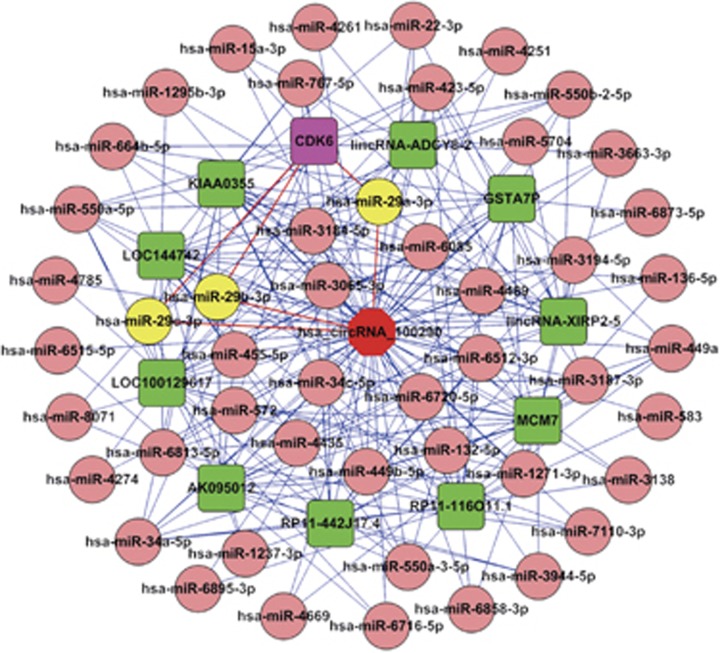
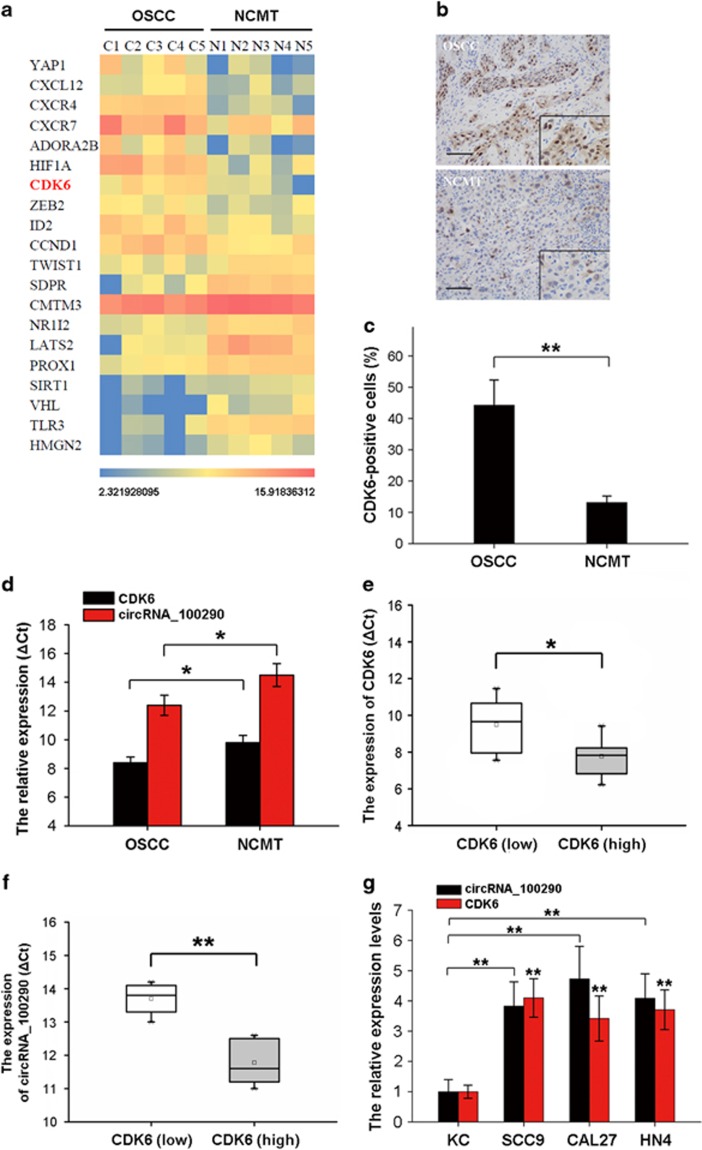
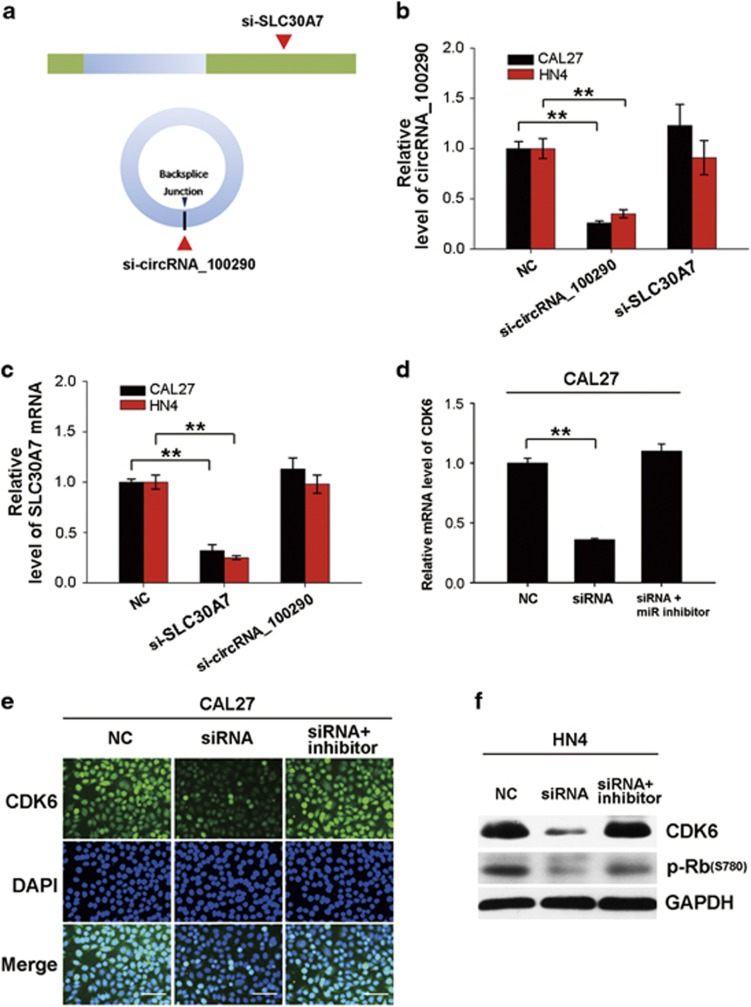
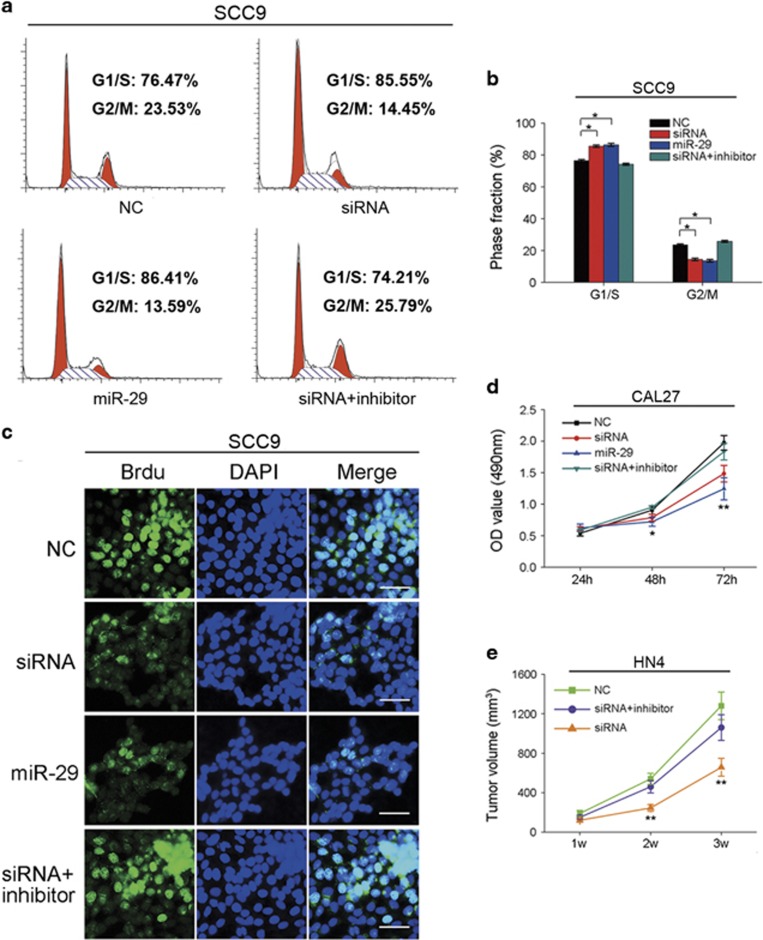
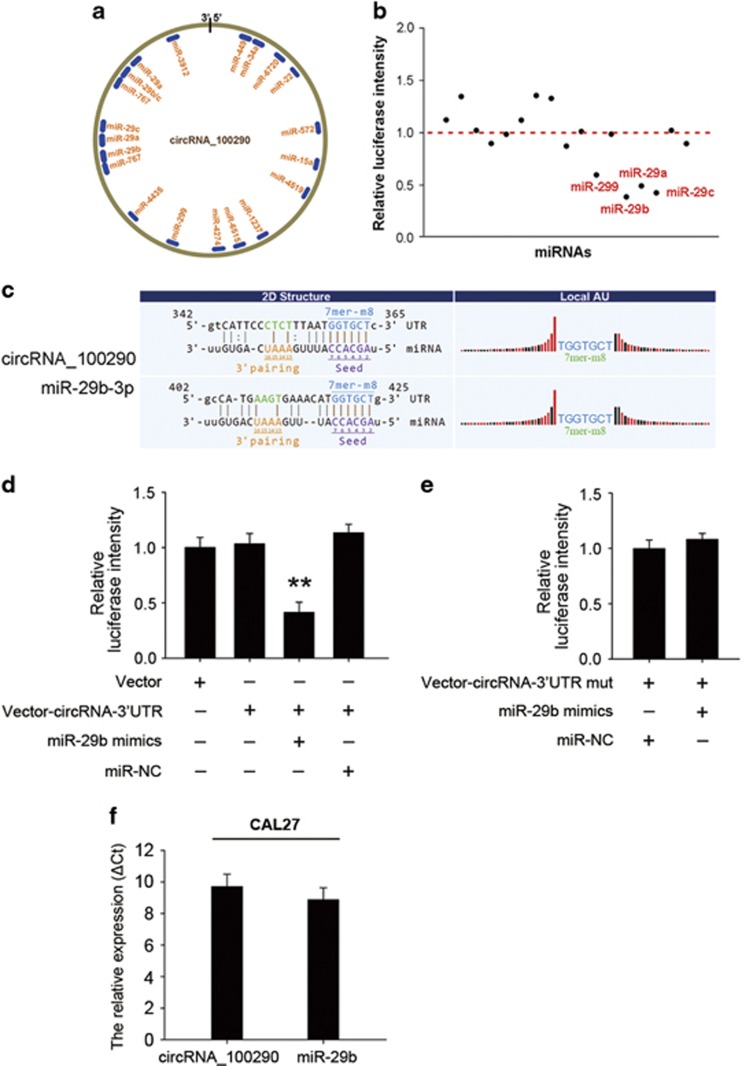
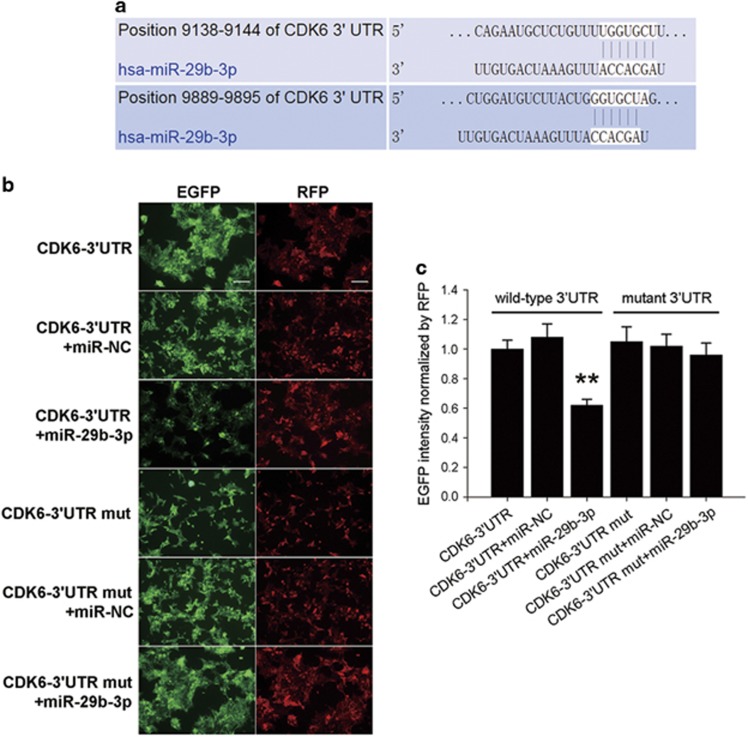
Circular RNAs (circRNAs) represent a class of non-coding RNAs that are widely expressed in mammals. However, it is largely unknown about the function of human circRNAs and the roles of circRNAs in human oral squamous cell carcinomas (OSCC). Here we performed a comprehensive study of circRNAs in human OSCC using circRNA and mRNA microarrays, and identified many circRNAs that are differentially expressed between OSCC tissue and paired non-cancerous matched tissue. We further found a circRNA termed circRNA_100290 that served as a critical regulator in OSCC development. We discovered that circRNA_100290 was upregulated and co-expressed with CDK6 in OSCC tissue. Knockdown of circRNA_100290 decreased expression of CDK6 and inhibited proliferation of OSCC cell lines in vitro and in vivo. Via luciferase reporter assays, circRNA_100290 was observed to directly bind to miR-29 family members. Further EGFP/RFP reporter assays showed that CDK6 was the direct target of miR-29b. Taken together, we conclude that circRNA_100290 may function as a competing endogenous RNA to regulate CDK6 expression through sponging up miR-29b family members. Taken together, it indicates that circRNAs may exert regulatory functions in OSCC and may be a potential target for OSCC therapy.


Conflict of interest statement

The authors declare no conflict of interest.

Figures

Figure 1
Figure 1
circRNA expression profile in OSCC. (a) The scatter plot was used for assessing the variation in circRNA expression between OSCC and NCMT samples. The values of x and y axes in the scatter plot were the normalized signal values of the samples (log2 scaled). The green lines are fold-change lines. The circRNAs above the top green line and below the bottom green line indicated more than 2.0-fold change of circRNAs between the two compared samples. (b) The volcano plot was constructed using fold-change values and P-values. The vertical lines correspond to 2.0-fold up and down, respectively, and the horizontal line represents a P-value of 0.05. The red point in the plot represents the differentially expressed circRNAs with statistical significance. (c) The cluster heat map showed the differentially expressed circRNAs over 2.5-fold change. Red colour indicates high expression level, and green colour indicates low expression level. The blue arrow indicates circRNA_100290. (d) The top 10 upregulated circRNAs and top 10 downregulated circRNAs. The expression of circRNA_100290 in OSCC was upregulated by nearly sevenfold.
Figure 2
Figure 2
ceRNA analysis for circRNA_100290. Cytoscape was used to visualize circRNA_100290-miRNA-target gene interactions based on the circRNA microarray and mRNA microarray data. In the network, 46 miRNAs that ranked relatively higher and 11 most possible target genes of these miRNAs were collected. The octagon represents circRNA_100290, the circle represents miRNAs and the round rectangle represents target genes of miRNAs (including mRNAs, lncRNAs and other transcripts). The relationship between the nodes was connected with solid lines. The enlarged and red marked solid lines show circRNA_100290-miR-29 family–CDK6 interactions.
Figure 3
Figure 3
circRNA_100290 and CDK6 are upregulated in OSCC. (a) The cluster heat map showed some of the differentially expressed mRNAs over twofold change between OSCC and NCMT samples. Red colour indicates high expression level, and blue colour indicates low expression level. The expression of CDK6 in OSCC tissue was over three times the level of that in NCMT. (b) Immunochemistry staining showed that the number of CDK6-positive cells in OSCC was much higher than that of NCMT. Scale bar, 200 μm. (c) The percentage of CDK6-positive cells in OSCC and NCMT. The presented values are the means±s.d. from five different visions under 400 times magnification, **P<0.01. (d) The expression levels of circRNA_100290 and CDK6 were analysed using qPCR. ΔCt values were used to measure gene expression, which was normalized according to GAPDH expression levels. The presented values are the means±s.d., *P<0.05. (e) Expression levels of CDK6 in 17 OSCC samples were detected by qPCR. According to the CDK6 expression levels, the samples were sorted into a low CDK6 expression group (n=7) and a high CDK6 expression group (n=10), *P<0.05. (f) Expression levels of circRNA_100290 in the ‘CDK6 high’ and ‘CDK6 low’ subsets, **P<0.01. (g) Expression levels of circRNA_100290 and CDK6 in several OSCC cell lines such as SCC9, CAL27 and NH4, **P<0.01. All the data were presented as means±s.d.
Figure 4
Figure 4
Knockdown of circRNA_100290 inhibits expression of CDK6. (a) Schematic model of the siRNAs. si-SLC30A7 targets the SLC30A7 linear transcript, si-circRNA_100290 targets the back-splice junction of circRNA_100290. (b) and (c) si-circRNA_100290 knocked down only the circular transcript and did not affect the expression of linear species. si-SLC30A7 knocked down only the SLC30A7 linear transcript but not the circular transcript. NC, negative control. (d) The expression levels of CDK6 were detected following knockdown of circRNA_100290 using si-circRNA_100290 or co-transfection with si-circRNA_100290 and the miR-29 inhibitor. (e) Immunofluorescence staining for CDK6 after transfection with si-circRNA_100290 or co-transfection with si-circRNA_100290 and the miR-29 inhibitor. Scale bar, 100 μm. (f) CDK6 protein expression levels were analysed by western blotting. GAPDH was used as a loading control. The presented values are the means±s.d. of three different preparations, **P<0.01.
Figure 5
Figure 5
Effects of circRNA_100290 on cell cycle and cell proliferation. (a, b) Cell cycle was analysed using flow cytometry after transfection with siRNA of circRNA_100290, miR-29 mimics or co-transfection with siRNA and the miR-29 inhibitor. Knockdown of circRNA_100290 induced G1/S arrest. This is the representative result derived from three independent experiments, *P<0.05. (c) Fluorescence due to BrdU incorporation. Scale bar, 100 μm. (d) MTT assay was also performed to assess cell proliferation, *P<0.05 and **P<0.01. (e) In vivo models in nude mice. Tumour volume was monitored once a week for 3 weeks. The average values±s.d. of three separate experiments are plotted, **P<0.01.
Figure 6
Figure 6
circRNA_100290 serves as a sponge for the miR-29 family. (a) A schematic model showing the putative binding sites for miRNAs and 3′UTR of circRNA_100290. (b) Luciferase reporter assay revealed that miR-29b, miR-29a, miR-29c and miR-299 were able to reduce the luciferase intensity more than 40%. (c) Binding sites of miR-29b in 3′UTR of circRNA_100290. (d, e) miR-29b or negative control oligonucleotide was co-transfected with pmiR-RB-Report vector with or without the 3′UTR sequence of circRNA_100290. The RLU of hRluc and hLuc+ were determined, and the hRluc values were normalized to the corresponding hLuc+ values, **P<0.01. (f) The relative expression levels of circRNA_100290 and miR-29b in CAL27 cell lines. ΔCt values were used to measure gene expression, which was normalized by GAPDH expression levels. The presented values are the means±SD.
Figure 7
Figure 7
CDK6 is directly targeted by miR-29b. (a) A sequence within the CDK6 mRNA that is complementary to miR-29b was identified using publicly available algorithms. (b) 293T cells were co-transfected with an EGFP reporter plasmid (containing 3′UTR of CDK6) or the mutant vector (containing mutant 3′UTR of CDK6) and the pDsRed-C1 plasmid, either alone or in combination with a miR-29b mimic. Forty-eight hours post-transfection, EGFP and RFP levels were measured using an F-4500 fluorescence spectrophotometer. Scale bar, 50 μm. (c) Histograms show normalized means±s.d. of fluorescence intensity from three independent experiments. The fluorescence value in the control group was set to 1, **P<0.01.

References

    1. Leemans CR, Braakhuis BJM, Brakenhoff RH. The molecular biology of head and neck cancer. Nat Rev Cancer 2010; 11: 9–22. - PubMed
    1. Siegel R, Ward E, Brawley O, Jemal A. Cancer statistics, 2011: the impact of eliminating socioeconomic and racial disparities on premature cancer deaths. CA Cancer J Clin 2011; 61: 212–236. - PubMed
    1. Beenken SW, Urist MMHead and neck tumors. In: Way LW, Doherty GM (eds). Current Surgical Diagnosis and Treatment. 11th edn. Lange Medical Books/McGraw-Hill: New York, 2003, pp 282–297.
    1. La Vecchia C, Lucchini F, Negri E, Levi F. Trends in oral cancer mortality in Europe. Oral Oncol 2004; 40: 433–439. - PubMed
    1. Massano J, Regateiro FS, Januário G, Ferreira A. Oral squamous cell carcinoma: Review of prognostic and predictive factors. Oral Surg Oral Med Oral Pathol Oral Radiol Endod 2006; 102: 67–76. - PubMed

Publication types

MeSH terms