. 2017 Aug 10;36(32):4641-4652.
doi: 10.1038/onc.2017.91. Epub 2017 Apr 3.

Noncanonical GLI1 signaling promotes stemness features and in vivo growth in lung adenocarcinoma

Affiliations

Noncanonical GLI1 signaling promotes stemness features and in vivo growth in lung adenocarcinoma

A Po et al. Oncogene. .

Abstract

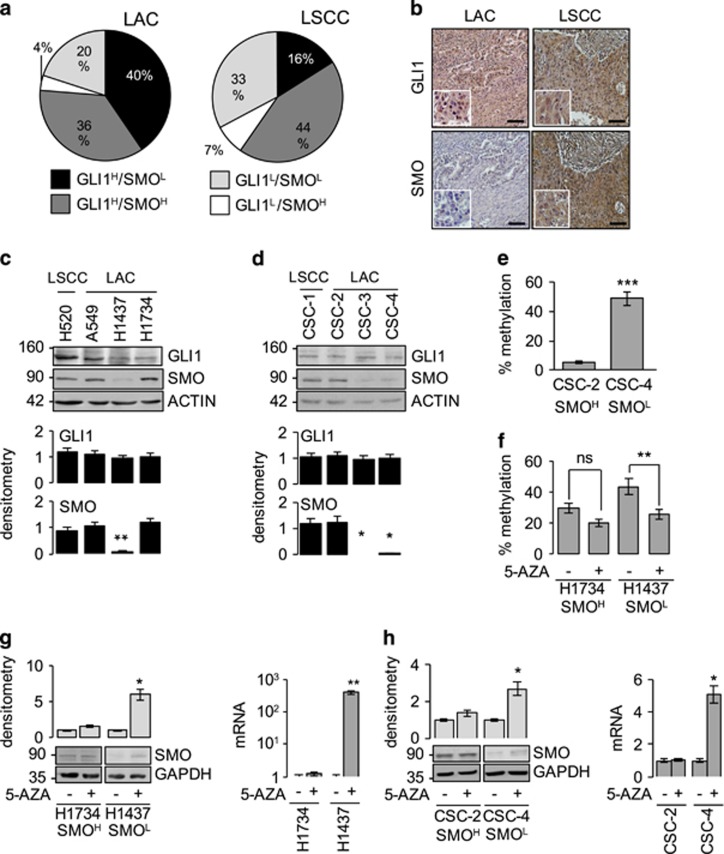
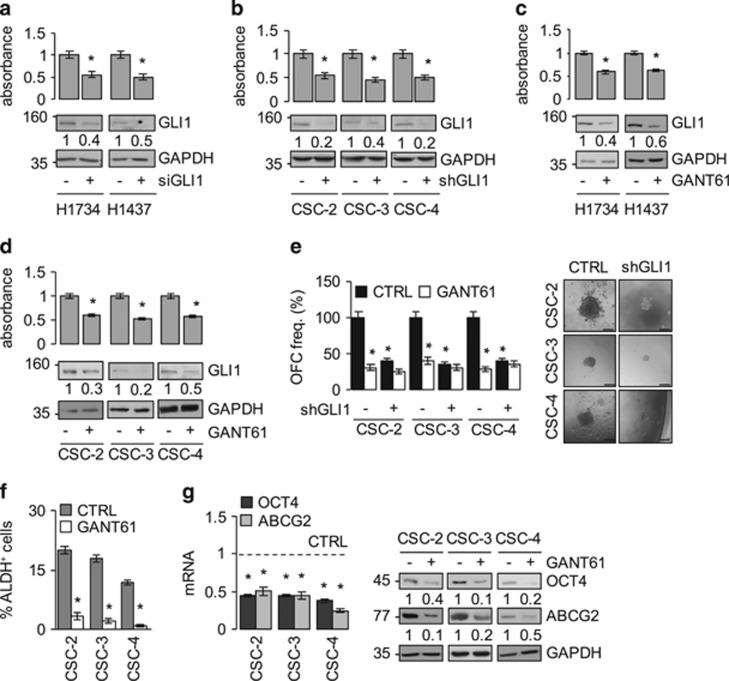
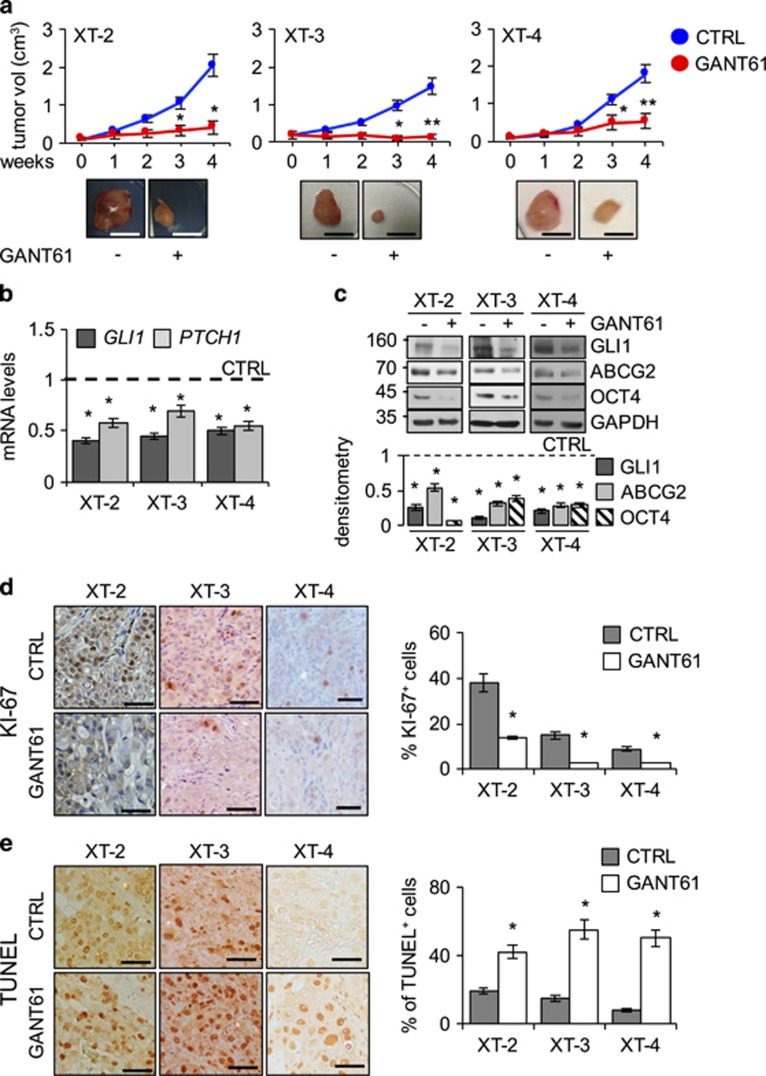
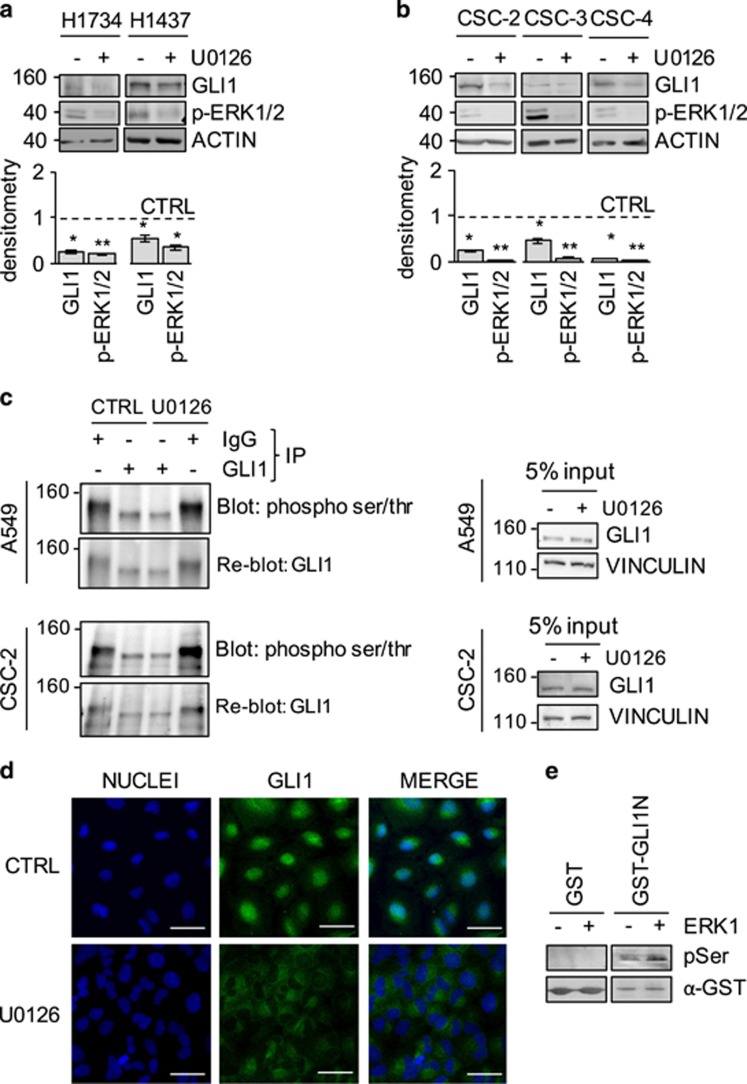
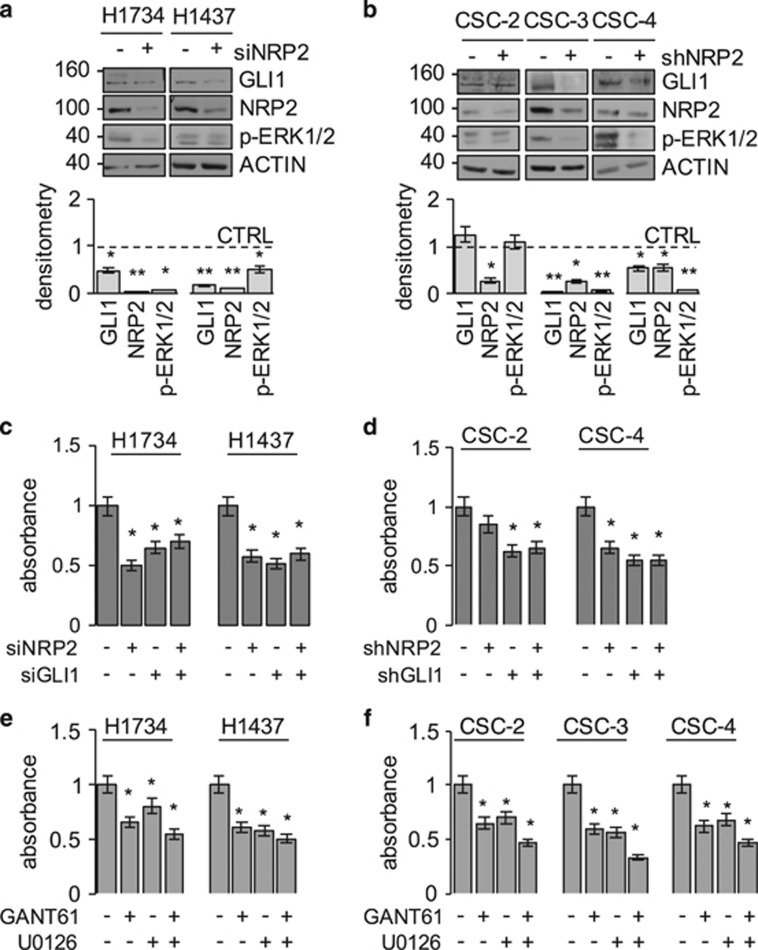
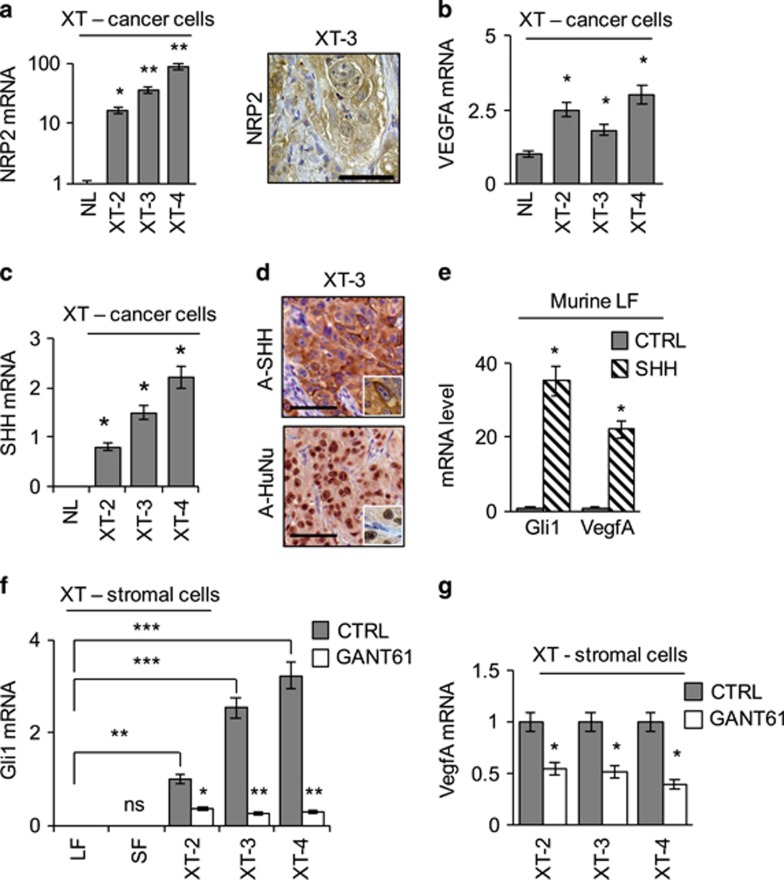
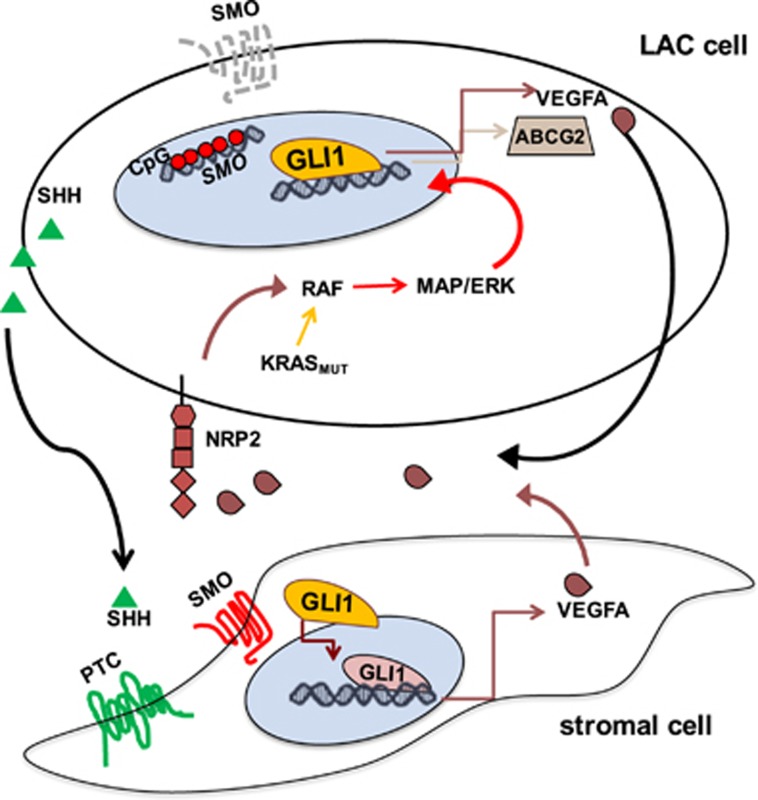
Aberrant Hedgehog/GLI signaling has been implicated in a diverse spectrum of human cancers, but its role in lung adenocarcinoma (LAC) is still under debate. We show that the downstream effector of the Hedgehog pathway, GLI1, is expressed in 76% of LACs, but in roughly half of these tumors, the canonical pathway activator, Smoothened, is expressed at low levels, possibly owing to epigenetic silencing. In LAC cells including the cancer stem cell compartment, we show that GLI1 is activated noncanonically by MAPK/ERK signaling. Different mechanisms can trigger the MAPK/ERK/GLI1 cascade including KRAS mutation and stimulation of NRP2 by VEGF produced by the cancer cells themselves in an autocrine loop or by stromal cells as paracrine cross talk. Suppression of GLI1, by silencing or drug-mediated, inhibits LAC cells proliferation, attenuates their stemness and increases their susceptibility to apoptosis in vitro and in vivo. These findings provide insight into the growth of LACs and point to GLI1 as a downstream effector for oncogenic pathways. Thus, strategies involving direct inhibition of GLI1 may be useful in the treatment of LACs.


Conflict of interest statement

The authors declare no conflict of interest.

Figures

Figure 1
Figure 1
HH–GLI pathway components in NCSLC. (a, b) IHC of SMO and GLI1 protein expression in human NSCLC tissue arrays (216 LACs, 291 LSCCs): (a) distribution of SMO/GLI1 phenotypes and (b) representative images of GLI1 and SMO staining. The LSCC sample in (b) is positive (H-score >50/300) for both proteins; the LAC displays only GLI1 positivity. Magnification × 20, inset × 40. Scale bar: 50 μm. (c, d) Western blots showing basal SMO and GLI1 protein expression in (c) commercial cell lines and (d) patient-derived CSCs from LSCC and LAC (see Supplementary Table S1 for cell genotypes). Bar graphs show densitometrically quantified band intensity values (n=3 or more) normalized to actin (loading control, LC). Asterisks show differences vs cell line with highest SMO expression. (e, f) Methylation levels in the proximal SMO regulatory region in (e) untreated LAC CSC lines and (f) commercial LAC cell lines before and after 5-AZA treatment. Cell lines are classified as SMOhigh (SMOH) or SMOlow (SMOL) based on findings shown in panels c and d. (g, h) Effect of 5-AZA-mediated demethylation on SMO expression (mRNA and protein) in (g) commercial LAC cell lines and (h) patient-derived LAC CSC lines. The mRNA level in each treated sample was calibrated against the corresponding basal level. LC: GAPDH. Bar graphs: densitometric analyses. *P<0.05; **P<0.01; ***P<0.001
Figure 2
Figure 2
GLI1 inhibition diminishes proliferation and stemness in LAC cells. (ad) LAC cells viability is diminished by GLI1 knockdown in (a) commercial cell lines (siRNA-mediated) and (b) patient-derived CSCs (shRNA-mediated); similar reductions are seen in (c) cell lines and (d) CSCs treated for 48 h with the GLI1 antagonist GANT61 or DMSO (−). Bar graphs show viability (MTS assay); immunoblots show endogenous GLI1 protein levels. LC: GAPDH. Numbers below blots indicate densitometrically quantified protein expression. (e) Effects of GANT61 on oncosphere formation in LAC CSC lines before and after transduction with shGLI1. Bar graphs: frequencies of oncosphere-forming cells (OFC, % of seeded cells that formed oncospheres) under indicated experimental conditions are normalized to the frequency observed in shSCRAMBLE-infected cells treated with DMSO alone (controls, CTRL, expressed as 100%). Photomicrographs: Representative images of oncospheres observed in DMSO-treated CSCs infected with shGLI1 or shSCRAMBLE (CTRL). Scale bar: 50 μm. (f) Percentage of CSCs exhibiting high ALDH activity (ALDH+ cells) after GANT61 or CTRL treatment (AldeFluor assay). (g) Expression (mRNA and protein) of stem cell markers OCT4 and ABCG2 in GANT61- and CTRL-treated (dashed line) CSCs. LC: GAPDH. *P< 0.05. ALDH, aldehyde dehydrogenase.
Figure 3
Figure 3
GLI1 inhibition produces antitumor effects in LAC CSC-derived XTs. (a) Up: growth of XTs generated in mice by s.c. flank injections of LAC CSC-2 (XT-2), CSC-3 (XT-3) and CSC-4 (XT-4). Results are shown for 4 weeks of treatment with i.p. GANT61 or vehicle (CTRL). Bottom: representative image of XTs after vehicle treatment of mice or after GANT61 treatment. Scale bar: 1 cm. (b) Human GLI1 and PTCH1 mRNA levels in XTs from GANT61-treated and CTRL (dashed line) mice. (c) GANT61’s effects on endogenous GLI1, ABCG2 and OCT4 protein expression in XTs. Bar graphs: densitometric analyses (see Supplementary Figure S3b for OCT4 IHC). (d, e) XT sections from GANT61-treated and CTRL mice were (d) immunostained for the proliferation marker KI-67 and (e) subjected to TUNEL assay for apoptosis. Representative results are shown (magnification: × 20; scale bar: 50 μm) with percentages of labeled cells (bar graphs on the right). Results are means±s.d. (n= 3). *P<0.05, **P<0.01 versus CTRLs.
Figure 4
Figure 4
MEK/ERK1/2 pathway regulates GLI1 phosphorylation. (a, b) Western blot analysis of endogenous levels of GLI1, phosphorylated ERK1/2 (p-ERK1/2) and actin (LC) in commercial LAC cell lines (H1734, H1437) and CSCs 2, 3, 4 after 48 h U0126 treatments. Bar graphs: densitometric analyses. Dashed line: CTRL treatment. *P<0.05; **P<0.01. (c) A549 and CSC-2 treated with U0126 for 4 h were lysed and subjected to (left) IP—western blot assay to assess endogenous levels of phosphorylated GLI1 (p-GLI1). Right: WB analysis of input of samples subjected to IP. (d) Immunofluorescence assay of endogenous GLI1 expression in A549 after 12 h of U0126 treatment. Nuclei are counterstained with Hoechst. Scale bars: 10 μm. (e) In vitro kinase assay. Recombinant GST-GLI1N (fragment 2-234) or GST were incubated with or without recombinant ERK1 for 20 min. Phosphorylation was revealed by PAN anti-pSer immunoblot. Total levels of GST and GST-GLI1N, revealed by α-GST immunoblot, are shown.
Figure 5
Figure 5
Noncanonical activation of GLI1 in LAC cells. (a, b) Western blots of endogenous protein levels of NRP2, GLI1 and P-ERK1/2 and actin (LC) in commercial LAC cell lines (H1734, H1437) and CSCs 2, 3, 4 after siRNA-mediated (a) or short-hairpin-mediated (b) silencing of NRP2. Bar graphs: densitometric analyses. Dashed line: CTRL treatment. (cf) Cell viability (MTS assay) in (c) LAC cell lines after siRNA silencing of NRP2, GLI1 and both; in (d) CSCs after short-hairpin mediated silencing of NRP2, GLI1 and both; and in (e) in LAC cell lines and (f) LAC CSCs treated for 48 h with GANT61, U0126 or both. *P<0.05, **P<0.01 vs sham-treated/sham-transfected controls.
Figure 6
Figure 6
Autocrine GLI1 activation and paracrine HH–GLI signaling in LAC. (a, b) Cancer-cell component of XTs: basal mRNA levels of (a) human NRP2 and (b) VEGFA vs levels in commercial normal human lung tissue (NL). Panel (a) shows IHC analysis of NRP2 expression in XT-3. Magnification: × 20, scale bar: 50 μm. (c) Human SHH mRNA levels in the cancer-cell component of XTs 2, 3 and 4 and normal human lung tissue (NL). (d) Representative IHC images of SHH and human nuclei (HuNu) staining in paraffin-embedded section of XT-3. Magnification: × 20, scale bar: 50 μm. (e) Relative expression of Gli1 and VegfA mRNA in normal murine lung fibroblasts (LF) treated for 24 h with recombinant murine Shh or BSA alone (CTRL). Results are reported as means±s.d. (n=4). (f, g) Stromal component of XTs 2–4 samples from GANT61-treated and CTRL mice: mRNA levels of murine (f) Gli1 and (g) VegfA. Gli1 levels are expressed vs normal murine LFs. Values in ad and fg are means±s.d. from four or more tumors. *P<0.05, **P<0.01, ***P>0.001.
Figure 7
Figure 7
Noncanonical GLI1 signaling sustaining LAC growth and CSC maintenance. The HH pathway effector GLI1 can be activated even in the absence of SMO, the canonical upstream activator of HH signaling, whose expression is epigenetically silenced in many GLI1-expressing LACs. GLI1 serves as a downstream effector of oncogenic MAPK/ERK signaling, which can be triggered by ligand-binding events at NRP2 receptors expressed by the cancer cells. GLI1 then promotes features involved in tumor growth and CSC maintenance, including the transcription of known HH target genes (for example, ABCG2 and VEGFA). The VEGFA that binds epithelial-cell NRP2 receptors is secreted by the epithelial cells themselves, and this autocrine signaling loop is self-amplified by GLI1-upregulated transcription of both the receptor (NRP2) and its ligand (VEGFA). NRP2/ERK/GLI signaling can also be activated in a paracrine fashion by VEGFA secreted by cells in the tumor stroma. The stromal VEGFA production is the result of canonical SMO-dependent HH–GLI signaling triggered by SHH secreted by epithelial cells. The output of this stromal signaling includes VEGFA, which in turn bind tumor-cell NRP2, thereby triggering the noncanonical MAPK/ERK-mediated GLI1 activation illustrated in the upper panel.

Similar articles

Cited by

References

    1. Lee RTH, Zhao Z, Ingham PW. Hedgehog signalling. Development 2016; 143: 367–372. - PubMed
    1. Varjosalo M, Taipale J. Hedgehog: functions and mechanisms. Genes Dev 2008; 22: 2454–2472. - PubMed
    1. Katoh Y, Katoh M. Hedgehog target genes: mechanisms of carcinogenesis induced by aberrant hedgehog signaling activation. Curr Mol Med 2009; 9: 873–886. - PubMed
    1. Kinzler KW, Bigner SH, Bigner DD, Trent JM, Law ML, O'Brien SJ et al. Identification of an amplified, highly expressed gene in a human glioma. Science 1987; 236: 70–73. - PubMed
    1. Snijders AM, Schmidt BL, Fridlyand J, Dekker N, Pinkel D, Jordan RC et al. Rare amplicons implicate frequent deregulation of cell fate specification pathways in oral squamous cell carcinoma. Oncogene 2005; 24: 4232–4242. - PubMed

MeSH terms