. 2017 May;49(5):806-810.
doi: 10.1038/ng.3831. Epub 2017 Apr 3.

Estimating the selective effects of heterozygous protein-truncating variants from human exome data

Affiliations

Estimating the selective effects of heterozygous protein-truncating variants from human exome data

Christopher A Cassa et al. Nat Genet. 2017 May.

Abstract

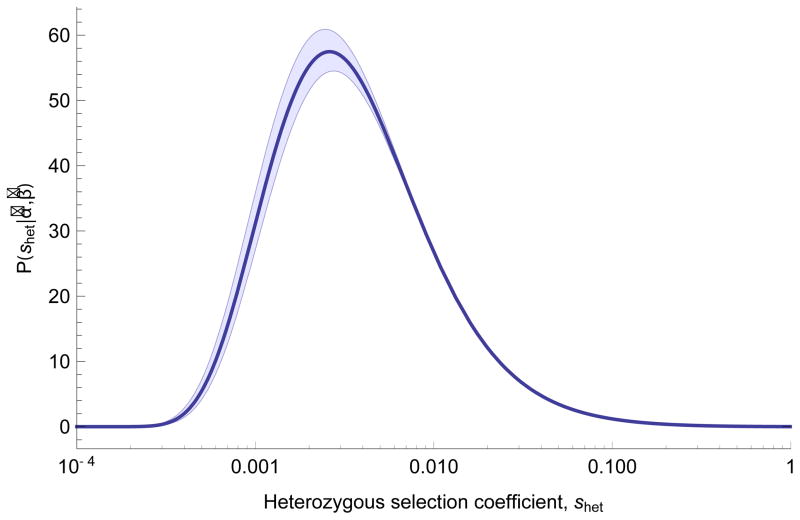
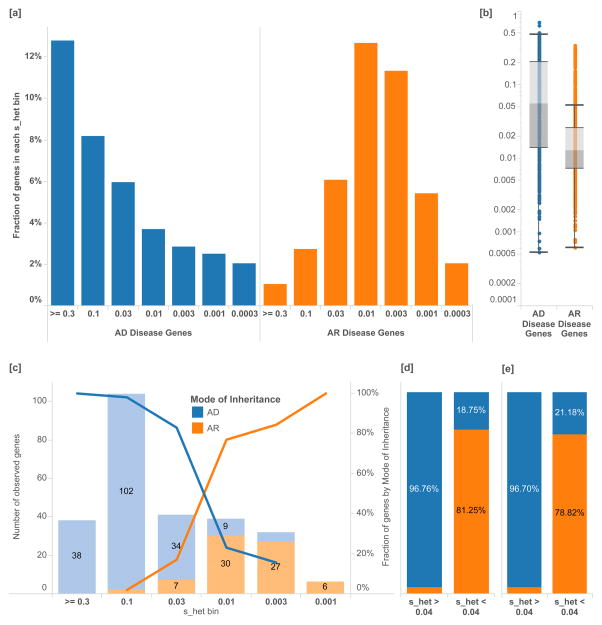
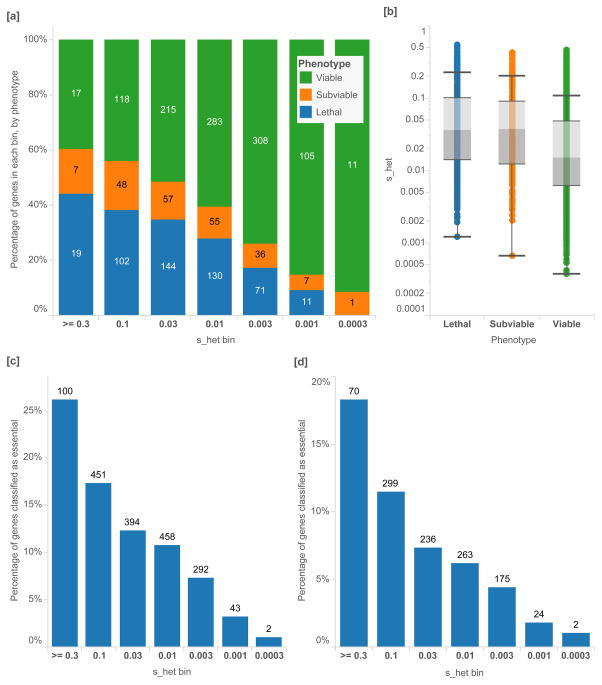
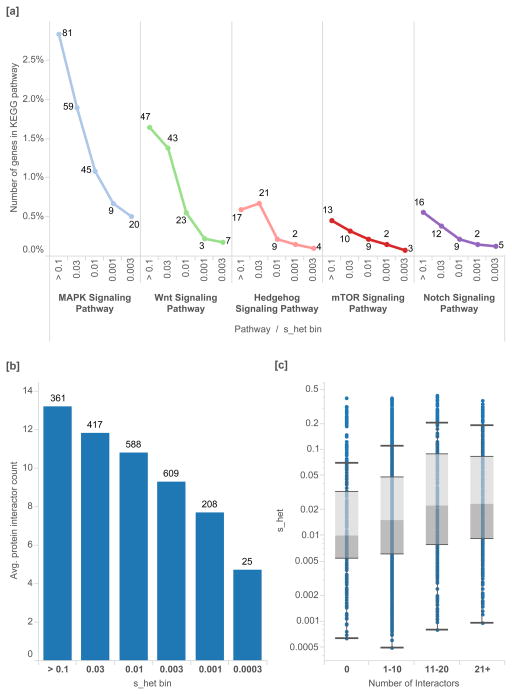
The evolutionary cost of gene loss is a central question in genetics and has been investigated in model organisms and human cell lines. In humans, tolerance of the loss of one or both functional copies of a gene is related to the gene's causal role in disease. However, estimates of the selection and dominance coefficients in humans have been elusive. Here we analyze exome sequence data from 60,706 individuals to make genome-wide estimates of selection against heterozygous loss of gene function. Using this distribution of selection coefficients for heterozygous protein-truncating variants (PTVs), we provide corresponding Bayesian estimates for individual genes. We find that genes under the strongest selection are enriched in embryonic lethal mouse knockouts, Mendelian disease-associated genes, and regulators of transcription. Screening by essentiality, we find a large set of genes under strong selection that are likely to have crucial functions but have not yet been thoroughly characterized.


Conflict of interest statement

Competing Financial Interests Statement

The authors have no competing interests as defined by Springer Nature, or other interests that might be perceived to influence the results and/or discussion reported in this paper.

Figures

Figure 1
Figure 1
Inferred distribution of fitness effects for heterozygous loss of gene function. Estimates of parameters (α̂, β̂) from maximum likelihood fit to the observed distribution of PTV counts across 15,998 genes in terciles of mutation rate, assuming shet ~ IG(α, β). Shaded areas show 95% CI obtained from 100 bootstrapping replicates, intended to quantify the influence of sampling noise in the data set on parameter inference, with fixed estimates of local mutation rate.
Figure 2
Figure 2
Separation of disease genes and clinical cases by mode of inheritance. [a] The percentage of genes associated with exclusively autosomal dominant (AD, N=867) disorders versus autosomal recessive (AR, N=1,482) disorders as annotated by the Clinical Genomics Database (CGD) in each shet bin. Logarithmic bins are ordered from greatest to smallest shet values. [b] Overall, AD genes have significantly higher shet values than AR genes [Mann-Whitney U p-value 3.14×10−64]. [c] Similarly, in solved Mendelian clinical exome sequencing cases (Baylor), shet values can help discriminate between AR and AD disease genes, as annotated by clinical geneticists. [d] A shet value of 0.04 can be used as a simple classification threshold for AD genes with a PPV of 96%. [e] This finding is replicated in a separately ascertained sample from UCLA. Box plots range from 25th–75th percentile values and whiskers include 1.5 times the interquartile range.
Figure 3
Figure 3
Enrichments of shet in known haploinsufficient disease genes of high confidence (ClinGen Dosage Sensitivity Project). In (N=127) autosomal genes, we annotate the shet scores of genes associated with each disease category and classification. Higher shet values are associated with [a] earlier age of onset (Mann-Whitney U p=1.46 ×10⁻²), [b] a larger fraction of de novo variants (p=8×10⁻⁵), [c] high or unspecified penetrance (p=1.79 ×10⁻²) and [d] increased phenotypic severity (p=4.87×10⁻³). Box plots range from 25th–75th percentile values and whiskers include 1.5 times the interquartile range. [e] Genes with the 10% highest shet values are also similarly enriched with more severe clinical annotations.
Figure 4
Figure 4
Distribution of shet values for phenotypes in known disease genes and clinical cases. We plot the distribution of selective effects for different disorder groups, providing information about the breadth and severity of selection associated with each group. [a] We include known Mendelian disease genes (Clinical Genomic Database) annotated as either Autosomal Recessive or Autosomal Dominant and [b] clinical exome sequencing cases. We contrast these with [c] all tolerated knockouts in a consanguineous cohort (PROMIS) and [d] the distribution of selective effects in all scored genes. Logarithmic bins are ordered from greatest to smallest shet values.
Figure 5
Figure 5
High-throughput screens of gene essentiality in mice and cell assays, as a percentage of all genes in each shet bin. [a] Proportion of orthologous mouse knockout genes by phenotype, from a neutrally-ascertained set of genes generated by the International Mouse Phenotyping Consortium (IMCP). Logarithmic bins are ordered from greatest to smallest shet values. [b] ICMP mice are separated into viable (N=1,057), sub-viable (N=211) and lethal knockouts (N=477), and lethal knockouts have significantly higher shet values than viable [Mann-Whitney U p-value 2.95×10⁻²⁸]. [c] Cell-essential genes as reported by Wang et al. from genome-wide KBM-7 tumor cell CRISPR assay (N=1,740) have significantly higher shet values [p-value 5.13×10⁻¹⁶] [d] as do genes that were characterized as essential in a gene trap assay (N= 1,081) [p-value = 4.90×10⁻¹⁸]. In the CRISPR assay, all genes with adjusted p-values < 0.05 and negative assay scores are included, and genes with gene trap scores < 0.4 or lower are included. Box plots range from 25th–75th percentile values and whiskers include 1.5 times the interquartile range.
Figure 6
Figure 6
Protein pathways and protein-protein interactions, as a percentage of the associated developmental genes in each shet bin. [a] In key developmental pathways in KEGG, we find that genes with higher shet values are enriched in genes important to development. [b] We plot the distribution of the number of protein-protein interactions for each gene, as determined by a genome-wide mass spectrometry assay versus shet value. [c] We find that shet values are positively correlated with the number of observed interactors for each gene. Box plots range from 25th–75th percentile values and whiskers include 1.5 times the interquartile range.

Comment in

Similar articles

Cited by

References

    1. Mukai T, Chigusa SI, Mettler LE, Crow JF. Mutation rate and dominance of genes affecting viability in Drosophila melanogaster. Genetics. 1972;72:335–55. - PMC - PubMed
    1. Deng HW, Lynch M. Estimation of deleterious-mutation parameters in natural populations. Genetics. 1996;144:349–360. - PMC - PubMed
    1. Wang T, et al. Identification and characterization of essential genes in the human genome. Science (80- ) 2015;350:1096–1101. - PMC - PubMed
    1. Williamson SH, et al. Simultaneous inference of selection and population growth from patterns of variation in the human genome. Proc Natl Acad Sci U S A. 2005;102:7882–7. - PMC - PubMed
    1. Boyko AR, et al. Assessing the evolutionary impact of amino acid mutations in the human genome. PLoS Genet. 2008;4:e1000083. - PMC - PubMed

LinkOut - more resources