. 2017 May;49(5):742-752.
doi: 10.1038/ng.3833. Epub 2017 Apr 3.

Chromatin-remodeling factor SMARCD2 regulates transcriptional networks controlling differentiation of neutrophil granulocytes

Affiliations

Chromatin-remodeling factor SMARCD2 regulates transcriptional networks controlling differentiation of neutrophil granulocytes

Maximilian Witzel et al. Nat Genet. 2017 May.

Abstract

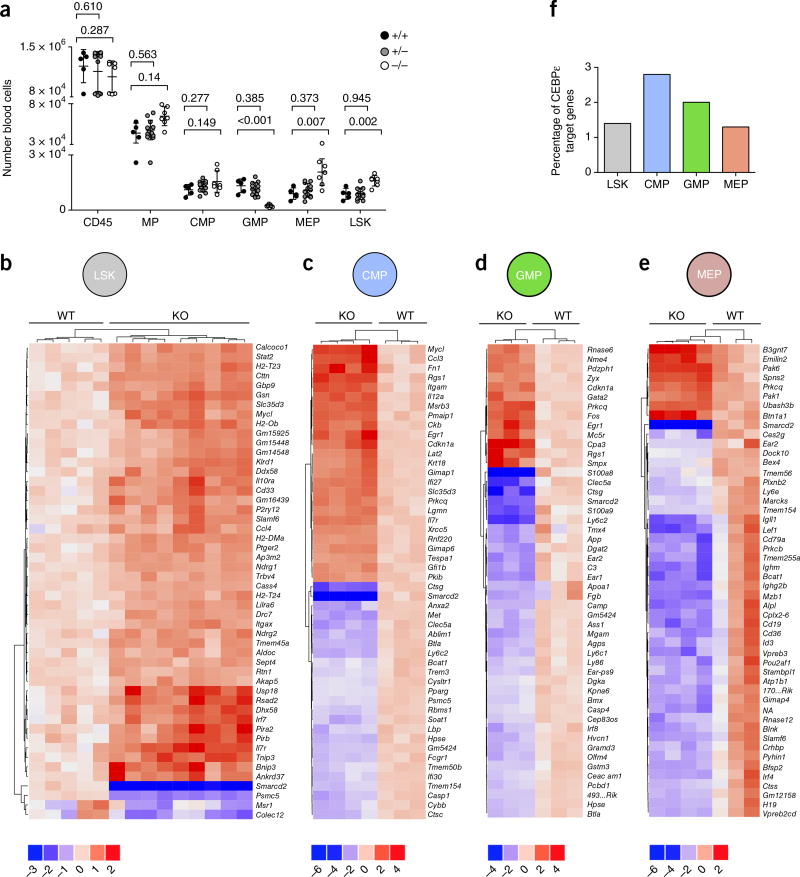
We identify SMARCD2 (SWI/SNF-related, matrix-associated, actin-dependent regulator of chromatin, subfamily D, member 2), also known as BAF60b (BRG1/Brahma-associated factor 60b), as a critical regulator of myeloid differentiation in humans, mice, and zebrafish. Studying patients from three unrelated pedigrees characterized by neutropenia, specific granule deficiency, myelodysplasia with excess of blast cells, and various developmental aberrations, we identified three homozygous loss-of-function mutations in SMARCD2. Using mice and zebrafish as model systems, we showed that SMARCD2 controls early steps in the differentiation of myeloid-erythroid progenitor cells. In vitro, SMARCD2 interacts with the transcription factor CEBPɛ and controls expression of neutrophil proteins stored in specific granules. Defective expression of SMARCD2 leads to transcriptional and chromatin changes in acute myeloid leukemia (AML) human promyelocytic cells. In summary, SMARCD2 is a key factor controlling myelopoiesis and is a potential tumor suppressor in leukemia.


Figures

Figure 1
Figure 1
Syndromic features in SMARCD2 deficiency. (a–e) The phenotype of patient AII.1 includes low-set ears, posteriorly rotated, with prominent concha, hypoplastic mandibula, saddle nose, midface hypoplasia, synophris, and asymmetric face (ear to ear) (a), misaligned, dysplastic teeth and incomplete amelogenesis imperfecta (filled arrowheads) (b), brachytelephalangy (unfilled arrowheads) and longitudinal ridges on finger nails (c), sandal gap/increased interdigital space D1–D2 (asterisk), brachymetatarsy D4 (filled arrowhead), and brittle nails (d), and severe osteopenia with relative constriction of diaphysis and flaring of metaphysis (Erlenmeyer deformity) (e). Images have been partially cropped; please compare to Supplementary Table 18. Patients or their parents gave informed consent for publication of their photographs.
Figure 2
Figure 2
Bone marrow and peripheral blood cell analysis. (a–c) Healthy donor. (a) Regular maturation of hematopoietic lineages and no blast cell excess. Inset, magnification (bone marrow histology; hematoxylin and eosin). (b) Segmented neutrophil granulocytes (peripheral blood cytology; Giemsa). (c) Red and white blood cell maturation (bone marrow cytology; Giemsa). (d–f) AII.1. (d) Diffuse and compact blast cell infiltration with absence of megakaryocytes and erythroid islands. Inset, immature neutrophilic cells (bone marrow histology; hematoxylin and eosin). (e) Atypical neutrophilic cells with hypogranulated cytoplasm, hyposegmented nuclei, and pseudo-Pelger–Huët anomaly (PPHA) (black arrowhead) (peripheral blood cytology; Giemsa). (f) Left-shifted neutrophilic granulopoiesis, blast cells, and PPHA (black arrowheads) (under G-CSF) (peripheral blood cytology; Giemsa). (g–i) BII.1 and BII.2. (g) Hypercellularity with (sub)total adipocyte depletion and normal erythroid precursors. Diffuse infiltration by blast cells and starry sky pattern with disseminated activated macrophages (unfilled arrowheads). Inset, immature neutrophilic cells (bone marrow histology from BII.2; hematoxylin and eosin). (h) Circulating atypical neutrophil cells and PPHA (black arrowhead) (BII.1 peripheral blood cytology; Giemsa). (i) Left-shifted atypical neutrophilic granulopoiesis with increase of blast cells. PPHA (black arrowhead) and atypical neutrophils (unfilled arrowhead) (BII.1 bone marrow cytology; Giemsa). (j–l) CII.1. (j) Marked hypercellularity with (sub)total adipocyte depletion and normal erythrocytes. Diffuse and compact infiltration by blast cells and scattered activated macrophages (unfilled arrowheads). Inset, pleomorphic blast cells with round nuclei and small nucleoli (black arrowheads) (bone marrow histology; hematoxylin and eosin). (k) Glycophorin C staining shows erythropoietic islands (unfilled arrowheads) and blast infiltration (asterisks). (l) CD61 staining shows loosely scattered, small and immature megakaryocytes (micromegakaryocytes) (bone marrow histology; hematoxylin and eosin). Images have been cropped; see also Supplementary Table 18. Scale bars, approximately 20 µm.
Figure 3
Figure 3
Identification of biallelic loss-of-function mutations in SMARCD2. (a–c) Pedigrees and Sanger sequencing chromatograms for patient (Pat) as compared to reference (Ref) sequences and specification of homozygous mutations (Mut). In a, the reverse read is shown for patient AII.1. (d) Immunoblot showing absence of SMARCD2 protein expression (molecular weight, 58.9 kDa; arrowhead) in fibroblasts (healthy donor 1 (HD1), healthy donor 2 (HD2), patients AII.1 and BII.1) and in Epstein–Barr virus (EBV)-transformed B cell lines (healthy donor (HD), patient CII.1). Images have been cropped; please compare to Supplementary Data 1. Replicates: 2. (e) SMARCD2 mRNA transcripts detected in patient-derived cells; ORFs are shown in black. Healthy donor (HD) transcript ENST00000448276; NM_001098426.1; CCDS45756 is shown in comparison to transcripts in patients AII.1 (a, p.Ile362Cysfs*2; b, p.Ser394Argfs*1; c, p.Ile362Valfs*85), BII.1 (p.Gln147Glufs*4), and CII.1 (p.Arg73Valfs*8). Replicates: 2. (f) Immunoprecipitation showing defective binding of patient-specific mutated SMARCD2 proteins to the SWI/SNF core complex components BRG1, BAF170, BAF155, and BAF47. FLAG-tagged SMARCD2 proteins (wild type and mutant), expressed in 293T cells, were immunoprecipitated using antibody to FLAG. Coimmunoprecipitation of endogenous SWI/SNF complex components was visualized by immunoblotting of input and immunoprecipitated (IP) samples. Exposure of the membrane analyzed for FLAG shows the presence of immunoprecipitated wild-type SMARCD2, SMARCD2-AII.1a, SMARCD2-AII.1b, SMARCD2-BII.1, and SMARCD2-CII.1 proteins. Images have been cropped; please compare to Supplementary Data 2. Replicates: 3 Please also see Supplementary Table 20 and the Supplementary Note.
Figure 4
Figure 4
Smarcd2 deficiency in zebrafish. (a) Neutrophil numbers in Tg(lyz:dsRed)nz50 zebrafish at 72 h.p.f. after injection with MOs (control (CRTL) versus translation-start-site blocker (ATG) and splice-site blocker (SB1 and SB2) MOs targeting smarcd2). Data represent the numbers of fluorescence-labeled neutrophils per individual fish embryo. Pooled data from two independent MO experiments are shown: CTRL n = 16, ATG n = 16, SB1 n = 16, SB2 n = 16 fish. Center values, mean; error bars, s.d. P values were calculated by two-tailed unpaired t test. Replicates: 2. (b) Representative fluorescence images of zebrafish strain Tg(mpx:EGFP)i114: smarcd2wt/wt (wild type) and smarcd21/1 (knockout). Reduced numbers of GFP-expressing neutrophils are observed in smarcd21/1 mutant fish embryos. Acquired images: smarcd2wt/wt (n = 37 images) and smarcd21/1 (n = 10 images). (c) Enumeration of neutrophils in smarcd2wt/wt versus smarcd21/1 zebrafish. Numbers of fluorescence-labeled neutrophils were evaluated in caudal hematopoietic tissue for individual fish embryos. n = 38 smarcd2wt/wt and n = 10 smarcd21/1 fish were evaluated in two independent CRISPR/Cas9 experiments. Center values, mean; error bars, s.d. P values were calculated by two-tailed unpaired t test. Replicates: 2. Please also see Supplementary Tables 19 and 20.
Figure 5
Figure 5
Defective hematopoiesis in Smarcd2−/− mouse embryos. (a) Morphology of Smarcd2+/+, Smarcd2+/−, and Smarcd2−/− littermates at 14.5 d.p.c. Images were acquired from four litters: wild type (+/+) n = 4, heterozygous (+/−) n = 10, knockout (−/−) n = 9. Replicates: 2. (b) FACS plots of CD11b, Gr1, and Ly6c expression in Smarcd2+/+, Smarcd2+/−, and Smarcd2−/− embryos. (c) Myeloid fetal liver cell quantification. Data were pooled from six litters: wild type n = 9, heterozygous n = 22, knockout n = 9. Center values, mean; error bars, s.d. P values were calculated by two-tailed unpaired t test. Replicates: 3. (d) May–Grünwald and eosin staining of CFU cells derived from Smarcd2+/+, Smarcd2+/−, and Smarcd2−/− HSCs. Mature mouse neutrophils (with annular-shaped nuclei) are absent in Smarcd2−/− colonies. All images were acquired at 63× magnification. Replicates: 2. (e) CFUs derived from Smarcd2+/+, Smarcd2+/−, and Smarcd2−/− LSK cells upon differentiation with cytokines MethoCult M3434 contains SCF, IL-3, IL-6, and EPO. Data were pooled for LSK cells derived from five litters: wild type n = 4, heterozygous n = 5, knockout n = 5. Center values, mean; error bars, s.d. P values were calculated by two-tailed unpaired t test. Replicates: 3. (f) Blood cytology for Smarcd2+/+ and Smarcd2−/− embryos assessed by May–Grünwald and eosin staining at 20× and 63× magnification, showing anisocytosis (unfilled arrowhead, 23×), increased mitosis (black arrowheads, 63×), and multinucleated cells (unfilled arrowheads, 63×) in Smarcd2−/− embryos at 14.5 d.p.c. Replicates: 2. (g,h) FACS analysis of erythropoietic progenitors derived from Smarcd2+/+, Smarcd2+/−, and Smarcd2−/− CFU GEMM colonies (myeloid colonies containing granulocytes, erythrocytes, monocytes, and megakaryocytes). (g) FACS scatterplots and pictogram showing the distribution of CD71/Ter119 staining and erythroid stages (S0–S5). (h) Percentage of cells in stages S0–S5; wild type n = 24, heterozygous n = 16, knockout n = 24. Center values, mean; error bars, s.e.m. P values were calculated by two-way ANOVA (shown for wild type versus knockout). Replicates: 2.
Figure 6
Figure 6
SMARCD2 regulates transcriptional networks in hematopoietic progenitor cells. (a) Quantification of fetal myeloid blood cells (CD45+), progenitors (MPs, CMPs, GMPs, MEPs), and LSK stem cells at 14.5 d.p.c. Data were pooled from four litters: wild type (+/+) n = 4, heterozygous (+/−) n = 14, knockout (−/−) n = 7 embryos. Blood cell numbers per embryo are shown. Smarcd2−/− fetal hematopoiesis shows more cells in the LSK, MP, CMP, and MEP compartments and fewer cells in the GMP compartment. Center values, mean; error bars, s.d. P values were calculated by two-tailed unpaired t test with Welsh correction: GMP wild type versus knockout, P = 0,003. Replicates: 2. (b–e) RNA–seq analysis of Smarcd2+/+ and Smarcd2−/− fetal liver hematopoietic cell samples at 14–15 d.p.c. Shown are heat maps of the 50 genes with the lowest P values. Each column represents a fetal liver sample from one embryo. The color keys below the heat maps show the range of log2-transformed fold change in expression. (b) RNA–seq analysis of Smarcd2+/+ (n = 5) and Smarcd2−/− (n = 9) fetal liver LSK cell samples at 14–15 d.p.c. (c) RNA–seq analysis of Smarcd2+/+ (n = 3) and Smarcd2−/− (n = 4) fetal liver CMP cell samples at 14–15 d.p.c. (d) RNA–seq analysis of Smarcd2+/+ (n = 3) and Smarcd2−/− (n = 3) fetal liver GMP cell samples at 14–15 d.p.c.; 4930523C07Rik is abbreviated as 493...Rik. (e) RNA–seq analysis of Smarcd2+/+ (n = 3) and Smarcd2−/− (n = 4) fetal liver MEP cell samples at 14–15 d.p.c.; 700048O20Rik is abbreviated as 170...Rik; and NA is a gene without a name, described as ENSMUSG00000099065. Replicates: 1. (f) Percentage of CEBPε target genes among the differentially expressed genes for the different subpopulations (LSK, CMP, GMP, and MEP); see Supplementary Table 20.
Figure 7
Figure 7
SMARCD2, granule formation, and transcriptional regulation. (a) The relative mRNA expression of SMARCD genes, primary granule genes (CAMP, AAT), and secondary granule genes (MMP8, TCN1, LTF) is shown in human NB4 AML cells upon shRNA-mediated knockdown of SMARCD2. Data points show relative expression in cells treated with shRNA 1 or shRNA 2 versus control (CTRL) in three independent experiments for SMARCD1, SMARCD3, CAMP, AAT, and MMP8 and in four independent experiments for SMARCD2 and LTF. The expression levels of SMARCD1, SMARCD2, and SMARCD3 were determined in undifferentiated cells, and granule gene expression was measured in ATRA-differentiated NB4 cells. Center values, mean, error bars, s.d. Replicates: 3 or 4. (b) Chromatin immunoprecipitation (ChIP) in ATRA-differentiated NB4 cells. Shown is the percent input to describe the enrichment of CEBPε and BRG1 at the LTF promoter (Online Methods and Supplementary Note). CEBPε binds to the LTF promoter, and binding is significantly reduced in cells transduced with shRNA 1) or shRNA 2. BRG1 binds to the LTF promoter, and binding is significantly reduced in cells transduced with shRNA 1 or shRNA 2. Data from two experiments with a total of n = 5 independent NB4 cell cultures are shown; in total, three experiments were performed. Center values, mean; error bars, s.d. P values were calculated by two-tailed unpaired t test. Replicates: 3.
Figure 8
Figure 8
SMARCD2 transcriptional regulation. (a,b) Coimmunoprecipitation of FLAG-tagged SMARCD2 and HA-tagged CEBPε in 293T cells. (a) Immunoblot detection of immunoprecipitated FLAG-tagged SMARCD2 and coimmunoprecipitated HA-tagged CEBPε. (b) Immunoblot detection of immunoprecipitated HA-tagged CEBPε and coimmunoprecipitated FLAG-tagged SMARCD2. Images have been cropped; please compare to Supplementary Data 5. GAPDH is probed as a control. Replicates: 3. (c) Venn diagram showing the intersection of differentially expressed genes in undifferentiated NB4 cells (UD) and ATRA-differentiated NB4 cells (ATRA) with and without SMARCD2 knockdown in comparison to CEBPε target genes. For a list of intersections, see Supplementary Table 4. (d–g) Representation of differentially expressed genes in SMARCD2-knockdown versus control NB4 cells. (d) Undifferentiated NB4 cells (SMARCD2 knockdown versus control) analyzed by ATAC–seq and RNA–seq. An overlapping set of 12 genes was deregulated in both assays. (e) Heat map showing the relative expression (log2-transformed fold change) of the genes identified in undifferentiated cells in both assays. The heat map legend is the same as in g. NB4 cells were transduced with shRNA 1, shRNA 2, or CTRL, mock treated with DMSO, and sequenced twice (twice for RNA–seq and twice for ATAC–seq). Technical replicates: 2. (f) ATRA-differentiated NB4 cells (SMARCD2 knockdown versus control) analyzed by ATAC–seq and RNA–seq. A total of 16 genes were deregulated in both assays. (g) Heat map showing the relative expression (log2-transformed fold change) of the genes identified in ATRA-differentiated cells in both assays. NB4 cells were transduced with shRNA 1, shRNA 2, or CTRL, treated with ATRA, and sequenced twice (twice for RNA–seq and twice for ATAC–seq). Technical replicates: 2.

References

    1. Krumsiek J, Marr C, Schroeder T, Theis FJ. Hierarchical differentiation of myeloid progenitors is encoded in the transcription factor network. PLoS One. 2011;6:e22649. - PMC - PubMed
    1. Orkin SH, Zon LI. Hematopoiesis: an evolving paradigm for stem cell biology. Cell. 2008;132:631–644. - PMC - PubMed
    1. Krosl J, et al. A mutant allele of the Swi/Snf member BAF250a determines the pool size of fetal liver hemopoietic stem cell populations. Blood. 2010;116:1678–1684. - PMC - PubMed
    1. Friedman AD. Transcriptional control of granulocyte and monocyte development. Oncogene. 2007;26:6816–6828. - PubMed
    1. Griffin CT, Brennan J, Magnuson T. The chromatin-remodeling enzyme BRG1 plays an essential role in primitive erythropoiesis and vascular development. Development. 2008;135:493–500. - PMC - PubMed

MeSH terms

Substances