. 2017 May;49(5):692-699.
doi: 10.1038/ng.3834. Epub 2017 Apr 3.

The impact of structural variation on human gene expression

Affiliations

The impact of structural variation on human gene expression

Colby Chiang et al. Nat Genet. 2017 May.

Abstract

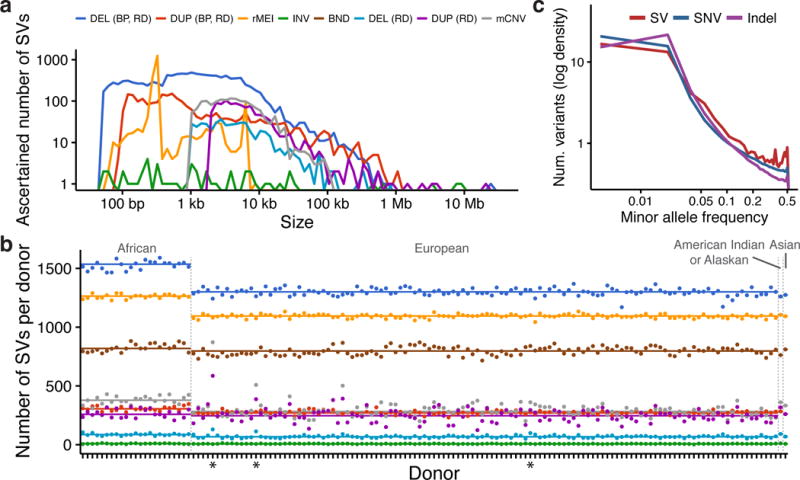
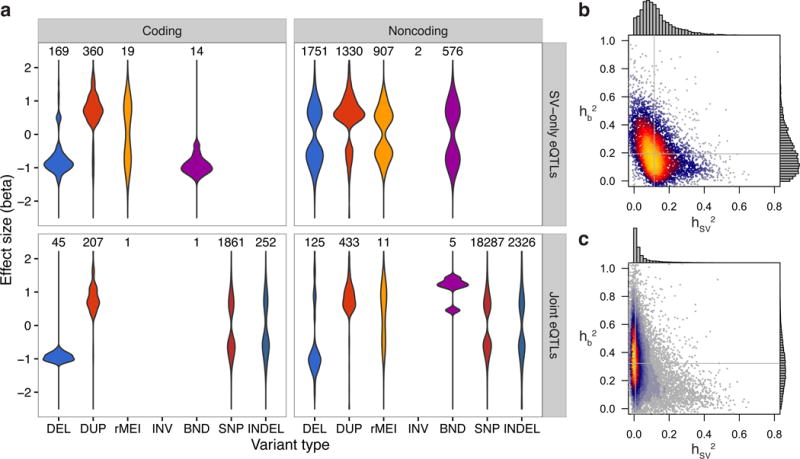
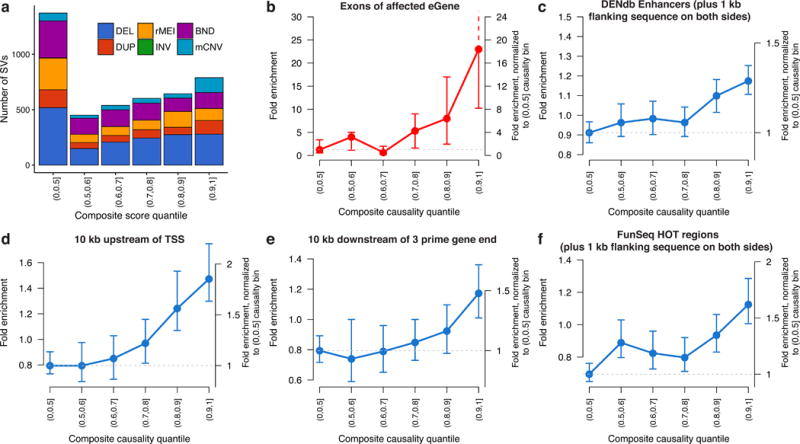
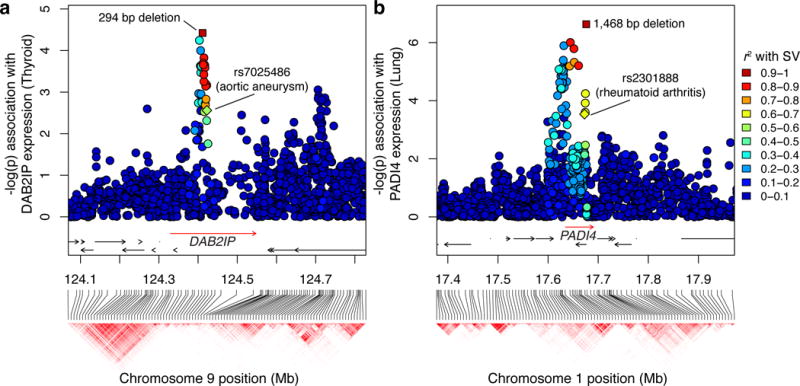
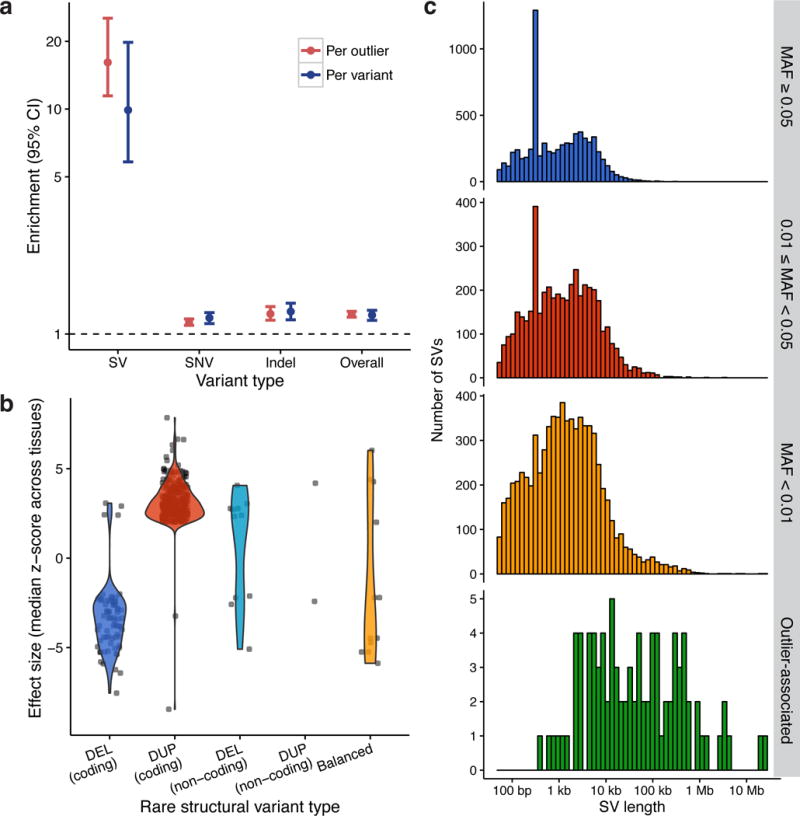
Structural variants (SVs) are an important source of human genetic diversity, but their contribution to traits, disease and gene regulation remains unclear. We mapped cis expression quantitative trait loci (eQTLs) in 13 tissues via joint analysis of SVs, single-nucleotide variants (SNVs) and short insertion/deletion (indel) variants from deep whole-genome sequencing (WGS). We estimated that SVs are causal at 3.5-6.8% of eQTLs-a substantially higher fraction than prior estimates-and that expression-altering SVs have larger effect sizes than do SNVs and indels. We identified 789 putative causal SVs predicted to directly alter gene expression: most (88.3%) were noncoding variants enriched at enhancers and other regulatory elements, and 52 were linked to genome-wide association study loci. We observed a notable abundance of rare high-impact SVs associated with aberrant expression of nearby genes. These results suggest that comprehensive WGS-based SV analyses will increase the power of common- and rare-variant association studies.


Conflict of interest statement

Competing financial interests

D.F.C. is a paid consultant of PierianDx. The authors declare no other competing financial interests.

Figures

Figure 1
Figure 1
Structural variation call set. (a) Size distribution of ascertained SVs by variant type and (b) number of SVs detected in each sample. Starred (*) samples exhibited abnormal read-depth profiles, and were excluded from rare variant analyses. (c) The site frequency spectrum of SVs compared to SNVs and indels detected by GATK.
Figure 2
Figure 2
eQTL effect size distributions and heritability partitioning with linear mixed models. (a) Effect size distributions for coding and noncoding variants of each type, with the number of eQTLs of each type above each distribution. The top panels (SV-only eQTLs) show the 5,128 eQTLs that were discovered by the SV-only analysis, while the bottom two panels show the 23,554 eQTLs discovered by the joint analysis. The “DUP” category includes duplications and mCNVs, and the alternate allele for rMEIs is the insertion. (b,c) Heat scatter plots showing the heritability of each eQTL apportioned to the most significant SV in the cis window (x-axis) and the additive effect from the top 1,000 most significant SNVs and indels in the cis window (y-axis) for (b) SV-only and (c) joint eQTL mapping analyses. Gray lines denote the median of values for each axis.
Figure 3
Figure 3
Feature enrichment of SV-eQTLs. Fold enrichment and 95% confidence intervals (based on 100 random shuffled sets of the positions of SVs in each bin) for the overlap between the most significant SV and various annotated genomic features at the union of eQTLs discovered by SV-only or joint eQTL mapping. (a) Composition of each causality score bin by SV type. (b) Enrichment for an SV in each bin of causality to touch exons of the affected eGene. For the remaining plots in blue (c-f), SVs that overlapped with an exon of their affected eGene were excluded, yet the remaining SVs still showed significant enrichment in (c) enhancers from the Dragon Enhancers Database (DENdb), (d) in the 10 kb regions upstream and (e) downstream of transcriptions start sites (TSS), and (f) regions predicted to be highly occupied by transcription factors (FunSeq HOT regions).
Figure 4
Figure 4
Candidate SV-eQTLs at GWAS loci. Genomic position and haplotype blocks are shown on the x-axis, and each variant’s association with the indicated eGene is shown on the y-axis. The rectangular points represent the predicted causal SV, with the colors representing its linkage (r2) to each marker in the window. The labeled diamonds show the reported risk allele for the specified GWAS phenotype. (a) A 294 bp deletion that intersects an enhancer in intron 1 of DAB2IP was linked to a risk allele for abdominal aortic aneurysm (rs7025486), and is also predicted to be a causal eQTL for DAB2IP. (b) A 1,468 bp deletion associated with increased expression of PADI4 is linked to a known risk allele for rheumatoid arthritis (rs2301888).
Figure 5
Figure 5
Gene expression outliers are associated with rare SVs. (a) Fold enrichment of rare variants within 5 kb of expression outliers (red) and fold enrichment of outliers within 5 kb of rare variants (blue) between the observed set of 5,047 outliers and 1,000 random permutations of their sample names (y-axis is log-scaled). (b) Effect size distributions for each SV type within 5 kb of an outlier in the same individual, with “coding” SVs defined as those that overlap with exons of the outlier gene and “noncoding” defined by the remainder. (c) Size distribution histograms by minor allele frequency (MAF) classes and rare SVs within 5 kb of an expression outlier in the same individual, excluding balanced rearrangements. A peak at ~300 bp in the top two plots results from Alu SINE insertions in the reference genome.

References

    1. Edwards SL, Beesley J, French JD, Dunning AM. Beyond GWASs: Illuminating the Dark Road from Association to Function. The American Journal of Human Genetics. 2013;93:779–797. - PMC - PubMed
    1. Lappalainen T, et al. Transcriptome and genome sequencing uncovers functional variation in humans. Nature. 2013;501:506–511. - PMC - PubMed
    1. The GTEx Consortium et al. The Genotype-Tissue Expression (GTEx) pilot analysis: Multitissue gene regulation in humans. Science. 2015;348:648–660. - PMC - PubMed
    1. Battle A, et al. Characterizing the genetic basis of transcriptome diversity through RNA-sequencing of 922 individuals. Genome Research. 2014;24:14–24. - PMC - PubMed
    1. 1000 Genomes Project Consortium et al. A global reference for human genetic variation. Nature. 2015;526:68–74. - PMC - PubMed