. 2017 Jun;18(6):694-704.
doi: 10.1038/ni.3716. Epub 2017 Apr 3.

Antagonism of B cell enhancer networks by STAT5 drives leukemia and poor patient survival

Affiliations

Antagonism of B cell enhancer networks by STAT5 drives leukemia and poor patient survival

Casey D S Katerndahl et al. Nat Immunol. 2017 Jun.

Abstract

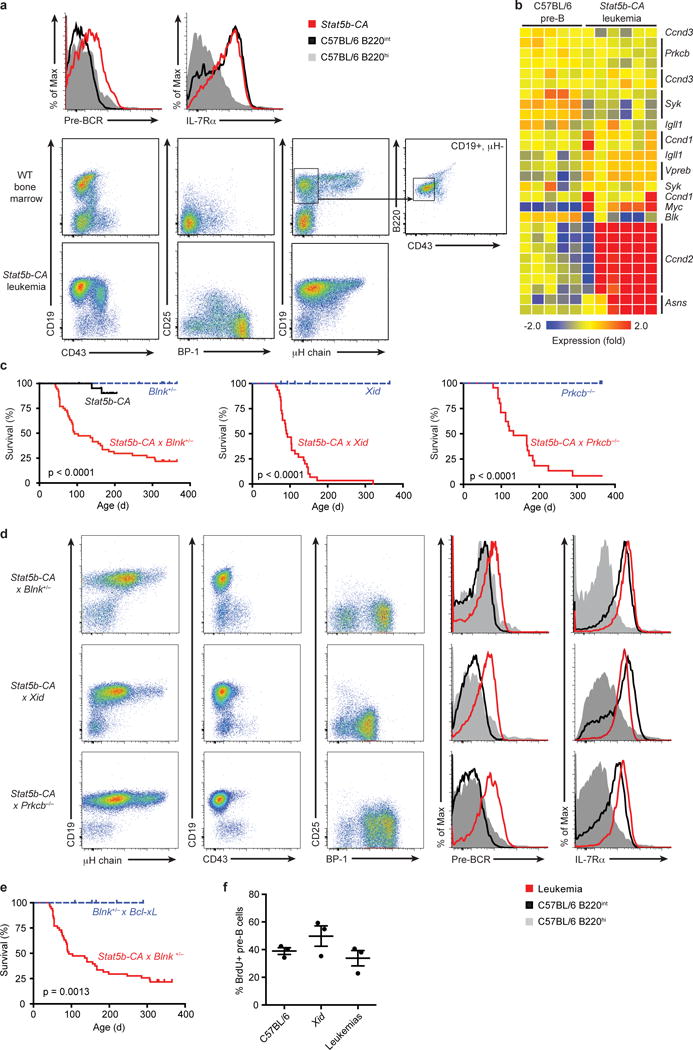
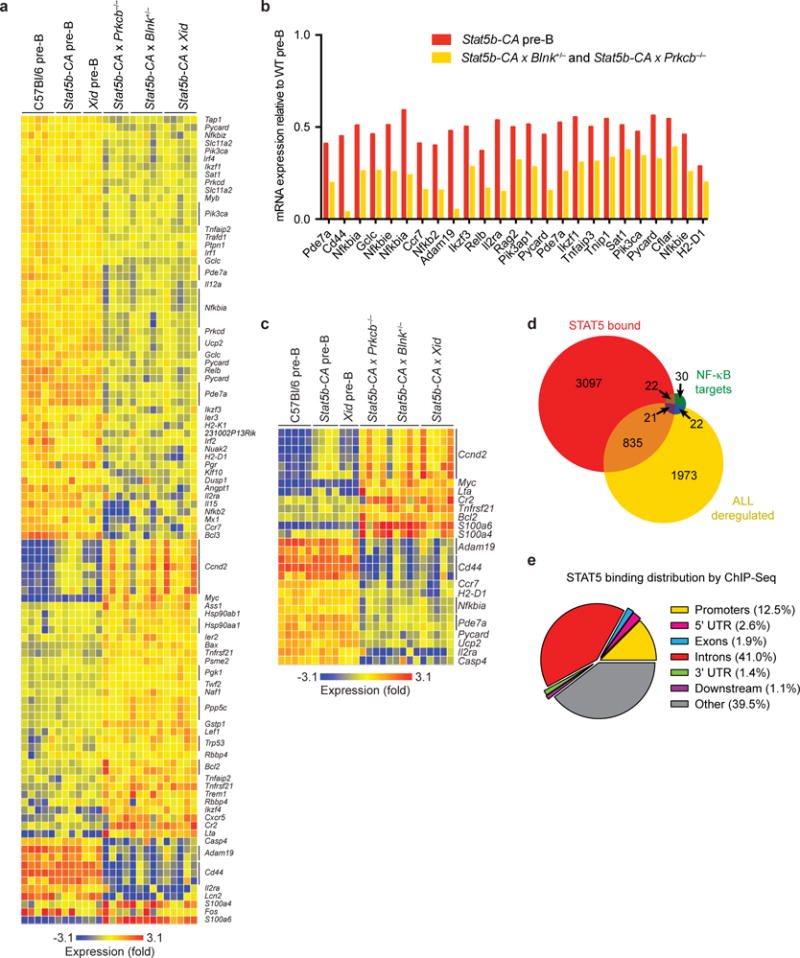
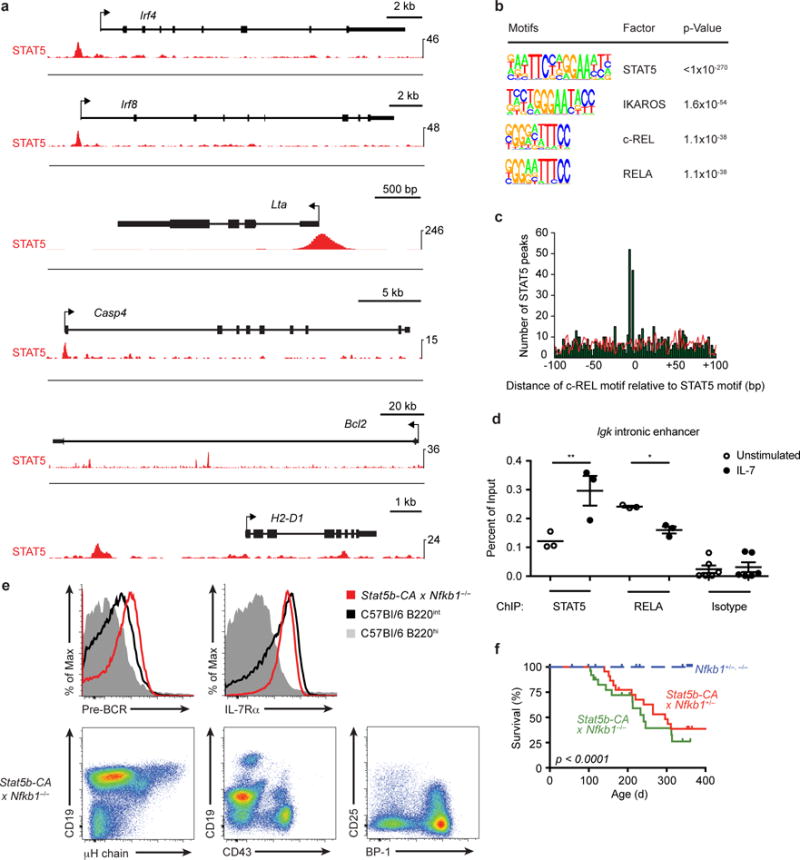
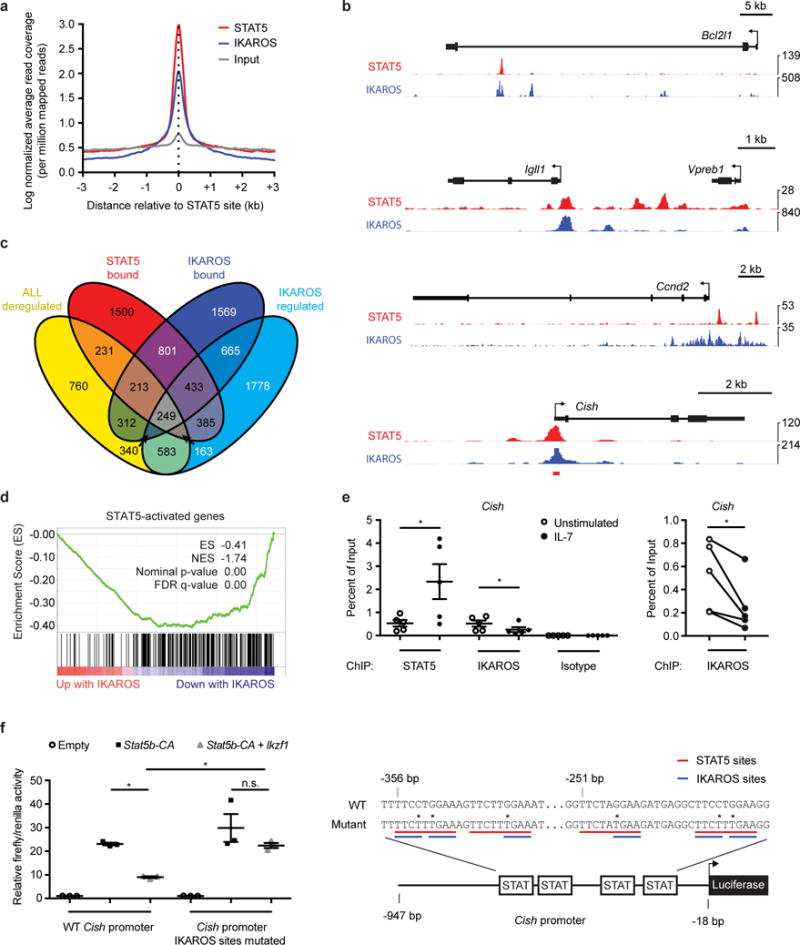
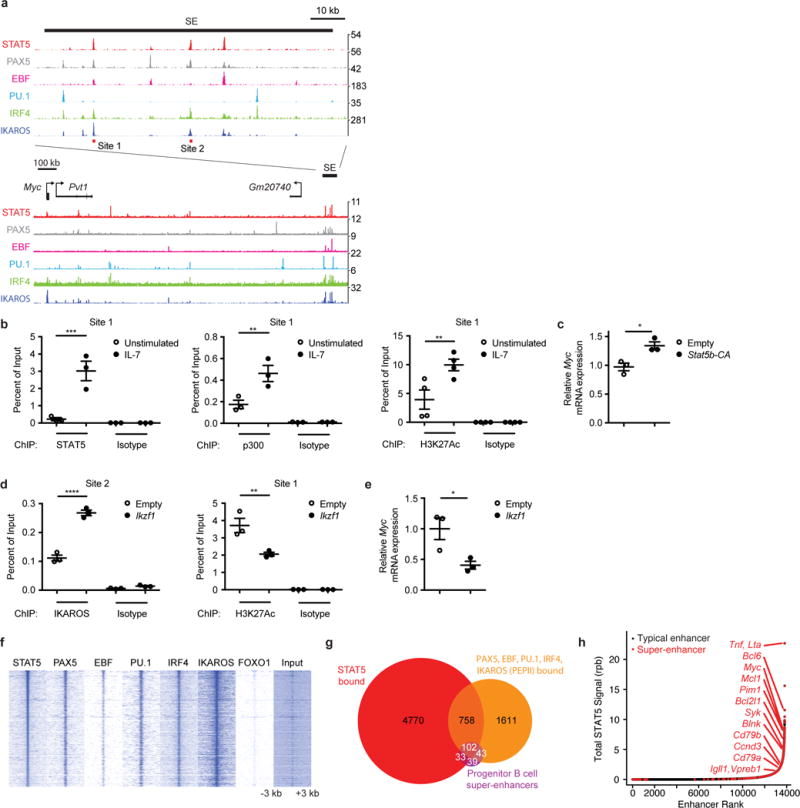
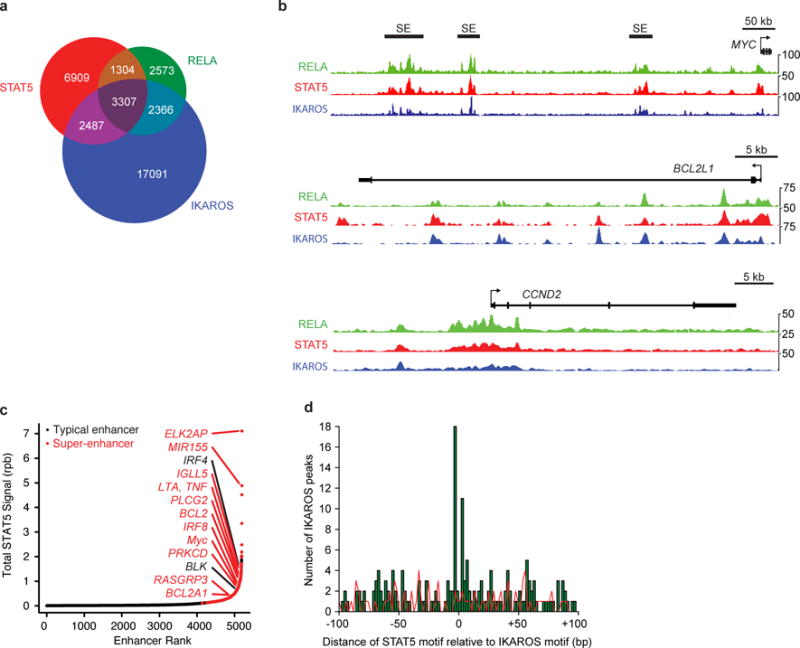
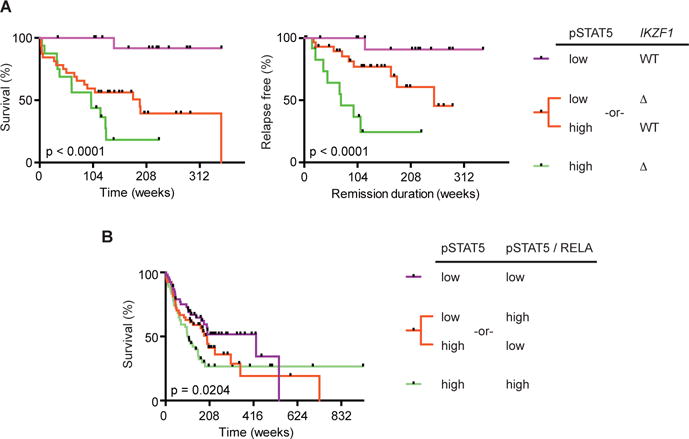
The transcription factor STAT5 has a critical role in B cell acute lymphoblastic leukemia (B-ALL). How STAT5 mediates this effect is unclear. Here we found that activation of STAT5 worked together with defects in signaling components of the precursor to the B cell antigen receptor (pre-BCR), including defects in BLNK, BTK, PKCβ, NF-κB1 and IKAROS, to initiate B-ALL. STAT5 antagonized the transcription factors NF-κB and IKAROS by opposing regulation of shared target genes. Super-enhancers showed enrichment for STAT5 binding and were associated with an opposing network of transcription factors, including PAX5, EBF1, PU.1, IRF4 and IKAROS. Patients with a high ratio of active STAT5 to NF-κB or IKAROS had more-aggressive disease. Our studies indicate that an imbalance of two opposing transcriptional programs drives B-ALL and suggest that restoring the balance of these pathways might inhibit B-ALL.


Conflict of interest statement

COMPETING FINANCIAL INTERESTS: The authors have no competing financial interests.

Figures

Figure 1
Figure 1. Stat5b-CA drives pre-B leukemia
(a) Flow cytometric analysis of bone marrow from leukemic Stat5b-CA mice (red histogram and bottom panels) or C57BL/6 mice (grey and black histograms and middle panels). Boxes in C57BL/6 (i.e. WT) plots show gates used to sort WT pre-B cells for use in microarray studies (b) mRNA expression in Stat5b-CA B-ALL as determined by microarray analysis. RNA was isolated from CD19+B220+ tumor lymph node cells (n = 6 mice) or sorted wild-type pre-B cells (B220+CD19+μHloCD43lo; n = 5 samples pooled from 3–8 mice per sample). (c) Survival of Stat5b-CA (n = 22), Stat5b-CA x Blnk+/− (n = 52), Stat5b-CA x Xid (n = 30), and Stat5b-CA x Prkcb−/− (n = 22) mice compared to Blnk+/− (n = 35), Xid (n = 7), and Prkcb−/− (n = 10) littermate controls. (d) Flow cytometric analysis of bone marrow from leukemic Stat5b-CA x Blnk+/− (top panels), Stat5b-CA x Xid (middle panels), and Stat5b-CA x Prkcb−/− (bottom panels) mice (dot plot and red histogram) or wild-type mice (grey and black histograms). (e) Survival of Blnk+/− x Bcl2l1 (n = 10) compared to Stat5b-CA x Blnk+/− (n = 52) mice. Deaths in c and e are indicative of tumor development. (f) BrdU analysis of pre-B cell proliferation. P-values in c and e determined by log-rank Mantle-Cox test. P = 0.19 (One-way ANOVA (f)). Data are representative of 3 independent experiments (f; mean ± SEM), or 9 (a), 25 (d, top plot), 10 (d, middle plot), or 8 (d, bottom plot) independent experiments with a total of 13 (a) 35 (d, top plot), 17 (d, middle plot), or 13 (d, bottom plot) mice per genotype.
Figure 2
Figure 2. STAT5 activation synergizes with pre-BCR signaling defects to deregulate NF-κB target gene expression
(a), NF-κB target genes deregulated in Stat5b-CA x Blnk+/− (n = 5 mice), Stat5b-CA x Xid (n = 5 mice), and Stat5b-CA x Prkcb−/− (n = 4 mice) leukemias by microarray analysis. Individual gene expression in B220+CD19+ cells from lymph nodes of leukemic mice was compared to B220+CD19+μHCD43lo pre-B cells from wild-type (n = 5 samples pooled from 3–8 mice per sample), Stat5b-CA (n = 4 samples pooled from 3–8 mice per sample), and Xid (n = 3 samples pooled from 3–8 mice per sample) bone marrow by microarray. (b), Expression of NF-κB target genes by microarray analysis that are further downregulated in Stat5b-CA pre-B cells (n = 4 samples pooled from 3–8 mice per sample) relative to wild-type pre-B cells (n = 5 samples pooled from 3–8 mice per sample) and downregulated in Stat5b-CA x Blnk+/− (n = 5 mice) and Stat5b-CA x Prkcb−/− (n = 4 mice) leukemias compared Stat5b-CA pre-B cells. Expression is plotted relative to the expression in wild-type pre-B cells. (c), The expression of NF-κB target genes synergistically deregulated by Stat5b-CA and pre-BCR signaling defects. Genes identified in Figure 2a were used to calculate synergy scores (see Methods). Microarray heatmap represents mRNA expression of genes with synergy scores < 0.9. (d), Venn diagram illustrating overlap of STAT5-bound genes in Stat5b-CA x Blnk+/− leukemia with NF-κB gene targets and genes deregulated in Stat5b-CA x Blnk+/−, Stat5b-CA x Xid, and Stat5b-CA x Prkcb−/−leukemias. (e), Pie chart of STAT5 binding distribution relative to genes by ChIP-Seq in Stat5b-CA x Blnk+/− leukemia. Promoters defined as 5000 bp region upstream of TSS and downstream regions defined as 1000 bp region downstream of TTS. Bars indicate mean (b). Data are representative of one independent experiment (d,e).
Figure 3
Figure 3. NF-κB1 acts as a tumor suppressor to prevent STAT5b-CA-driven leukemia
(a) STAT5 (red) occupancy in Stat5b-CA x Blnk+/− leukemias at the NF-κB target gene loci Irf4, Irf8, Lta, Casp4, Bcl2, and H2-D1 by ChIP-seq. (b) Transcription factor binding motifs enriched by STAT5 ChIP-Seq in Stat5b-CA x Blnk+/− leukemias. (c) Distribution of c-REL binding motifs relative to STAT5 binding sites found by STAT5 ChIP-Seq. (d) STAT5 and RELA ChIP-qPCR at Igk intronic enhancer in Stat5b-CA x Blnk+/− leukemias stimulated with or without IL7 at 37°C for 30 minutes. (e) Flow cytometric analysis of lymph nodes from leukemic Stat5b-CA x Nfkb1−/− mice (dot plot and red histogram) or bone marrow from wild-type mice (grey and black histograms). (f) Survival of Stat5b-CA x Nfkb1+/− (n = 23) and Stat5b-CA x Nfkb1−/− mice (n = 27) compared to littermate control mice (n = 27). Deaths are indicative of tumor development. Tick marks represent censored data points. P-value determined by log-rank Mantle-Cox test. *P < 0.05, **P < 0.01 (one-way ANOVA with Bonferroni’s Multiple Comparison post-test, d). Data are representative of one (a-c), three (d; mean ± SEM), or 6 independent experiments with a total of 6 mice per genotype (e).
Figure 4
Figure 4. STAT5 antagonizes IKAROS and disrupts B cell super-enhancer networks
(a) Distribution of STAT5 and IKAROS peak summits relative to STAT5 binding sites by ChIP-Seq. (b) Occupancy of STAT5 and IKAROS by ChIP-Seq in Stat5b-CA x Blnk+/− leukemia and wild-type pre-B cells, respectively, at Bcl2l1, Igll1, Vpreb1, Ccnd2, and Cish. Red bar below Cish indicates location of ChIP-qPCR amplicon used in e. (c) Venn diagram of genes deregulated in Stat5b-CA x Blnk+/−, Stat5b-CA x Xid, and Stat5b-CA x Prkcb−/− leukemias compared to wild-type pre-B cells; genes bound by STAT5 in Stat5b-CA x Blnk+/− leukemias; genes bound by IKAROS in pre-B cells; genes regulated by IKAROS. (d) Gene Set Enrichment Analysis (GSEA) reveals that genes activated by STAT5 in the Stat5b-CA x Blnk+/− tumors are enriched for genes that are negatively regulated by IKAROS. (e) STAT5 and IKAROS ChIP-qPCR at Cish promoter in Stat5b-CA x Blnk+/− leukemias stimulated with or without IL7 at 37°C for 30 minutes. (f) Luciferase activity of wild-type or mutant Cish promoter in Ba/F3 progenitor B cells transfected with Stat5b-CA or Stat5b-CA and Ikzf1 retroviruses (left panel). Illustration of the Cish luciferase constructs (right panel). STAT5 binding sites are underlined in red while IKAROS binding sites are underlined in blue. Sites of mutation are indicated with asterisks. Base pair (bp) positions indicate distances relative to the Cish translational start codon. (e,f) Mean ± SEM. *P < 0.05 (two-tailed paired t-test, e). *P < 0.05, **P ≤ 0.001 (one-way ANOVA with Bonferroni’s Multiple Comparison post-test, f). Data are representative of five (e), three (f), or one (a-d, STAT5) or two (a-d, IKAROS) independent experiments. Data for IKAROS ChIP-Seq experiments in a-c came from ref.).
Figure 5
Figure 5. STAT5 binds to several progenitor B cell super-enhancers and opposes regulation of the Myc locus by IKAROS
(a) Occupancy of STAT5, PAX5, EBF, PU.1, IRF4 and IKAROS by ChIP-Seq at Myc locus in Stat5b-CA x Blnk+/− leukemia (STAT5), Rag−/− pro-B cells (PAX5, EBF, PU.1, IRF4) or wild-type pre-B cells (IKAROS); SE = super-enhancer. Red bars indicate the locations (sites 1 and 2) of two ChIP-qPCR amplicons used in b and d. (b) STAT5 (left panel), p300 (middle panel), and H3K27Ac (right panel) ChIP-qPCR at Myc super-enhancer site 1 in Stat5b-CA x Blnk+/− leukemias stimulated with or without IL7 at 37°C for 30 minutes. (c) Myc qRT-PCR in Ba/F3 cells transduced with empty or Stat5b-CA retroviruses. (d) IKAROS (left panel) and H3K27Ac (right panel) ChIP-qPCR at Myc super-enhancer in Ba/F3 cells transduced with empty or Ikzf1 retroviruses. (e) Myc qRT-PCR in Ba/F3 cells transduced with empty or Ikzf1 retroviruses. (f) Heat map of STAT5, PAX5, EBF, PU.1, IRF4, IKAROS and FOXO1 occupancy centered on STAT5 binding sites at STAT5-bound loci by ChIP-Seq. (g) Venn-diagram illustrating the peak-level overlap of STAT5, 4 or more of PAX5, EBF, PU.1, IRF4, and IKAROS (PEPII), and progenitor B cell super-enhancers. (h) STAT5 ChIP-Seq signal in reads-per-billion (rpb) at progenitor B cell typical enhancers and super-enhancers. (b-e) Mean ± SEM. *P < 0.05 (two-tailed unpaired t-test, c, e). **P < 0.01, ***P < 0.001, ****P < 0.0001 (one-way ANOVA with Bonferroni’s Multiple Comparison post-test, b,d). Data are representative of one (a,f-h, STAT5, PAX5, EBF, PU.1, IRF4, FOXO1), two (a,f,g, IKAROS), or three (b-e) independent experiments. Data for PEPII ChIP-Seq experiments in a,f,g came from,–. Defined super-enhancers in a,g,h came from.
Figure 6
Figure 6. STAT5 binding overlaps with NF-κB and IKAROS and correlates with super-enhancer function in human B lymphoblastoid cells
A, Venn diagram showing overlap between STAT5, RELA and IKAROS binding sites in GM12878 cell line. B, Occupancy of STAT5, RELA, and IKAROS at BCL2L1, CCND2 and MYC loci in GM12878 cell line. C, STAT5 ChIP-Seq signal in reads-per-billion at GM12878 cell line typical enhancers and super-enhancers. D, Distribution of STAT5 binding motifs relative to IKAROS binding sites found by IKAROS ChIP-Seq in ICN1 and LAX2 primary B-ALL samples. Data are representative of 2 independent experiments (a–d).
Figure 7
Figure 7. STAT5 activation paired with loss of IKZF1 or NF-κB correlates with survival in B-ALL patients
A, Survival (left panel) and remission duration (right panel) in B-ALL patients stratified by pSTAT5 and IKZF1 status (n = 64). B, Survival in B-ALL patients stratified by pSTAT5 and the ratio of pSTAT5 to RELA (n = 161). P-values determined by log-rank test for trend of medians (a,b). Tick marks represent censored data points.

Comment in

References

    1. Pui CH, Gajjar AJ, Kane JR, Qaddoumi IA, Pappo AS. Challenging issues in pediatric oncology. Nature reviews Clinical oncology. 2011;8:540–549. - PMC - PubMed
    1. Inaba H, Greaves M, Mullighan CG. Acute lymphoblastic leukaemia. Lancet. 2013;381:1943–1955. - PMC - PubMed
    1. Pui CH, et al. Treating childhood acute lymphoblastic leukemia without cranial irradiation. The New England journal of medicine. 2009;360:2730–2741. - PMC - PubMed
    1. Bhatia S, et al. Low incidence of second neoplasms among children diagnosed with acute lymphoblastic leukemia after 1983. Blood. 2002;99:4257–4264. - PubMed
    1. Downing JR, et al. The Pediatric Cancer Genome Project. Nature genetics. 2012;44:619–622. - PMC - PubMed

MeSH terms

Substances