. 2017 Apr 3;13(4):e1005451.
doi: 10.1371/journal.pcbi.1005451. eCollection 2017 Apr.

Polarization and migration in the zebrafish posterior lateral line system

Affiliations

Polarization and migration in the zebrafish posterior lateral line system

Hildur Knutsdottir et al. PLoS Comput Biol. .

Abstract

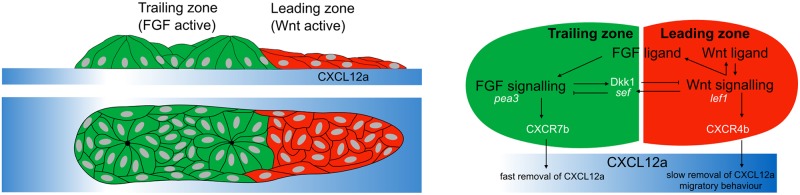
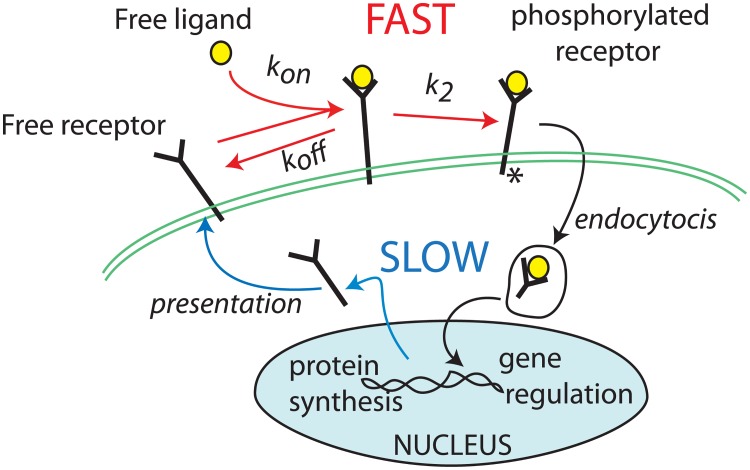
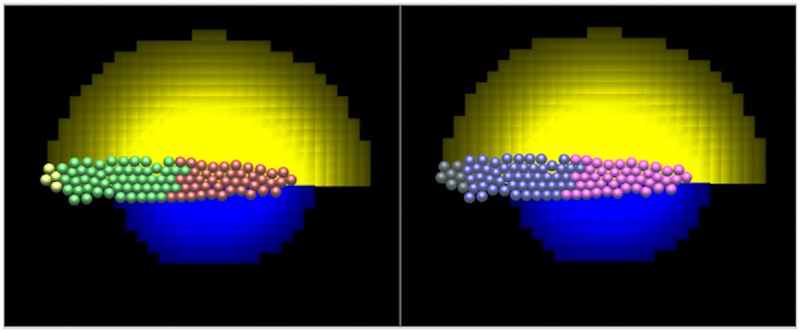
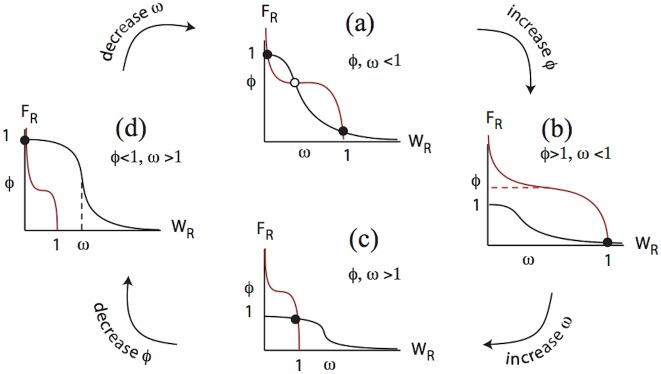
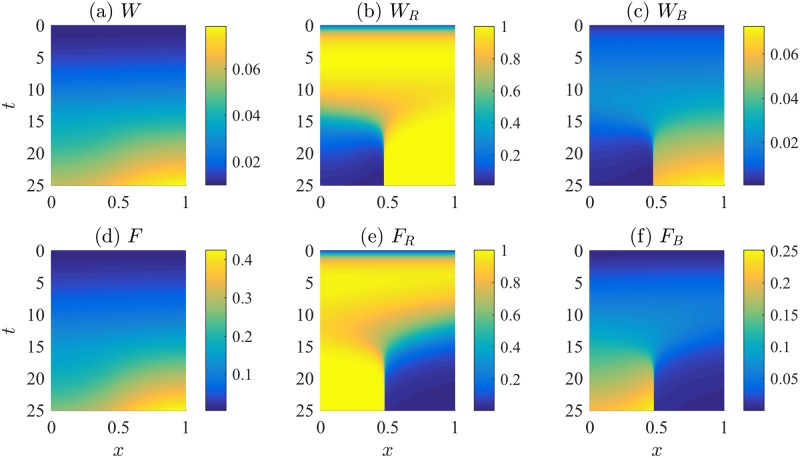
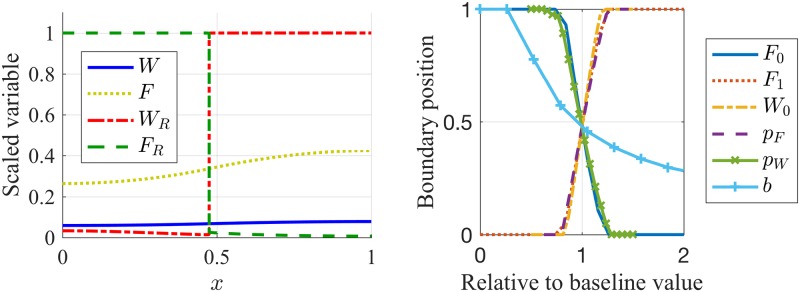
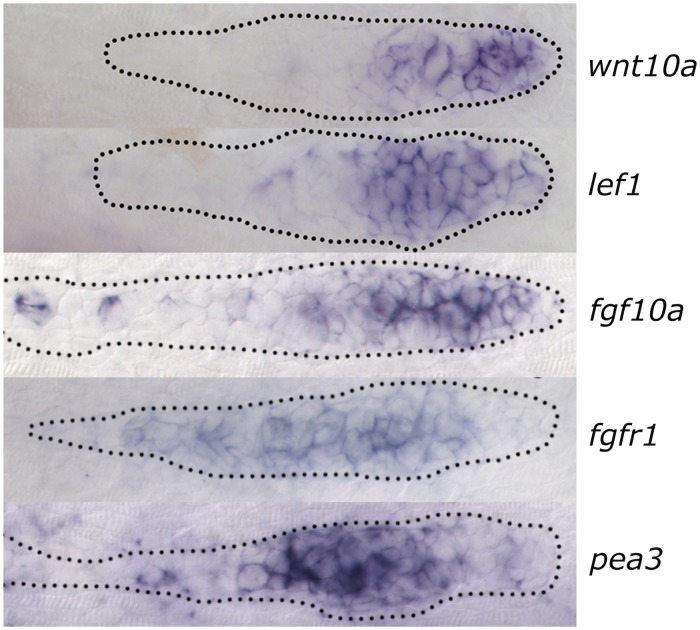
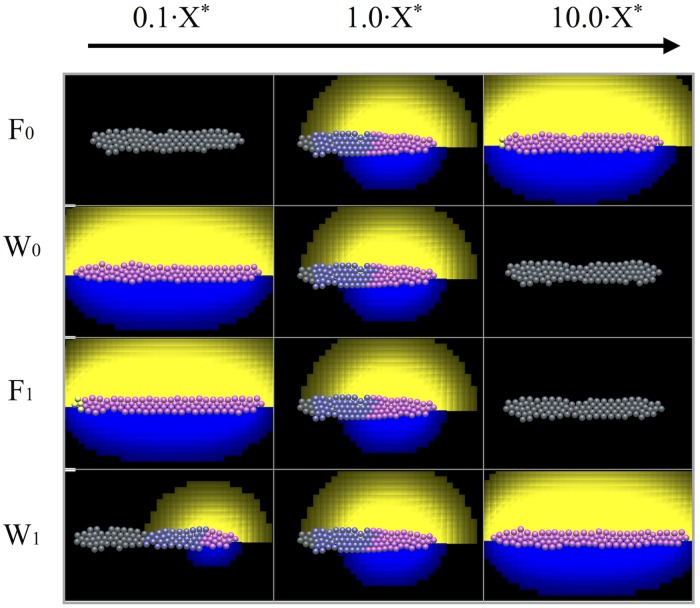
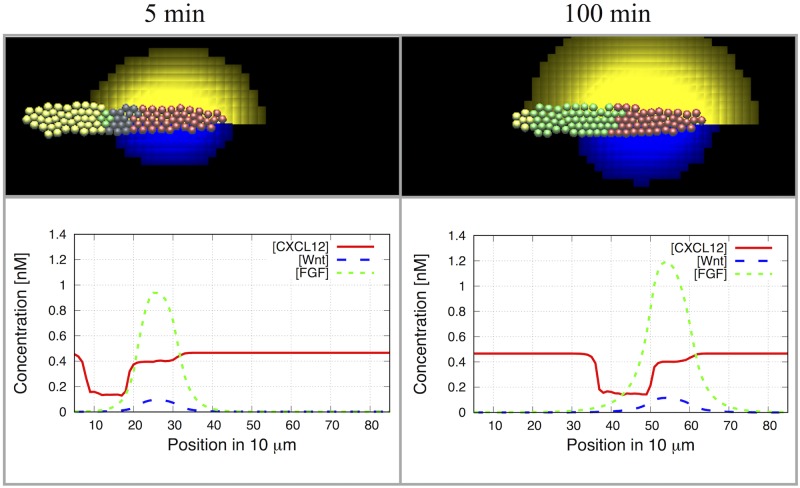
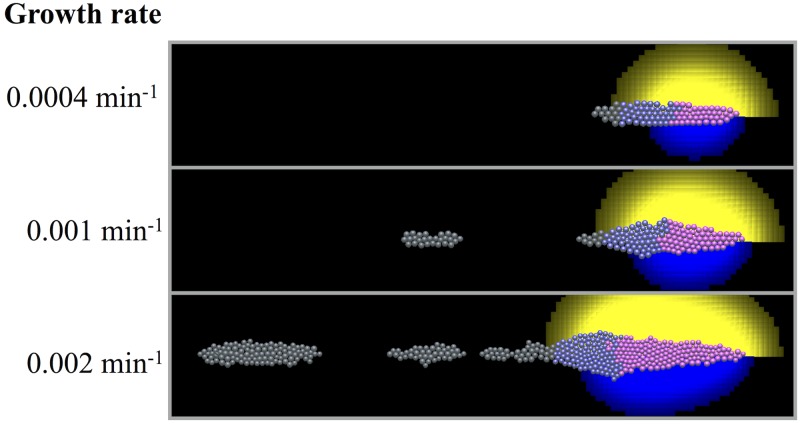
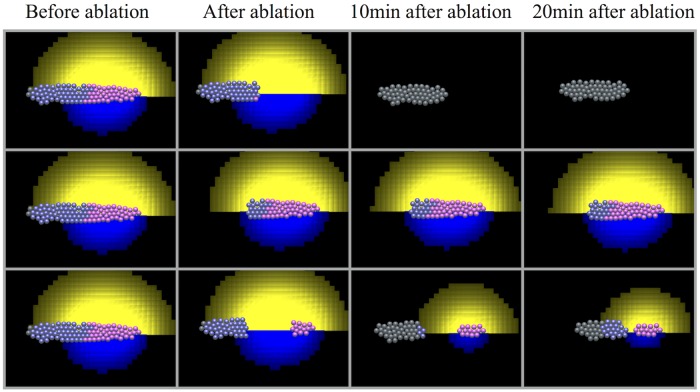
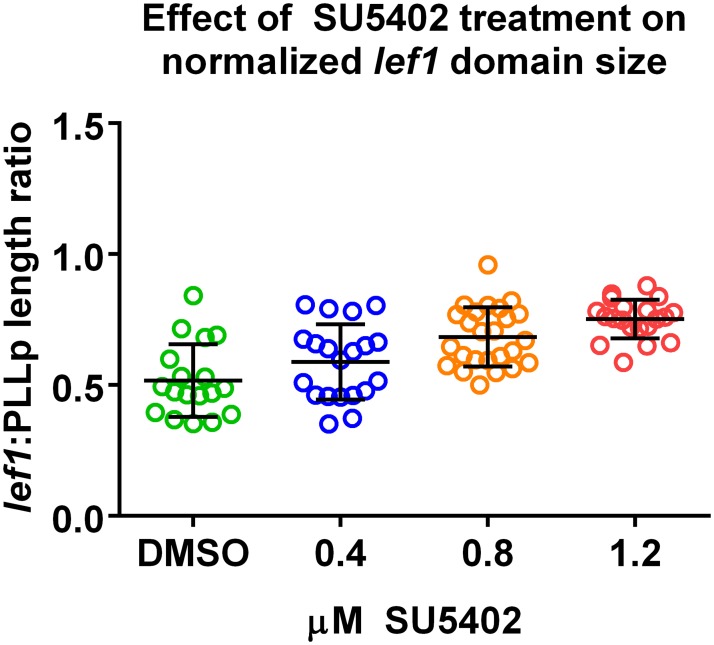
Collective cell migration plays an important role in development. Here, we study the posterior lateral line primordium (PLLP) a group of about 100 cells, destined to form sensory structures, that migrates from head to tail in the zebrafish embryo. We model mutually inhibitory FGF-Wnt signalling network in the PLLP and link tissue subdivision (Wnt receptor and FGF receptor activity domains) to receptor-ligand parameters. We then use a 3D cell-based simulation with realistic cell-cell adhesion, interaction forces, and chemotaxis. Our model is able to reproduce experimentally observed motility with leading cells migrating up a gradient of CXCL12a, and trailing (FGF receptor active) cells moving actively by chemotaxis towards FGF ligand secreted by the leading cells. The 3D simulation framework, combined with experiments, allows an investigation of the role of cell division, chemotaxis, adhesion, and other parameters on the shape and speed of the PLLP. The 3D model demonstrates reasonable behaviour of control as well as mutant phenotypes.


Conflict of interest statement

The authors have declared that no competing interests exist.

Figures

Fig 1
Fig 1. The geometry and signaling of the posterior lateral line primordium (PLLP).
Left: A sketch of the PLLP showing side and top-down views, with leading (red) and trailing (green) cells on a stripe of CXCL12a. Right: A schematic diagram of signalling in the PLLP, showing the mutual inhibition between FGFR and WntR signalling. (Black text denotes model components, white text aides in interpretation of experiments.) FGF signaling inhibits Wnt signaling by determining expression of Dkk1; Wnt signaling cells express the gene sef that inhibits FGF signaling. WntR active cells are sources of both FGF and Wnt ligands. Experimentally, pea3 and lef1 expression levels are used to identify FGF and Wnt signalling, respectively. The WntR-FGFR activity polarization sets up chemokine polarization (CXCR4b vs CXCR7b). In our model, this leads to the creation of a gradient of CXCL12a that enables directed migration of the PLLP.
Fig 2
Fig 2. Ligand-receptor dynamics forms a basis for our model.
FGF or Wnt receptors are synthesized, presented on the cell surface, and, after binding to ligand, phosphorylated and internalized by endocytosis. Here we assume that ligand-receptor binding is rapid on the timescale of such receptor dynamics, so that we can approximate the bound receptor level by Eq (3).
Fig 3
Fig 3. Illustration of the simulations using the 3D deformable ellipsoid cell-based model.
View from above of a 1-cell layer representing the PLLP. The stripe of CXCL12a would be directly underneath the PLLP, not explicitly shown. For visualization purposes, the Wnt (blue) and FGF (yellow) ligands are shown as a pair of clouds in each split-image. Left panel: cells are colored based on receptor expression level (red for high Wnt and green for high FGF receptor levels, WR, FR). FGFR and WntR expressing cells are colored yellow. Right panel: cells colored by their bound receptor levels (pink for high Wnt and purple for high FGF bound-receptor levels, WB, FB). In our model we interpret the latter as the Wnt or FGF signalling levels. Cells in the back of the PLLP express FGF receptors but do not signal since FGF ligand is so low that most FGF receptors are unbound. Grey or yellow cells at the back of the PLLP are those that are not yet committed to being either WntR or FGFR active cells. Results from the full 3D model after 30 min of simulation time (before the onset of migration).
Fig 4
Fig 4. Analysis of mutual inhibition dynamics leads to model insights.
The scaled mutual inhibition Eq (7) can have one of four possible behaviours represented by nullclines in the WR FR phase plane. (FR nullcline in black, WR nullcline in red.) (a) Bistability, in which either a high Wnt receptor (WR) or high FGF (FR) receptor expressing state can result, depending on initial conditions. (b) A Wnt-receptor expressing state always result, (c) a coexistence-state, with both Wnt and FGF receptors expressed, and (d) an FGF only receptor expression state exists. When the Hill coefficients n, m are large, the steady states (appropriately scaled) occur approximately at a subset of the points {(1, 0), (1, 1), (0, 1)} and transitions between the four qualitative outcomes displayed in this figure can be summarized by simple inequalities in terms of aggregate quantities ϕ and ω, see Eq (7c).
Fig 5
Fig 5. The Wnt-FGF mutual inhibition model predicts the formation of signalling domains in response to graded W1 across the primordium.
Simulation kymographs for Wnt and FGF signalling. Initially, we assumed a gradient W1(x) = bx + 0.03 in the uncoupled Wnt steady state parameter, with b = 0.01. Time increases downwards; position across the PLLP is horizontal, with leading edge on the right. (a) Wnt ligand, W(x, t), (b) Wnt receptors, WR(x, t), (c) bound Wnt receptors, WB(x, t), (d) FGF ligand, F(x, t), (e) FGF receptors, FR(x, t), and (f) bound FGF receptors, FB(x, t). Signalling domains form after a few minutes, with a sharp boundary between zones. Bound ligand concentrations are calculated using Eq (3). Parameters are as in Table A in Supporting Information S6 Text. Parameter Estimation and Values. Initial conditions: W(x, 0) = 0.01, F(x, 0) = 0.005, WR(x, 0) = 0.1, FR(x, 0) = 0.01.
Fig 6
Fig 6. The position of the boundary between leading and trailing zones is parameter dependent.
In the left panel, the concentration profiles of the ligand and receptor activity are plotted at t = 25 minutes (after formation of signalling domains), which reveals the formation of a sharp boundary between the leading and trailing zones. In the right panel, the boundary position between the leading and trailing zones is shown to be a function of model parameters. Parameter sweeps were conducted for a range of “IC50” inhibition parameters F0, W0, FGF steady state receptor levels F1, production of Wnt and FGF ligand pW, pF, as well as the slope of the W1 gradient across the PLLP, b. The vertical axis represents the fraction of the PLLP length that is FGF-receptor expressing at steady state. The horizontal axis represents the given parameters, scaled by their baseline values as listed in Table A in Supporting Information S6 Text. Parameter Estimation and Values.
Fig 7
Fig 7. Experimentally observed Wnt and FGF expression and signalling levels.
RNA in-situ hybridization showing expression at 32 hours post fertilization in the PLLP. From top to bottom these are: wnt10a (Wnt ligand), lef1 (Wnt signalling), fgf10a (FGF ligand), fgfR1 (FGF receptors) and pea3 (FGF signalling). The scale bar is 10μm.
Fig 8
Fig 8. The position of the boundary between the leading and trailing zones is parameter dependent.
The four parameters, F0, F1, W0 and W1 are altered. In the first column the baseline value (X*) has been multiplied by 0.1 and in the last column it has been multiplied by 10. Increasing F0 (top row) and W1 (bottom row) results in an increase in the size of the Wnt domain. Conversely, increasing F1 (second row) and W0 (third row) results in a decrease in the size of the Wnt domain. Results from the full 3D model after 50 min of simulation time (before the onset of migration).
Fig 9
Fig 9. Successful migration in the discrete cell model.
Simulations of the migrating primordium showing WntR expressing cells (red), FGFR expressing cells (green), WntR and FGFR expressing cells (yellow) and indeterminate cells (grey). Left: at 2 min, Right: at 100 min. Bottom row: concentrations of CXCL12a (red), FGF (green) and Wnt (blue). Parameters as in Table A in Supporting Information S6 Text. Parameter Estimation and Values. See Fig. C in Supporting Information S5 Text. Additional results and details, for a more detailed time sequence and Supporting Information S1 Movie. 3D simulation of PLLP migration, for a 4 hour movie of the simulation results.
Fig 10
Fig 10. Effect of growth rate.
Simulation results for three different growth parameters. Simulation time is 6 hours. As the growth rate is increased, the shape and size of the PLLP becomes distorted, and fails to match experimental observations.
Fig 11
Fig 11. Recovery after partial ablation.
As in laser ablation from [8], part of the PLLP is removed in the simulation, and recovery observed. Top row: the front segment (WntR active cells) is removed, leaving only FGFR active cells; the PLLP stalls and cannot continue. Middle row: the rear portion is removed, leaving a few FGFR cells behind; the PLLP migration continues. Bottom row: the middle segment is removed. Motion is stalled while the trailing FGFR active cluster catches up with the front. Once the clusters have merged, migration resumes.
Fig 12
Fig 12. Dose response experiment using SU5402.
The FGF receptor blocker SU5402 increases the size of the WntR activity domain in a dose-dependent manner (lef1 used as a marker). The size of the lef1 domain has been normalized relative to the size of the whole PLLP. A Linear regression analysis resulted in y = 0.2005x + 0.515. A one-way ANOVA reveals that the slope is significantly non-zero (0.2005 ± 0.03012). The 95% confidence interval for the slope is 0.1405—0.2605, with R2 = 0.3536, and P < 0.0001. These results validate the findings of our model.

Similar articles

Cited by

References

    1. Gompel N, Cubedo N, Thisse C, Thisse B, Dambly-Chaudière C, Ghysen A. Pattern formation in the lateral line of zebrafish. Mechanisms of Development. 2001;105(1–2):69–77. 10.1016/S0925-4773(01)00382-3 - DOI - PubMed
    1. Lecaudey V, Cakan-Akdogan G, Norton WH, Gilmour D. Dynamic FGF signaling couples morphogenesis and migration in the zebrafish lateral line primordium. Development. 2008;135(16):2695–2705. 10.1242/dev.025981 - DOI - PubMed
    1. Nechiporuk A, Raible DW. FGF-dependent mechanosensory organ patterning in zebrafish. Science. 2008;320(5884):1774–1777. 10.1126/science.1156547 - DOI - PubMed
    1. Aman A, Piotrowski T. Wnt/β-Catenin and FGF Signaling Control Collective Cell Migration by Restricting Chemokine Receptor Expression. Dev Cell. 2008;15(5):749–761. 10.1016/j.devcel.2008.10.002 - DOI - PubMed
    1. Dambly-Chaudière C, Cubedo N, Ghysen A. Control of cell migration in the development of the posterior lateral line: antagonistic interactions between the chemokine receptors CXCR4 and CXCR7/RDC1. BMC Developmental Biology. 2007;7(1):23 10.1186/1471-213X-7-23 - DOI - PMC - PubMed

Publication types