. 2017 Jun 1;27(6):3318-3330.
doi: 10.1093/cercor/bhx072.

Glial Calcium Waves are Triggered by Seizure Activity and Not Essential for Initiating Ictal Onset or Neurovascular Coupling

Affiliations

Glial Calcium Waves are Triggered by Seizure Activity and Not Essential for Initiating Ictal Onset or Neurovascular Coupling

Eliza Baird-Daniel et al. Cereb Cortex. .

Abstract

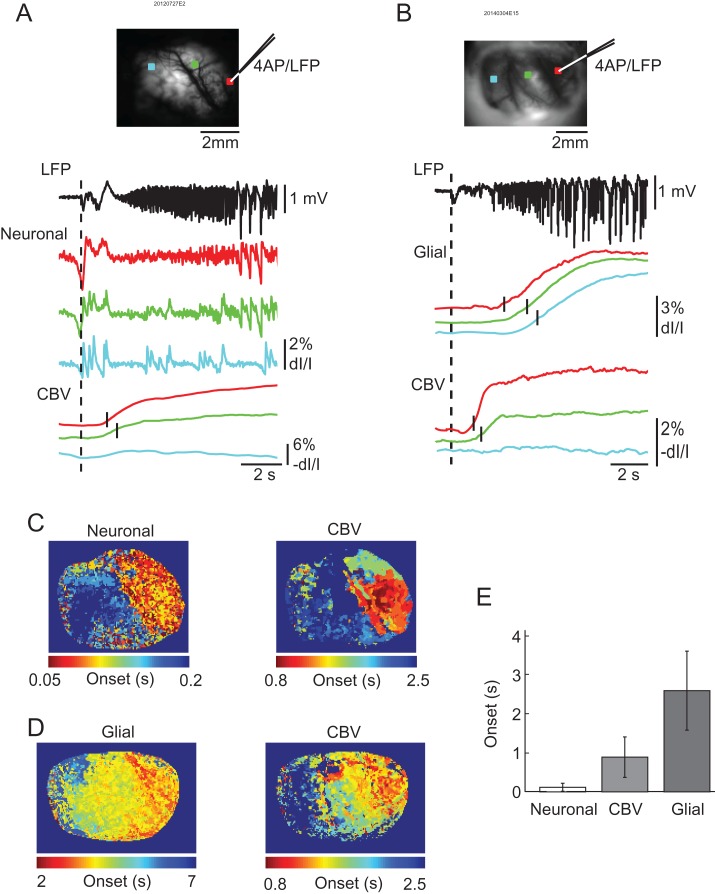
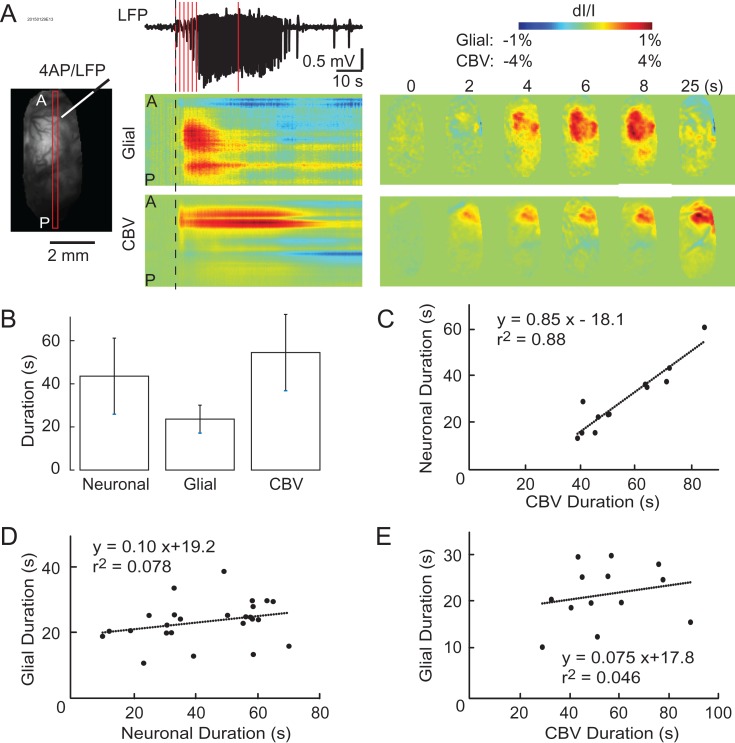
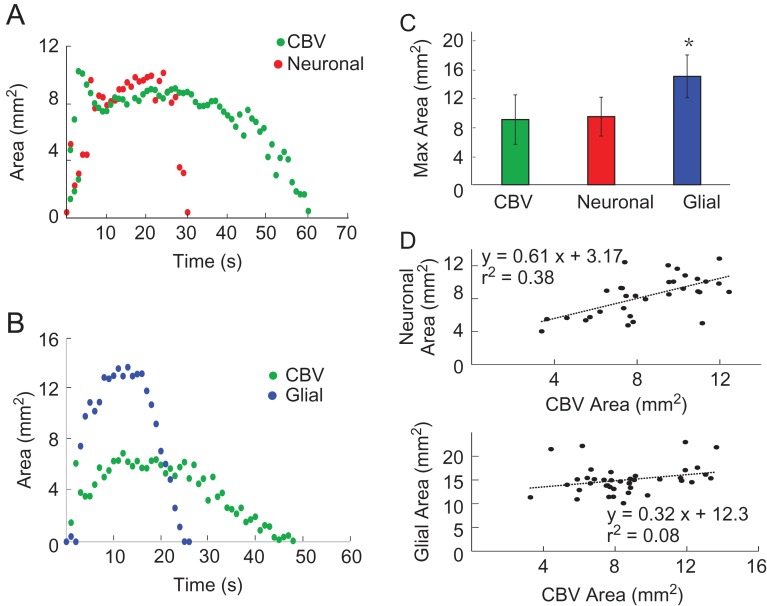
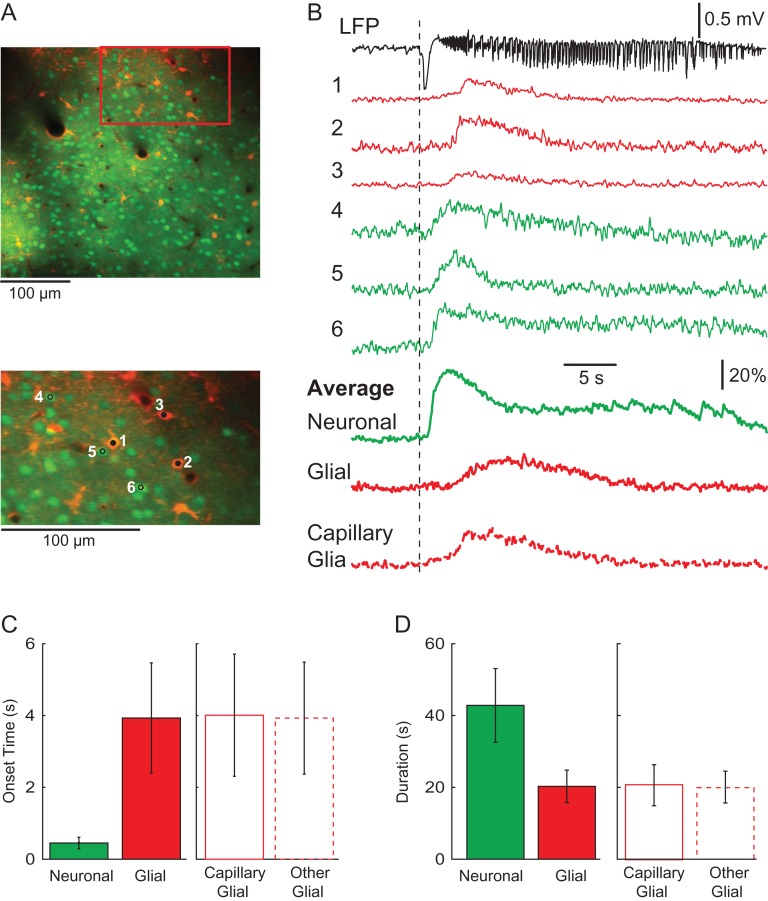
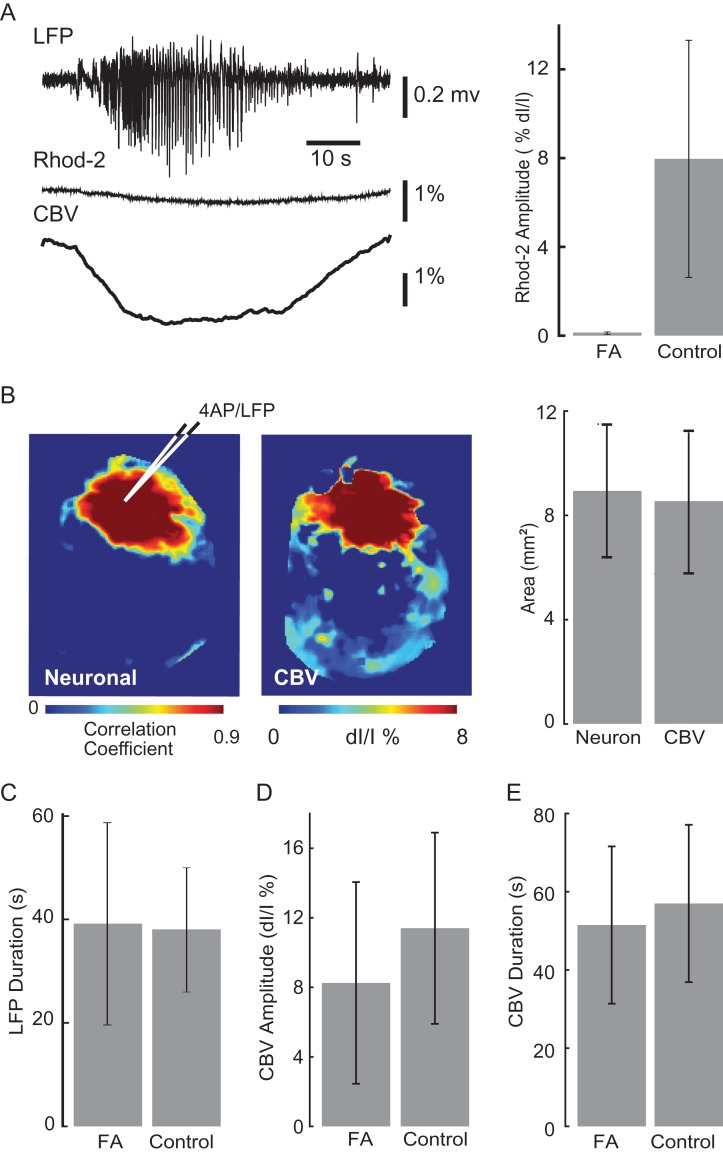
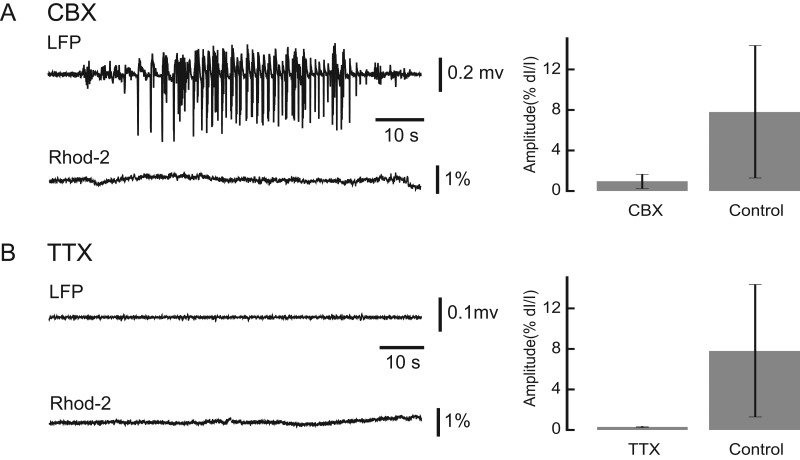
It has been postulated that glia play a critical role in modifying neuronal activity, mediating neurovascular coupling, and in seizure initiation. We investigated the role of glia in ictogenesis and neurovascular coupling through wide-field multicell and 2-photon single cell imaging of calcium and intrinsic signal imaging of cerebral blood volume in an in vivo rat model of focal neocortical seizures. Ictal events triggered a slowly propagating glial calcium wave that was markedly delayed after both neuronal and hemodynamic onset. Glial calcium waves exhibited a stereotypical spread that terminated prior to seizure offset and propagated to an area ~60% greater than the propagation area of neural and vascular signals. Complete blockage of glial activity with fluoroacetate resulted in no change in either neuronal or hemodynamic activity. These ictal glial waves were blocked by carbenoxolone, a gap junction blocker. Our in vivo data reveal that ictal events trigger a slowly propagating, stereotypical glial calcium wave, mediated by gap junctions, that is spatially and temporally independent of neuronal and hemodynamic activities. We introduce a novel ictally triggered propagating glial calcium wave calling into question the criticality of glial calcium wave in both ictal onset and neurovascular coupling.

Keywords: epilepsy; glia; ictogenesis; neurovascular coupling; optical imaging.


Figures

Figure 1.
Figure 1.
Simultaneous LFP, calcium, and IOS imaging of ictal events. (A) Wide-field imaging of neuronal and hemodynamic activities during an ictal event. On the left is the field of view of the imaged cortex with a white ROI indicating the 4-AP injection and LFP recording site where the traces on the right were obtained. OGB-1 signal contains both high- and low-frequency components. IOS imaging shows the relatively slow and delayed increase of CBV during the event. (B) Wide-field imaging of glial and hemodynamic activities during an ictal event. On left is field of view of the imaged cortex with white ROI indicating 4-AP injection and LFP recording site. Rhod-2 (glial) and IOS imaging both result in slow waves that appear to be triggered by the seizure. CBV appears to last longer than both the LFP neuronal and glial components with glial activation terminating first.
Figure 2.
Figure 2.
The onset latency in the neuronal, glial, and hemodynamic signals. (A) A comparison of the neuronal and hemodynamic onsets of an ictal event. The top figure shows the field of view of the imaged cortex with a red box indicating the 4-AP injection and LFP recording. The green and blue boxes indicate 2 other ROIs at differing distances from the 4-AP injection site. Below, traces correspond to ROI of same color and vertical dashed line indicates the ictal onset time of the LFP. The neuronal and LFP traces show similar onset times for the first spike, however, subsequent activity captured by calcium imaging of neuronal revealed spatially dependent propagation patterns. The red and green CBV traces indicate a delay in local blood volume increase due to seizure activity. The short vertical black lines represent the onset time of CBV change in that pixel. No significant blood volume changes were detected from the blue ROI. (B) A comparison between the glial and hemodynamic onsets of a different ictal event. The top figure shows the field of view with 3 ROIs located at different distances to the 4-AP and LFP electrode. Below, traces correspond to ROI of same color. The dashed line indicates the ictal onset time of the LFP. Glial activation was observed in all regions observed and were significantly delayed compared to both LFP and CBV. The delay was also spatially dependent as regions further away from the injection site were more delayed. The black lines represent the onset time of the recorded signal from each ROI. (C) Onset time mapping revealed the spatiotemporal dependence of neuronal and hemodynamic activation during ictal events. The neuronal and CBV figures represent the onset times of ictal activation for individual pixels taken from the seizure shown in (A). Note: neuronal activation occurs earlier than CBV and both signals propagate to similar area. (D) Onset time mapping of the simultaneously recorded glial and CBV change. Note: glial activation was delayed in comparison to that of CBV change but propagated to a larger area than CBV change. (E) Average ictal onset times. The glial onset time is much later than both the neuronal and hemodynamic signals with neuronal activation being very similar to LFP onset. Error bars: SD.
Figure 3.
Figure 3.
Simultaneous imaging demonstrates the temporal variability of the neurovascular components during ictal events. (A) Left: linear ROIs allow for the observation of neuronal, glial, and hemodynamic ictal activities over time. A = anterior, P = posterior. Middle: LFP, glial, and CBV activities during an ictal event. The dashed lines indicate the LFP seizure onset time. Vertical red lines indicate time points at which the activity maps are showed in the right. Right: The spatial propagation of glial and CBV signals at certain time points. Note: CBV change is localized with a more prolonged duration than LFP seizure activity. Glial activation has a shorter duration and further spatial spread than both the LFP and CBV signals. (B) Average normalized ictal duration of neurovascular components. Error bars: SD. (C) The plot of neuronal versus CBV durations with linear correlation. (D and E) The plot of glial duration versus neuronal and CBV durations, respectively.
Figure 4.
Figure 4.
Spatial distribution of neuronal, glial, and CBV changes during seizure evolution. (A) Spatial evolution of neuronal and CBV change during an ictal event over time. (B) Spatial evolution of glial and CBV changes during an ictal event over time. (C) Average of maximum area of ictal activity shows the significant difference between CBV, glial, and neuronal signals. Top: the average of original data. Error bars: SD. (D) Discerning neuronal, glial, and hemodynamic relationships of area of ictal activation. The top figure exhibits the linear relationship between neuronal and CBV maximum area. The lower figure shows the spatial independence between the maximal area of glial activity and CBV spread, with the glial signal spreading to a relatively similar area regardless of the CBV spread.
Figure 5.
Figure 5.
Two-photon imaging of glial and neuronal activities during ictal events. (A) The field of view of the cell population. The orange cells are glia and the green cells are neurons. Note, that blood vessels can be detected and some glia are immediately adjacent to the blood vessels. A red box indicates a ROI that is zoomed in below. Three glia (1–3) and 3 neurons (4–6) were arbitrarily selected to demonstrate the single-cell activity during an ictal event. (B) Activity of individual glia and neurons during an ictal event. Top: the LFP of the ictal event. Traces 1–6 show the calcium signal from glia and neurons during the ictal event. The averaged neuronal and glial activities from the field of view are shown as the thick solid lines below. The averaged signal of glia that are adjacent to blood vessels is shown as the thick dotted line in the bottom. Note the different onset time and duration between glia and neurons. (C) Bar graph depicting the onset times for neuronal and glial signals in respect to LFP. Glial signals are separated into capillary and other. Note the longer onset delay of all glial signals as compared to the neuronal calcium signal. Furthermore, there is no significant difference between the 2 glial types shown here. (D) Bar graph depicting the duration of neuronal and glial signals in seconds. Note the significantly longer duration of the neuronal signal in comparison to the average glial signal. Glial signals are also separated into capillary and other cell types, none of which differ significantly in duration.
Figure 6.
Figure 6.
Simultaneous imaging of CBV and glial activities during ictal events after FA application. (A) LFP, Rhod-2, and IOS imaging of glial and CBV signals, respectively, during an ictal event after FA bath application. The glial signal is abolished after exposure to FA while CBV signal does not differ significantly from control. At right, the averaged amplitude of Rhod-2 signal during FA application and control condition are shown. (B) Spatial spread of neuronal activity and hemodynamic activity with FA application. Left, an example of the spatial spread of neuronal and CBV signals after FA application in one animal. The averaged neuronal and CBV area are shown on the right. (CE) The comparison of averaged values during FA application versus control condition. (C) The seizure duration recorded with LFP. (D) The amplitude of hemodynamic changes. (E) The duration of hemodynamic changes. Error bar: SD.
Figure 7.
Figure 7.
The neuronal and glia activities after drug application. (A) The effect of CBX. Left, the LFP and Rhod-2 traces recorded after CBX application. Note, seizures occur after CBX application, but negligible Rhod-2 deflection was observed. Right: averaged Rhod-2 amplitude under CBX and control condition. (B) The effect of TTX. Left, the LFP and Rhod-2 traces recorded with TTX application. After TTX application, neither seizures nor glial activity were observed. Right: averaged Rhod-2 amplitude under TTX and control condition. Error bars: SD.

References

    1. Aguado F, Espinosa-Parrilla JF, Carmona MA, Soriano E. 2002. Neuronal activity regulates correlated network properties of spontaneous calcium transients in astrocytes in situ. J Neurosci. 22:9430–9444. - PMC - PubMed
    1. Attwell D, Buchan AM, Charpak S, Lauritzen M, Macvicar BA, Newman EA. 2010. Glial and neuronal control of brain blood flow. Nature. 468:232–243. - PMC - PubMed
    1. Avoli M, de Curtis M, Gnatkovsky V, Gotman J, Kohling R, Levesque M, Manseau F, Shiri Z, Williams S. 2016. Specific imbalance of excitatory/inhibitory signaling establishes seizure onset pattern in temporal lobe epilepsy. J Neurophysiol. 115:3229–3237. - PMC - PubMed
    1. Bazargani N, Attwell D. 2016. Astrocyte calcium signaling: the third wave. Nat Neurosci. 19:182–189. - PubMed
    1. Bonder DE, McCarthy KD. 2014. Astrocytic Gq-GPCR-linked IP3R-dependent Ca2+ signaling does not mediate neurovascular coupling in mouse visual cortex in vivo. J Neurosci. 34:13139–13150. - PMC - PubMed

Publication types

MeSH terms