. 2018 May 1;28(5):1549-1567.
doi: 10.1093/cercor/bhx052.

Single Units in the Posterior Parietal Cortex Encode Patterns of Bimanual Coordination

Affiliations

Single Units in the Posterior Parietal Cortex Encode Patterns of Bimanual Coordination

Eric Mooshagian et al. Cereb Cortex. .

Abstract

Bimanual coordination is critical for a broad array of behaviors. Drummers, for example, must carefully coordinate movements of their 2 arms, sometimes beating on the same drum and sometimes on different ones. While coordinated behavior is well-studied, the early stages of planning are not well understood. In the parietal reach region (PRR) of the posterior parietal cortex (PPC), the presence of neurons that modulate when either arm moves by itself has been taken as evidence for a role in bimanual coordination. To test this notion, we recorded neurons during both unilateral and bimanual movements. We find that the activity that precedes an ipsilateral arm movement is primarily a sensory response to a target in the neuron's visual receptive field and not a plan to move the ipsilateral arm. In contrast, the activity that precedes a contralateral arm movement is the sum of a movement plan plus a sensory response. Despite not coding ipsilateral arm movements, about half of neurons discriminate between different patterns of bimanual movements. These results provide direct evidence that PRR neurons represent bimanual reach plans, and suggest that bimanual coordination originates in the sensory-to-motor processing stream prior to the motor cortex, within the PPC.


Figures
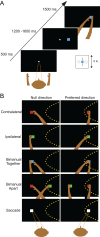
Figure 1.
Figure 1.
Delayed movement tasks. (A) A peripheral target (blue in this example; see below) instructs the spatial location and effector to be used (eyes or arm) for each trial. The stimulus remains visible during the delay period. With the disappearance of the central fixation point (go signal), animals either reach or make saccadic eye movements to the visuospatial location of the target. The inset shows the arrangement of the plexiglass divider (vertical black line) that was mounted on the front of the projection screen and capacitive sensors (dashed circles) that were mounted behind the projection screen at each target location. See text for details. (B) On reach trials, movements were made with the contralateral arm only, ipsilateral arm only, both arms together, or each arm to a different target. On saccade trials, only the eyes moved. Movements were either in the preferred direction or the null direction, defined as the location 180° from the preferred direction relative to the central fixation. Movement directions and movement types were randomly interleaved. A green peripheral target instructed a reach with the left arm, red instructed a reach with the right arm, blue instructed a reach with both arms, and white instructed a saccade.
Figure 2.
Figure 2.
Localization and preferred directions of recorded neurons. (A) Anatomical localization of recording sites in each monkey. Coordinates of recorded neurons are projected to a single MRI section perpendicular to the path of the recording electrode (left; see Methods). The right side shows the same selection in expanded view. Major landmarks are shown. IPS, intraparietal sulcus; Midline, longitudinal fissure; POS, parieto-occipital sulcus; STS, superior temporal sulcus. The colored regions are from Lewis and Van Essen (2000); LIP, lateral intraparietal area; LOP, lateral occipital-parietal area; MIP, medial intraparietal area; PO, parietal-occipital area. The left, right, anterior, and posterior directions are labeled as L, R, A, and P, respectively. The size of each circle indicates the number of neurons recorded along that track. (B) Density function of the cosine fit for the contralateral (red), ipsilateral (green), and saccade (black) conditions with respect to bimanual together (vertical blue line). Data are from 96 neurons for which data in all 8 stimulus locations were collected. (C) Preferred directions for all 114 neurons in the data set. The 8 bars arranged in a circle represent the preferred directions for the population of neurons. The dark and light shadings indicate neurons from M1 and M2, respectively. The dark and light arrows indicate the vector sum of the preferred directions for each animal.
Figure 3.
Figure 3.
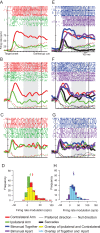
Responses of 3 example PRR neurons in the delayed reach tasks. Each row is a different neuron. (AC) Each panel shows the responses to contralateral (red) and ipsilateral (green) arm movements, in the preferred (solid) or null (dashed) directions, with raster plots in the upper part and the mean firing rates in the lower part of each panel. Rasters are shown for the preferred direction trials. Each tic represents a spike and each row represents a single trial. Vertical lines indicate the target onset and earliest go cue. Shaded region indicates area used to measure delay period activity. (A) A neuron modulated by planned movements of the contralateral arm only. (B) A neuron modulated by planned movements of either arm, but with a larger effect for the contralateral arm. (C) A neuron modulated equally by planned movements of either arm. (D) Histogram of modulation (delay period firing rate in preferred direction trials minus delay period firing rate in null direction trials) for reaches with the contralateral (red) and ipsilateral (green) arms. Two separate histograms are plotted, one on top of the other, with the overlap indicated by yellow. A single preferred direction is determined for each neuron, based on all 3 single target reach conditions (contralateral, ipsilateral, bimanual together; see Methods). As a result, it is possible for a single preferred direction movement type to evoke a negative firing rate. This occurs more often for conditions that evoke weak responses, like ipsilateral reaches. In almost every case, the negative modulation for ipsilateral reaches is not statistically significant (14 of 15 cases, P > 0.05). Arrows indicate means. Bin width is 10 sp/s. (EG) Same format and neurons as (AC), with additional traces for bimanual-together (blue) or bimanual-apart reaches (contralateral arm in preferred direction; purple). For all 3 neurons, bimanual responses were similar to the unimanual contralateral arm response. (H) Histogram of modulation for bimanual-together and bimanual-apart reaches (contralateral arm in preferred direction). The light blue region indicates overlap of values for bimanual-together and bimanual-apart reaches. Arrows indicate means. Bin width is 10 sp/s.
Figure 4.
Figure 4.
Contribution of each factor to the component regression model. The height of each bar indicates the total variance explained by including that factor along with any factors to its left. (This value is also printed at the base of each bar.) The factors are ordered by their cumulative contribution to the model fit, as determined by AIC. The dark shading indicates the change in variance explained by inclusion of the factor. Cp, contralateral reach in the preferred direction; Cn, contralateral reach in the null direction; Ip, ipsilateral reach in the preferred direction; In, ipsilateral reach in the null direction.
Figure 5.
Figure 5.
PRR population activity for all 10 conditions. Across the population, PRR neurons respond when the animal prepares a movement of the eyes, eyes plus one arm or eyes plus both arms. Three levels of activity are apparent. Firing is high when the contralateral arm will move in the preferred direction, regardless of what the ipsilateral arm does (red, contralateral arm moves by itself; blue, contralateral and ipsilateral arms move together to a single target; purple, contralateral and ipsilateral arms move in the preferred and null directions, respectively). An intermediate level of activation occurs when only the eyes move in the preferred direction (black), when only the ipsilateral arm moves in the preferred direction (green), or when the ipsilateral arm moves in the preferred direction and the contralateral arm moves in the null direction (dashed purple). Activity is suppressed below baseline for any movements in the non-preferred direction (dashed blue, red, green, and black). Vertical lines indicate target onset and earliest go cue. The broad pink surrounding the preferred and non-preferred red lines indicate ±1 SEM for that condition, computed over 114 neurons. Standard errors for the other conditions are comparable. Gray shading indicates the interval used to measure delay activity.
Figure 6.
Figure 6.
Scatterplot of the individual neuron firing rates for preferred direction saccades versus preferred direction reaches with the ipsilateral arm. Each point represents a single neuron (M1, n = 59, filled circles; M2, n = 55, open circles). The unity line is in gray. The black line is a type-II regression line.
Figure 7.
Figure 7.
Comparison of 3 models of bimanual activity. The left, middle, and right columns are each based on a different hypothesis. Left column: The bimanual reach response equals the contralateral arm reach response. Middle column: The bimanual reach response equals the sum of the contralateral and ipsilateral arm responses. Right column: The bimanual reach response equals the ipsilateral arm reach response. The upper row is for bimanual together movements. The lower row is for bimanual-apart movements (contralateral arm in preferred direction). Scatterplots contrast predicted and observed firing rates under each hypothesis, with each point representing one neuron. The unity line is indicated in gray. The broad lines through the data points are type-II regression lines. In each row, the first model provides a better fit to the data. See text for details.
Figure 8.
Figure 8.
Additional effects not fully accounted for by the 2-factor model. (A) Time course of delay period activity for reaches with the ipsilateral arm alone (green) and saccades alone (black) for one example neuron. Activity is increased for saccades compared with ipsilateral arm reaches. Format as in Figs 3 and 5. (B) Histogram of effect size of saccade minus unimanual ipsilateral reaches for all neurons. The example neuron from A is indicated in red. (C) Time course of delay period activity for reaches with the contralateral arm alone (red), the contralateral and ipsilateral arms moving to the same target (blue; bimanual-together), and the contralateral and ipsilateral arms moving to different targets (purple; bimanual-apart), for one example neuron. Activity is increased for bimanual-apart (contralateral arm in preferred direction) reaches and decreased for bimanual-together reaches, compared with the contralateral arm alone. Format as in Figs 3 and 5. (D) Histogram of firing rate differences, normalized by standard deviation (effect size), of bimanual-together minus unimanual contralateral arm reaches for all neurons. The example neuron from C is indicated in red. (E) Histogram of effect size of bimanual-apart (contralateral arm in preferred direction) minus unimanual contralateral reaches for all neurons. The example neuron from C is indicated in red. Solid shading indicates significant differences (t-tests; P < 0.05). See also SupplementaryFig. S3.
Figure 9.
Figure 9.
Combination regression models. (A) Variance explained by the 6 factors that contribute to the combination model; compared with Fig. 4. The height of each bar indicates the total variance explained by including that factor along with any factors to its left. (This value is also printed at the base of each bar.) The factors are ordered by their cumulative contribution to the model fit, as determined by AIC. The dark shading indicates the change in variance explained by inclusion of each factor. RF = target in the receptive field; Cp = contralateral reach in the preferred direction; An = bimanual-apart, contralateral arm in the null direction; Tp = bimanual-together in the preferred direction; Ap = bimanual-apart, contralateral arm in the preferred direction; Ip = ipsilateral reach in the preferred direction; Sp = saccade in the preferred direction; In = ipsilateral reach in the null direction; Cn = contralateral reach in the null direction. (B) Scatterplot of the individual r2 values obtained in the 4 factor combination model (RF, Cp, An, Tp) versus the 4 factor component model (Cp, Ip, Cn, In). Each point represents a single neuron, and most points fall above the identity line (gray).
Figure 10.
Figure 10.
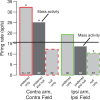
Mean delay period firing rates for movements of each arm to a target in its own hemifield. Responses are shown sorted by whether the movement is into or out of the response field (gray bars, “Preferred only” and “Null only”) or combined (“Preferred and null”). The horizontal black line indicates the mean firing rate during the baseline period (500–300 ms prior to target presentation). N is the number of neurons contributing to each bar. The colored borders indicate the corresponding conditions in Fig. 5. The 2 dark bars simulate the conditions from typical human BOLD experiments, where targets are placed only on the same side of the body as the reaching arm, and preferred directions are not taken into account. *Significant difference from the condition-specific baseline at P < 0.05. (Each condition-specific baseline varies slightly but non-significantly from the mean baseline).

References

    1. Batista AP, Andersen RA. 2001. The parietal reach region codes the next planned movement in a sequential reach task. J Neurophysiol. 85:539–544. - PubMed
    1. Battaglia-Mayer A, Ferraina S, Genovesio A, Marconi B, Squatrito S, Molinari M, Lacquaniti F, Caminiti R. 2001. Eye-hand coordination during reaching. II. An analysis of the relationships between visuomanual signals in parietal cortex and parieto-frontal association projections. Cereb Cortex. 11:528–544. - PubMed
    1. Battaglia-Mayer A, Ferraina S, Mitsuda T, Marconi B, Genovesio A, Onorati P, Lacquaniti F, Caminiti R. 2000. Early coding of reaching in the parietooccipital cortex. J Neurophysiol. 83:2374–2391. - PubMed
    1. Battaglia-Mayer A, Ferrari-Toniolo S, Visco-Comandini F, Archambault PS, Saberi-Moghadam S, Caminiti R. 2013. Impairment of online control of hand and eye movements in a monkey model of optic ataxia. Cereb Cortex. 23:2644–2656. - PubMed
    1. Breveglieri R, Kutz DF, Fattori P, Gamberini M, Galletti C. 2002. Somatosensory cells in the parieto-occipital area V6A of the macaque. Neuroreport. 13:2113–2116. - PubMed

Publication types