. 2017 Jun 2;45(10):5797-5817.
doi: 10.1093/nar/gkx194.

New inhibitor targeting human transcription factor HSF1: effects on the heat shock response and tumor cell survival

Affiliations

New inhibitor targeting human transcription factor HSF1: effects on the heat shock response and tumor cell survival

Nuria Vilaboa et al. Nucleic Acids Res. .

Abstract

Comparative modeling of the DNA-binding domain of human HSF1 facilitated the prediction of possible binding pockets for small molecules and definition of corresponding pharmacophores. In silico screening of a large library of lead-like compounds identified a set of compounds that satisfied the pharmacophoric criteria, a selection of which compounds was purchased to populate a biased sublibrary. A discriminating cell-based screening assay identified compound 001, which was subjected to systematic analysis of structure-activity relationships, resulting in the development of compound 115 (IHSF115). IHSF115 bound to an isolated HSF1 DNA-binding domain fragment. The compound did not affect heat-induced oligomerization, nuclear localization and specific DNA binding but inhibited the transcriptional activity of human HSF1, interfering with the assembly of ATF1-containing transcription complexes. IHSF115 was employed to probe the human heat shock response at the transcriptome level. In contrast to earlier studies of differential regulation in HSF1-naïve and -depleted cells, our results suggest that a large majority of heat-induced genes is positively regulated by HSF1. That IHSF115 effectively countermanded repression in a significant fraction of heat-repressed genes suggests that repression of these genes is mediated by transcriptionally active HSF1. IHSF115 is cytotoxic for a variety of human cancer cell lines, multiple myeloma lines consistently exhibiting high sensitivity.


Figures

Figure 1.
Figure 1.
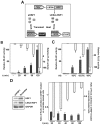
Characterization of Z74 cells. (A) Z74 cells harbor an RLUC gene that is linked to an HSPA7 gene promoter. The latter promoter is responsive to endogenous human transcription factor HSF1 (eHSF1). Z74 cells also contain a CMV promoter-driven gene for chimeric transcription factor LEXA-HSF1 as well as a FLUC gene controlled by a promoter responsive to LEXA-HSF1. Transient heat stimulates the transcriptional activities of eHSF1 and LEXA-HSF1, resulting in increased expression of the FLUC and RLUC genes. (B and C) RLUC and FLUC activities in Z74 cells increase as a function of the intensity of their heat exposure. Cells were left untreated (−), were heated (HS) at 42°C for the indicated periods (B) or were heated at different temperatures for 30 min (C). RLUC (dark columns) and FLUC (light columns) activities were determined 6 h after heat treatment. *P < 0.05; comparing to RLUC activity of untreated cells; #P < 0.05; comparing to FLUC activity of untreated cells. (D) Ratios between RLUC and FLUC activities in HSF1 shRNA and control shRNA-expressing cells heated at 43°C for the indicated periods. Levels of HSF1 and LEXA-HSF1 were assessed by WB (on the left).
Figure 2.
Figure 2.
(A) Inhibitory activities of IHSF001, IHSF058 and IHSF115 in the Z74 screening assay. Z74 cells, exposed to the inhibitors at the indicated concentrations for 2 h, or exposed to vehicle (−), were heat-treated (HS) at 43°C for 30 min. After 6 h of post-incubation at 37°C (in the continued presence of the inhibitors), RLUC (dark columns) and FLUC (light columns) activities were determined. *, #: P < 0.05; comparing to heat-treated cells exposed to vehicle. (B–D) Docking of IHSF115 into predicted cavity A of human HSF1. (B) Images showing the local environment of the R3-methyl in docked IHSF115. The residues in close proximity to the methyl group are V70, K80, T97 and F99, which residues partly define the cavity A binding site. The surface shows that there is potentially very limited room for growth at the R3 position. (C) The residues in close proximity to the buried six-membered dihydro-oxazine ring and scaffold double-bond are shown. The surface also reveals that there is limited potential for growth from the double bond. (D) Schematic representation of residues in close proximity to IHSF115. (E and F) Docking of IHSF001 into predicted cavity A of human HSF1 (E). Images showing the local environment of the R3-unsubstituted amide NH in docked IHSF001. (F) Residues in close proximity to the ethyl ester group and scaffold double-bond. (G) SPR sensorgrams documenting interactions between IHSF115 or IHSF058 and (His-tagged) recombinant HSF1WT or HSF1DBD proteins.
Figure 3.
Figure 3.
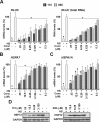
(A–C) Inhibitory activities of IHSF058 and IHSF115 assessed at the transcript level by RT-qPCR. Z74 cells, exposed to the inhibitors at the indicated concentrations for 2 h, or exposed to vehicle (−), were heat-treated (HS) at 43°C for 30 min and post-incubated at 37°C for 1 h (in the continued presence of inhibitors). (A) Relative RLUC mRNA (left graph) and RLUC total RNA (right graph) levels. (B) Relative HSPA7 mRNA levels. (C) Relative HSPA1A mRNA levels. *P < 0.05; comparing to heat-treated cells exposed to vehicle. (D) Inhibition of HSP72 expression assessed by WB. Z74 cells were treated as under (A–C), except that post-incubation at 37°C was for 6 h.
Figure 4.
Figure 4.
On the mechanism of action of IHSF. (A) Effects on HSF1 DNA-binding ability, stability and oligomerization. Analyzed were extracts from HeLa cells that were vehicle-treated or pre-treated for 2 h with the indicated concentrations of IHSF058 or IHSF115 and then exposed to 43°C heat for 30 min (HS). Top: HSF1 DNA-binding ability determined by EMSA. The arrows indicate the positions of the major HSF1–HSE probe complexes. Middle: HSF1 immunoblot. GAPDH served as loading control. Bottom: HSF1 immunoblot after EGS cross-linking of HSF1 in oligomers. The positions of pre-stained molecular weight marker proteins (MW, in thousands) are indicated to the left. Asterisks indicate the positions of monomeric and trimeric HSF1. (B) Top: effects on the recruitment of HSF1 to the HSPA1A promoter. HeLa cells, exposed to IHSF058 or IHSF115 at 12.5 μM, or exposed to vehicle (−), were heat-treated (HS) at 43°C for 30 min and then processed for ChIP using anti-HSF1 or anti-F4/80 LR (control) antibodies. *P < 0.05; comparing to heat-treated cells exposed to vehicle. Bottom: anti-HSF1 WB of extracts from cells exposed to identical conditions. (C) Co-immunoprecipitation of ATF1. Left and right halves show results from independent experiments. CTF135 cells expressing a C-terminally FLAG-tagged HSF1 were vehicle-treated (−) or pre-treated with 12.5 or 25 μM IHSF115, heat-treated (HS) at 43°C for 30 min and then processed for immunoprecipitation with an anti-FLAG antibody. Immunoprecipitates (IP:FLAG) and aliquots of extracts (input) were analyzed by anti-FLAG and anti-ATF1 immunoblot.
Figure 5.
Figure 5.
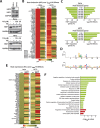
Transcriptome analyses. (A) Top: WB showing expression of HSF1 and HSF2 in HeLa and HF73 cells, respectively. Lower blots: HeLa or HF73 cells were vehicle-treated or exposed to 12.5 or 25 μM IHSF115 for 2 h, heat-heated at 43°C for 30 min and post-incubated at 37°C for 1 h or vehicle-treated and incubated at 37°C for 3.5 h. Extracts were analyzed for HSF1 levels. (B and E) HeLa and HF73 cells were similarly treated (at 25 μM IHSF115), and RNA was extracted and analyzed using Affymetrix microarrays. HT: heat-treated and IHSF115-exposed; H: heat-treated; C: vehicle-treated. (B) Heatmaps showing heat inducibility (H/C) in the left columns and effects of IHSF115 on heat-induced expression (IHSF115 effects: (HT-C)/(H-C)) in the right columns for the 50 most highly heat-induced genes in HeLa cells. *P < 0.05 between HT and H. (C) Left: fractions of HSF1-regulated genes in groups of 100 heat-induced genes. Right: IHSF115 Effects ((HT-C)/(H-C)). See the ‘Results’ section for further explanations. *P < 0.05; comparing to group 1–100. (D) HSE sequences. Top: consensus (gene-proximal) HSE derived from a group of 30 heat-induced, HSF1-regulated genes. Bottom: consensus HSE derived from a group of classical heat shock genes. The logograms were generated at http://weblogo.berkeley.edu. (E) Heatmaps as in (B), but for the 50 most highly heat-repressed genes in HeLa cells. (F) GO analyses (biological processes). Light green: heat-induced, positively HSF1-regulated genes; red: heat-repressed, negatively HSF1-regulated genes.
Figure 6.
Figure 6.
(A) Viability of HeLa cells that had been exposed for 96 h to the indicated concentrations of IHSF001, IHSF058 or IHSF115, or to vehicle (−). *P < 0.05; comparing to cells exposed to vehicle. (B) Heatmap summarizing viability data obtained for different cell lines. AML: acute myeloid leukemia. MPNST: malignant peripheral nerve sheath tumor. Wt: wild-type. Mut: mutated. EC50: dose causing a 50% reduction in viability.
Figure 7.
Figure 7.
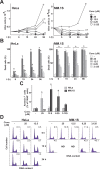
IHSF115-induced cell death. (A and B) HeLa or MM.1S cells were exposed to the indicated concentrations of IHSF115, or to vehicle (−), for 6, 15, 24 or 96 h. Trypan blue dye exclusion was used to determine numbers of alive cells (A) and percentages of necrotic cells (B). *P < 0.05; comparing to cells exposed to vehicle at each time point. (C) HeLa and MM.1S cells were exposed to the indicated concentrations of IHSF115, or to vehicle (−), for 6 h and then double-stained with Annexin V-FITC and 7-AAD. Percentages of early apoptotic cells (Annexin V+/7-AAD-) are shown. *P < 0.05; comparing to the corresponding cell type exposed to vehicle. (D) DNA contents of HeLa or MM.1S cells that had been exposed to the indicated concentrations of IHSF115, or to vehicle (−), for 6, 15 and 24 h. Percentages of apoptotic cells are indicated within the histograms.

References

    1. Richter K., Haslbeck M., Buchner J.. The heat shock response: life on the verge of death. Mol. Cell. 2010; 40:253–266. - PubMed
    1. Hartl F.U., Bracher A., Hayer-Hartl M.. Molecular chaperones in protein folding and proteostasis. Nature. 2011; 475:324–332. - PubMed
    1. Ananthan J., Goldberg A.L., Voellmy R.. Abnormal proteins serve as eukaryotic stress signals and trigger the activation of heat shock genes. Science. 1986; 232:522–524. - PubMed
    1. Hightower L.E. Cultured animal cells exposed to amino acid analogues or puromycin rapidly synthesize several polypeptides. J. Cell. Physiol. 1980; 102:407–427. - PubMed
    1. McMillan D.R., Xiao X., Shao L., Graves K., Benjamin I.J.. Targeted disruption of heat shock transcription factor 1 abolishes thermotolerance and protection against heat-inducible apoptosis. J. Biol. Chem. 1998; 273:7523–7528. - PubMed

MeSH terms