

Amylases StAmy23, StBAM1 and StBAM9 regulate cold-induced sweetening of potato tubers in distinct ways
- PMID: 28369567
- PMCID: PMC5447890
- DOI: 10.1093/jxb/erx076
Amylases StAmy23, StBAM1 and StBAM9 regulate cold-induced sweetening of potato tubers in distinct ways
Abstract
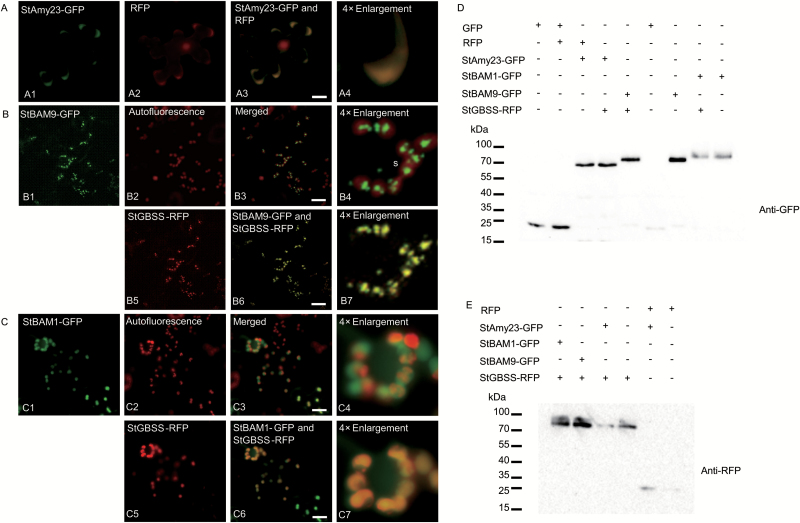
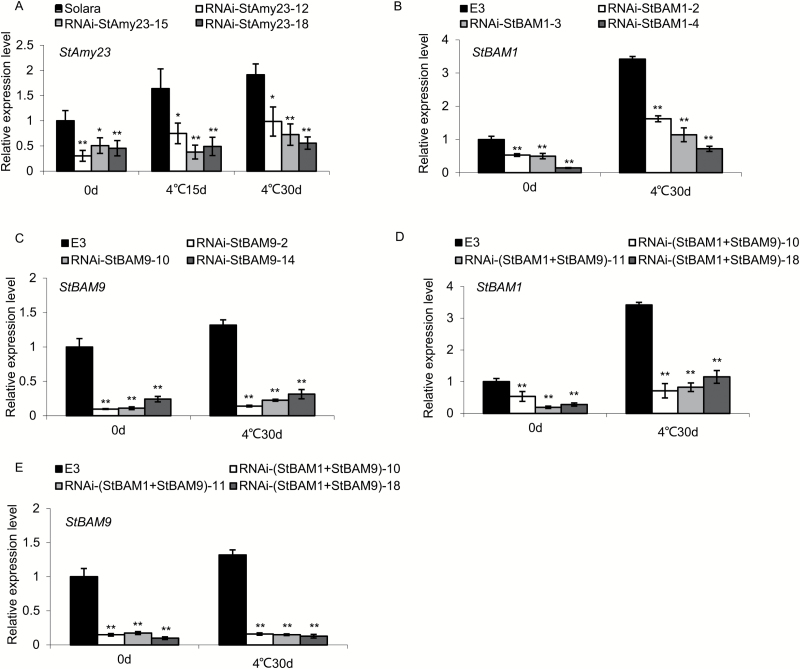
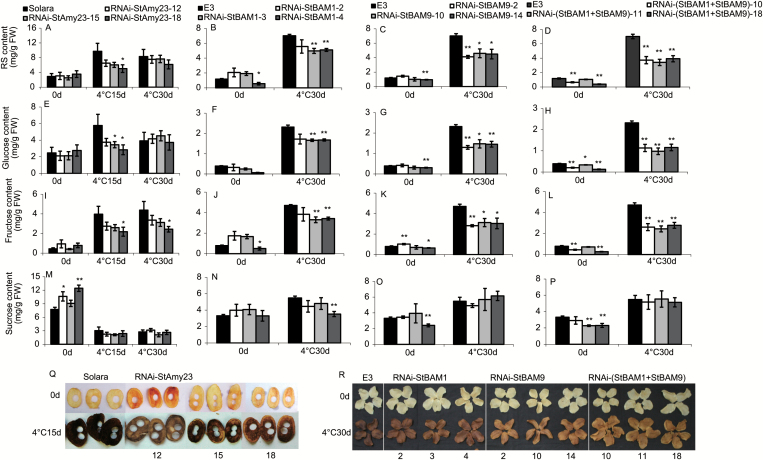
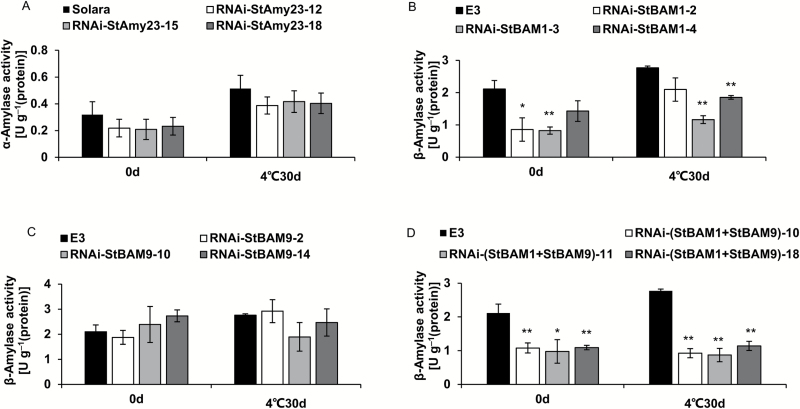
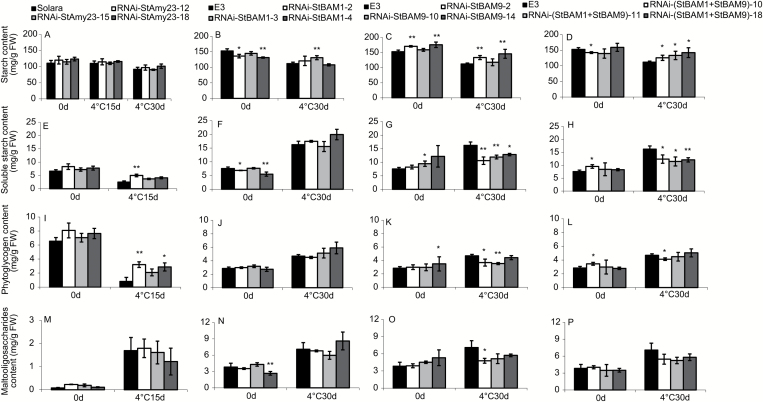
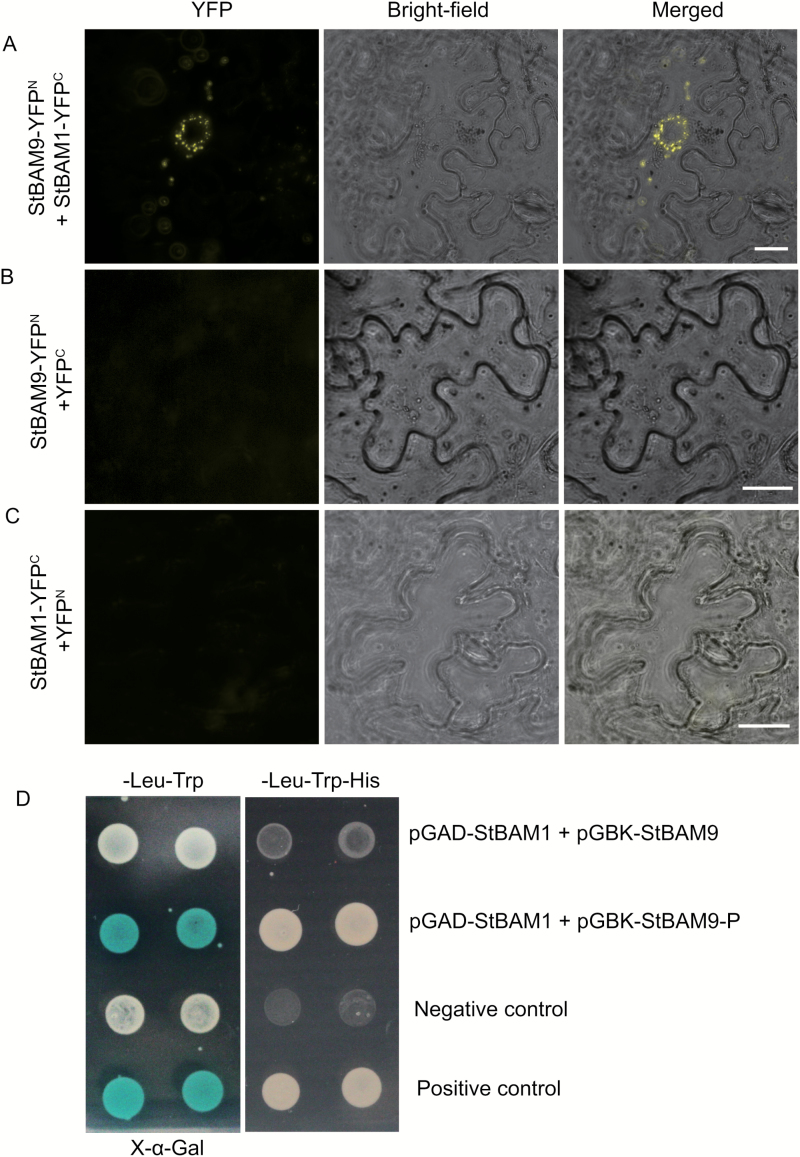
Cold-induced sweetening (CIS) in potato is detrimental to the quality of processed products. Conversion of starch to reducing sugars (RS) by amylases is considered one of the main pathways in CIS but is not well studied. The amylase genes StAmy23, StBAM1, and StBAM9 were studied for their functions in potato CIS. StAmy23 is localized in the cytoplasm, whereas StBAM1 and StBAM9 are targeted to the plastid stroma and starch granules, respectively. Genetic transformation of these amylases in potatoes by RNA interference showed that β-amylase activity could be decreased in cold-stored tubers by silencing of StBAM1 and collective silencing of StBAM1 and StBAM9. However, StBAM9 silencing did not decrease β-amylase activity. Silencing StBAM1 and StBAM9 caused starch accumulation and lower RS, which was more evident in simultaneously silenced lines, suggesting functional redundancy. Soluble starch content increased in RNAi-StBAM1 lines but decreased in RNAi-StBAM9 lines, suggesting that StBAM1 may regulate CIS by hydrolysing soluble starch and StBAM9 by directly acting on starch granules. Moreover, StBAM9 interacted with StBAM1 on the starch granules. StAmy23 silencing resulted in higher phytoglycogen and lower RS accumulation in cold-stored tubers, implying that StAmy23 regulates CIS by degrading cytosolic phytoglycogen. Our findings suggest that StAmy23, StBAM1, and StBAM9 function in potato CIS with varying levels of impact.
Keywords: cold-induced sweetening; potato; reducing sugar; starch degradation; tuber.; α-Amylase; β-amylase.
© The Author 2017. Published by Oxford University Press on behalf of the Society for Experimental Biology.
Figures
Similar articles
-
The potato amylase inhibitor gene SbAI regulates cold-induced sweetening in potato tubers by modulating amylase activity.Plant Biotechnol J. 2014 Sep;12(7):984-93. doi: 10.1111/pbi.12221. Epub 2014 Jul 1. Plant Biotechnol J. 2014. PMID: 24985879
-
Dependence of the content of starch and reducing sugars on the level of expression of the genes of β-amylases StBAM1 and StBAM9 and the amylase inhibitor StAI during long-term low-temperature storage of potato tubers.Vavilovskii Zhurnal Genet Selektsii. 2022 Oct;26(6):507-514. doi: 10.18699/VJGB-22-62. Vavilovskii Zhurnal Genet Selektsii. 2022. PMID: 36313822 Free PMC article.
-
SbRFP1 regulates cold-induced sweetening of potato tubers by inactivation of StBAM1.Plant Physiol Biochem. 2019 Mar;136:215-221. doi: 10.1016/j.plaphy.2019.01.019. Epub 2019 Jan 19. Plant Physiol Biochem. 2019. PMID: 30690278
-
[Starch metabolism in potato tubers].Postepy Biochem. 2009;55(4):441-6. Postepy Biochem. 2009. PMID: 20201358 Review. Polish.
-
Progress in improving processing attributes in potato.Trends Plant Sci. 2003 Jul;8(7):310-2. doi: 10.1016/S1360-1385(03)00130-4. Trends Plant Sci. 2003. PMID: 12878011 Review.
Cited by
-
Comprehensive Identification of the β-Amylase (BAM) Gene Family in Response to Cold Stress in White Clover.Plants (Basel). 2024 Jan 5;13(2):154. doi: 10.3390/plants13020154. Plants (Basel). 2024. PMID: 38256708 Free PMC article.
-
Comparative analysis of the transcriptome during single-seed formation of Castanea henryi: regulation of starch metabolism and endogenous hormones.BMC Plant Biol. 2023 Feb 13;23(1):90. doi: 10.1186/s12870-023-04102-4. BMC Plant Biol. 2023. PMID: 36782110 Free PMC article.
-
New insights into the origin and evolution of α-amylase genes in green plants.Sci Rep. 2019 Mar 20;9(1):4929. doi: 10.1038/s41598-019-41420-w. Sci Rep. 2019. PMID: 30894656 Free PMC article.
-
Comparing the differences in quality profiles and antioxidant activity in seven pumpkin cultivars (Cucurbita moschata and Cucurbita maxima) at harvest and during postharvest storage.Food Chem X. 2024 Apr 15;22:101383. doi: 10.1016/j.fochx.2024.101383. eCollection 2024 Jun 30. Food Chem X. 2024. PMID: 38665625 Free PMC article.
-
Genetic Loci Conferring Reducing Sugar Accumulation and Conversion of Cold-Stored Potato Tubers Revealed by QTL Analysis in a Diploid Population.Front Plant Sci. 2018 Mar 9;9:315. doi: 10.3389/fpls.2018.00315. eCollection 2018. Front Plant Sci. 2018. PMID: 29593769 Free PMC article.
References
-
- Amrein TM, Bachmann S, Noti A, et al. 2003. Potential of acrylamide formation, sugars, and free asparagine in potatoes: a comparison of cultivars and farming systems. Journal of Agricultural and Food Chemistry 51, 5556–5560. - PubMed
-
- Asatsuma S, Sawada C, Itoh K, Okito M, Kitajima A, Mitsui T. 2005. Involvement of α-amylase I-1 in starch degradation in rice chloroplasts. Plant & Cell Physiology 46, 858–869. - PubMed
-
- Bahaji A, Li J, Ovecka M, et al. 2011. Arabidopsis thaliana mutants lacking ADP-glucose pyrophosphorylase accumulate starch and wild-type ADP-glucose content: further evidence for the occurrence of important sources, other than ADP-glucose pyrophosphorylase, of ADP-glucose linked to leaf starch biosynthesis. Plant & Cell Physiology 52, 1162–1176. - PubMed
-
- Baunsgaard L, Lütken H, Mikkelsen R, Glaring MA, Pham TT, Blennow A. 2005. A novel isoform of glucan, water dikinase phosphorylates pre-phosphorylated α-glucans and is involved in starch degradation in Arabidopsis. The Plant Journal 41, 595–605. - PubMed
Publication types
MeSH terms
Substances
LinkOut - more resources
Full Text Sources
Other Literature Sources
