. 2017 May 19;45(9):5586-5601.
doi: 10.1093/nar/gkx186.

Insights into Watson-Crick/Hoogsteen breathing dynamics and damage repair from the solution structure and dynamic ensemble of DNA duplexes containing m1A

Affiliations

Insights into Watson-Crick/Hoogsteen breathing dynamics and damage repair from the solution structure and dynamic ensemble of DNA duplexes containing m1A

Bharathwaj Sathyamoorthy et al. Nucleic Acids Res. .

Abstract

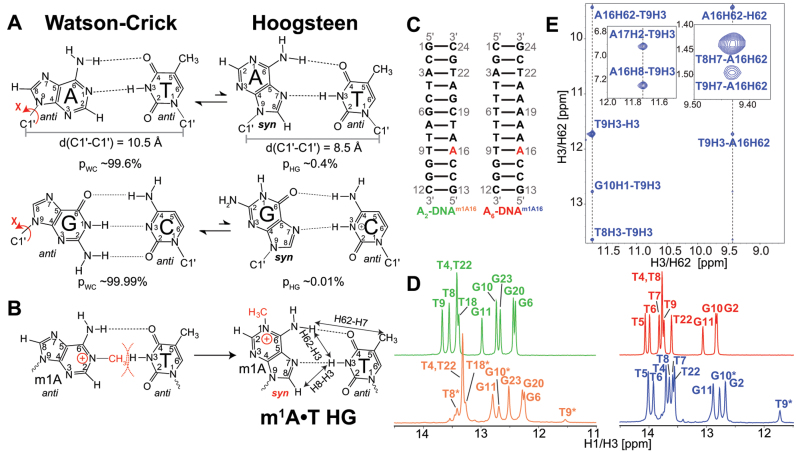
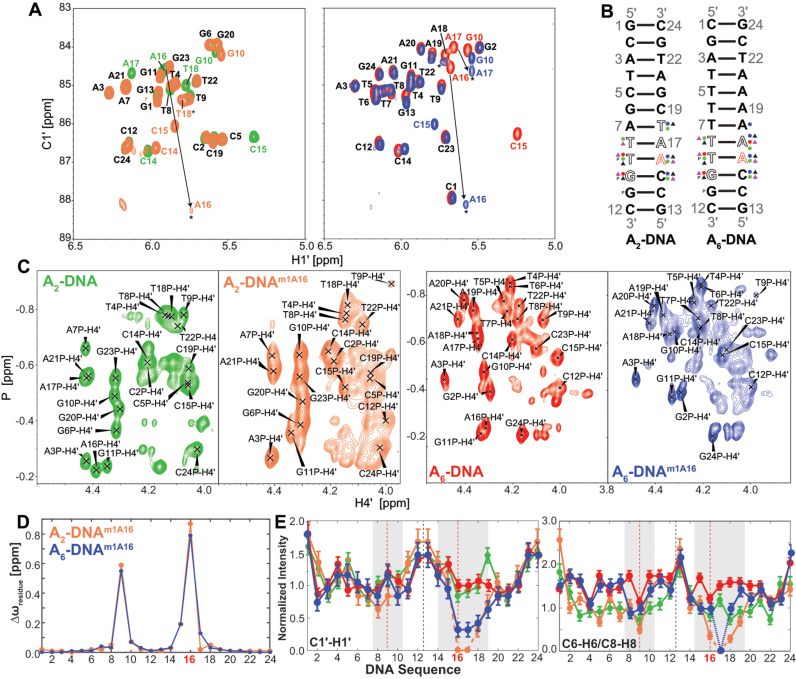
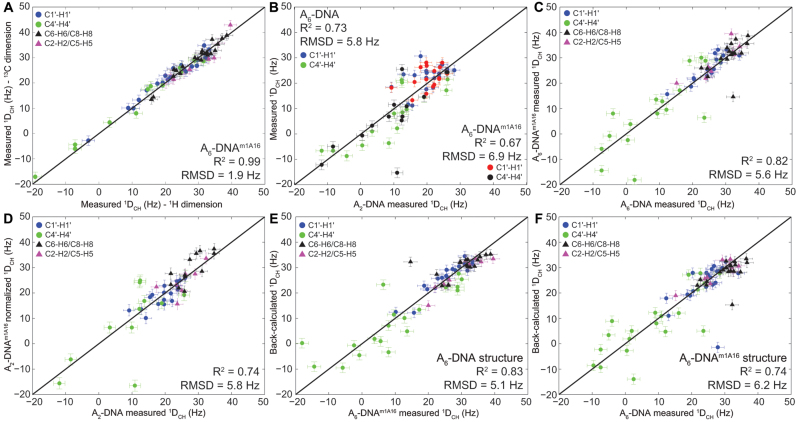
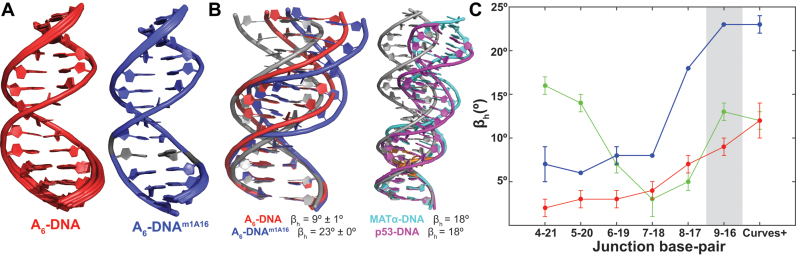
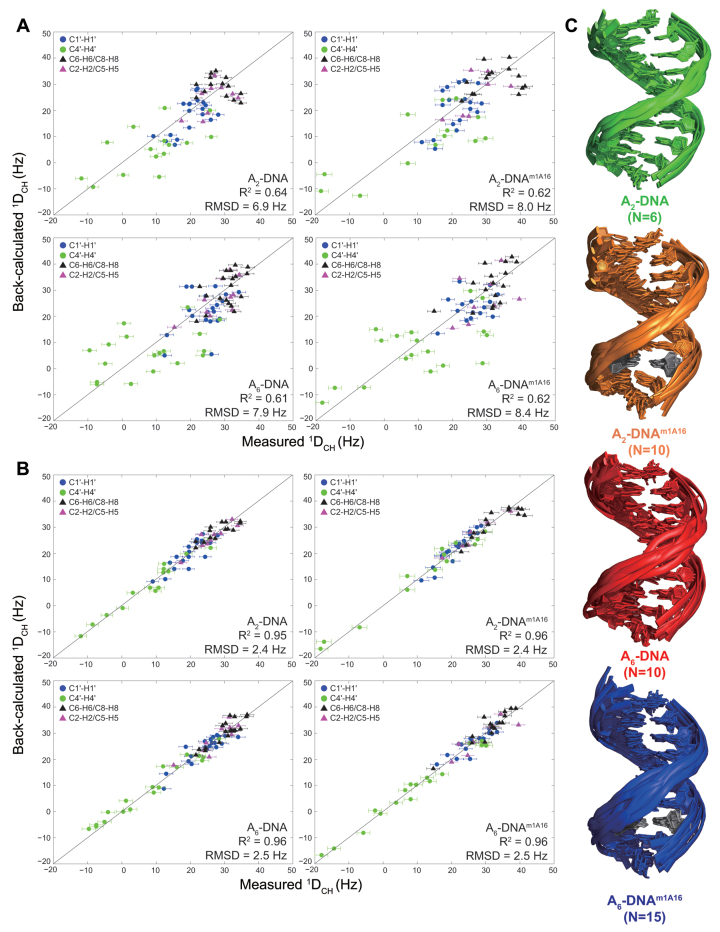
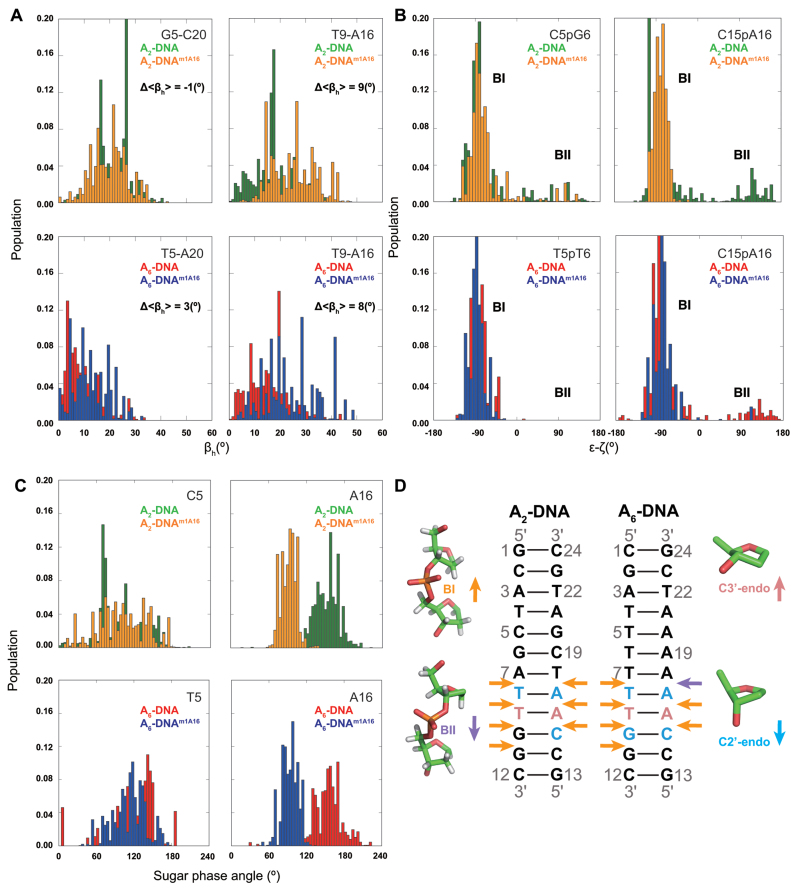
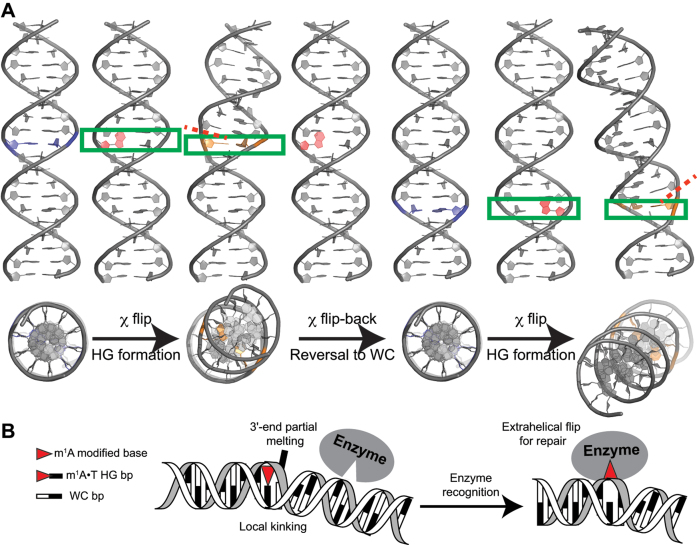
In the canonical DNA double helix, Watson-Crick (WC) base pairs (bps) exist in dynamic equilibrium with sparsely populated (∼0.02-0.4%) and short-lived (lifetimes ∼0.2-2.5 ms) Hoogsteen (HG) bps. To gain insights into transient HG bps, we used solution-state nuclear magnetic resonance spectroscopy, including measurements of residual dipolar couplings and molecular dynamics simulations, to examine how a single HG bp trapped using the N1-methylated adenine (m1A) lesion affects the structural and dynamic properties of two duplexes. The solution structure and dynamic ensembles of the duplexes reveals that in both cases, m1A forms a m1A•T HG bp, which is accompanied by local and global structural and dynamic perturbations in the double helix. These include a bias toward the BI backbone conformation; sugar repuckering, major-groove directed kinking (∼9°); and local melting of neighboring WC bps. These results provide atomic insights into WC/HG breathing dynamics in unmodified DNA duplexes as well as identify structural and dynamic signatures that could play roles in m1A recognition and repair.


Figures

Figure 1.
Figure 1.
(A) Watson–Crick (WC) base pairs (bps) exists in dynamic equilibrium with transient low-abundance Hoogsteen (HG) bps through flipping of the purine base 180° about the glycosidic bond from anti to syn conformation. This is also accompanied by a net reduction of C1΄–C1΄ distance by ∼2.0–2.5 Å. Shown are the average populations (pWC/pHG) for WC and HG bps as measured by nuclear magnetic resonance (NMR) relaxation dispersion (RD) methods (33,35). (B) m1A stabilizes HG bp due to steric clash between the methyl group at m1A-N1 position and T-H3. Nuclear Overhauser effect (NOE) distance connectivity between complementary nucleotides that help in distinguishing HG, WC and reverse-HG pairing modes are indicated using arrows. (C) A2- and A6-DNA duplexes used in this study. (D) 1D imino 1H spectra of A2-DNA (green), A2-DNAm1A16 (orange), A6-DNA (red) and A6-DNAm1A16 (blue). Spectra for for A2-DNA/A6-DNA and A2-DNAm1A16/A6-DNAm1A16 were recorded at 25 and 9°C, respectively. Sites experiencing exchange broadening are denoted with an asterisk (*). (E) T9-H3–A16-H8, T9-H3–A-H62 and T9-H7–A-H62 NOE connectivity distinguishes the formation of HG bp from other pairing modes in A6-DNAm1A16 (19) (see Supplementary Figure S3 for A2-DNAm1A16). Sequential imino NOEs between T9-H3 with T8-H3 and G10-H1 indicate the formation of a stable duplex.
Figure 2.
Figure 2.
(A) 2D [13C, 1H] HSQC spectra (54) acquired for A2-DNA (green), A2-DNAm1A16 (orange), A6-DNA (red) and A6-DNAm1A16 (blue) depicting the chemical shift perturbations in the C1΄-H1΄ region. Residues that remain unperturbed are labeled in black; colored labels are for the respective samples and exchange broadened resonances are indicated with an asterisk (*). (B) Chemical shift perturbations observed for sugar (circle) C1΄-H1΄ (blue), C2΄-H2΄/H2″ (red), C4΄-H4΄ (green), base (triangle) C6-H6/C8-H8 (black), N1-H1/C2-H2/N3-H3/C5-H5 (purple) and with backbone (P) 31P resonances in A2- and A6-DNA upon incorporation of m1A16 residue is shown. Residues that exhibit exchange broadening are indicated as open alphabets. (C) 2D [31P, 1H] HSQC (55) acquired for A2-, A6-DNA and their m1A16 counterparts are shown. Phosphorus atom shared between the residues ‘i’ and ‘j’ is given the label jP i.e. T9P indicates T8pT9. (D) Chemical shift perturbation quantitatively plotted as Δωresidue (see ‘Materials and Methods’ section) as a function of DNA sequence for A2- (orange) and A6-DNAm1A16 (blue). (E) Normalized resonance intensities (see ‘Materials and Methods’ section) measured in sugar C1΄-H1΄ (left) and base C6-H6/C8-H8 2D heteronuclear spectra for A2-DNA (green), A2-DNAm1A16 (orange), A6-DNA (red) and A6-DNAm1A16 (blue) as a function of residues, with regions highlighted in gray showing significant intensity perturbation.
Figure 3.
Figure 3.
(A) Comparison of residual dipolar couplings (RDCs) measured by encoding C-H splittings along the 13C or 1H dimension. Shown is the root-mean-square-deviation (RMSD) and Pearson's correlation coefficient (R2). (B) Correlation plot between sugar RDCs measured in A2-DNA and 1DCH A6-DNA (blue/green) or A6-DNAm1A16 (red/black). The A6-DNA and A6-DNAm1A16 RDCs are normalized by scaling factors of 0.85 and 0.90 units, respectively, to account for differences in alignment. (C and D) Correlation plot between RDCs measured in unmodified and m1A16 modified duplexes: (C) A6-DNA versus A6-DNAm1A16 and (D) A2-DNA versus A2-DNAm1A16, with the different bond vectors colored as shown in the inset. The A2-DNAm1A16 data are normalized by scaling factor of 0.90 units to account for differences in alignment. (E) Best-fitting A6-DNAm1A16 RDCs to the refined A6-DNA structure and (F) A6-DNA RDCs to the refined A6-DNAm1A16 structure. Error bar denotes one-standard deviation in RDC measurement.
Figure 4.
Figure 4.
(A) Lowest energy conformers obtained from XPLOR refinement of idealized B-form DNA using experimental distance constraints and RDCs (see ‘Materials and Methods’ section) for A6-DNA (red, PDB ID: 5UZF, BMRB ID: 30254) and A6-DNAm1A16 (blue, PDB ID: 5UZI, BMRB ID: 30255). The single m1A•T HG bp is in gray for A6-DNAm1A16. (B) Cartoon representation of A6-DNA (red), A6-DNAm1A16 (blue), DNA-p53 (cyan) and MATα2-homeodomain (magenta) complexes depicting major-groove kinking at the HG bp. An idealized B-form DNA helix (in gray) is overlaid for reference (HG bps shown in orange). (C) Local kink angle (βh) as a function of the junction position and global bending calculated for A2-DNA (green), A6-DNA (red) and A6-DNAm1A16 (blue).
Figure 5.
Figure 5.
(A) Comparison of measured RDCs and values back-predicted RDCs using molecular dynamics (MD) trajectories. (B) Comparison of measured RDCs and values predicted for the RDC-selected ensembles. (C) Cartoon representation of a bundle of structures in RDC-selected ensembles of A2-DNA (green), A2-DNAm1A16 (orange), A6-DNA (red), A6-DNAm1A16 (blue) where m1A•T HG bp is colored gray.
Figure 6.
Figure 6.
(A) Ensemble distribution of local kink angle (βh) in the RDC-selected ensembles (N = 2400) at the m1A16•T9 HG and control C5–G20 (A2-DNA) and T5–A20 (A6-DNA) WC bp. Δ<βh> denotes the difference between the average kink angles. (B) Ensemble distribution of BI/BII population (ε-ζ) in the RDC-selected ensembles (N = 2400) at the C15pA16 and control C5pG6 (A2-DNA) and T5pT6 (A6-DNA). (C) Ensemble distribution of sugar phase angle in the RDC-selected ensembles (N = 2400) at the m1A16 and control C5 (A2-DNA) and T5 (A6-DNA). (D) Duplexes depicting m1A induced changes in ensemble distributions of sugar pucker toward C3΄-endo (pink) or C2΄-endo (light blue), and backbone torsion angles toward BI (orange) or BII (purple) in A2- and A6-DNA as inferred from ensemble, structure and other NMR data.
Figure 7.
Figure 7.
(A) Proposed model for Watson–Crick/Hoogsteen breathing dynamics. Shown is major-groove directed DNA kinking (∼18°) upon transient formation of HG bps. Base pairs undergoing WC to HG transition are labeled blue, with the purine-ring undergoing flip denoted in red and the final HG bps denoted in orange. A red-dashed line indicates the directionality of partial local melting occurring at the 3΄-end of the HG bp. (B) Proposed mode of m1A recognition in duplex DNA by damage repair enzymes (e.g. ABH2) that probe for a local kink and partial melting at the 3΄-end, in addition to the positive charge on m1A modification and HG H-bonds.

References

    1. Watson J.D., Crick F.H.C.. Molecular structure of nucleic acids: a structure for deoxyribose nucleic acid. Nature. 1953; 171:737–738. - PubMed
    1. Hoogsteen K. The crystal and molecular structure of a hydrogen-bonded complex between 1-methylthymine and 9-methyladenine. Acta Crystallogr. 1963; 16:907–916.
    1. Nikolova E.N., Zhou H., Gottardo F.L., Alvey H.S., Kimsey I.J., Al-Hashimi H.M.. A historical account of Hoogsteen base-pairs in duplex DNA. Biopolymers. 2013; 99:955–968. - PMC - PubMed
    1. Abrescia N.G.A., Thompson A., Huynh-Dinh T., Subirana J.A.. Crystal structure of an antiparallel DNA fragment with Hoogsteen base pairing. Proc. Natl. Acad. Sci. U.S.A. 2002; 99:2806–2811. - PMC - PubMed
    1. Abrescia N.G.A., González C., Gouyette C., Subirana J.A.. X-ray and NMR studies of the DNA oligomer d(ATATAT): Hoogsteen base pairing in duplex DNA. Biochemistry. 2004; 43:4092–4100. - PubMed

LinkOut - more resources