

The E3 ligase ABI3-INTERACTING PROTEIN2 negatively regulates FUSCA3 and plays a role in cotyledon development in Arabidopsis thaliana
- PMID: 28369580
- PMCID: PMC5441903
- DOI: 10.1093/jxb/erx046
The E3 ligase ABI3-INTERACTING PROTEIN2 negatively regulates FUSCA3 and plays a role in cotyledon development in Arabidopsis thaliana
Abstract
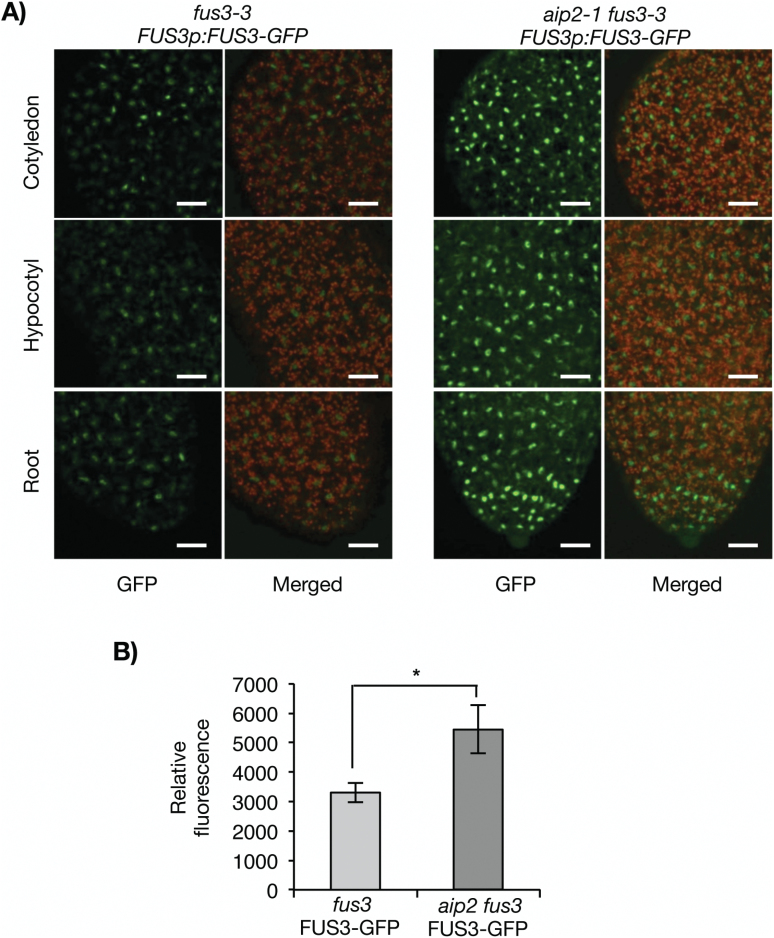
FUSCA3 (FUS3) is a short-lived B3-domain transcription factor that regulates seed development and phase transitions in Arabidopsis thaliana. The mechanisms controlling FUS3 levels are currently poorly understood. Here we show that FUS3 interacts with the RING E3 ligase ABI3-INTERACTING PROTEIN2 (AIP2). AIP2-green fluorescent protein (GFP) is preferentially expressed in the protoderm during early embryogenesis, similarly to FUS3, suggesting that their interaction is biologically relevant. FUS3 degradation is delayed in the aip2-1 mutant and FUS3-GFP fluorescence is increased in aip2-1, but only during mid-embryogenesis, suggesting that FUS3 is negatively regulated by AIP2 at a specific time during embryogenesis. aip2-1 shows delayed flowering and therefore also functions post-embryonically to regulate developmental phase transitions. Plants overexpressing FUS3 post-embryonically in the L1 layer (ML1p:FUS3) show late flowering and other developmental phenotypes that can be rescued by ML1p:AIP2, further supporting a negative role for AIP2 in FUS3 accumulation. However, additional factors regulate FUS3 levels during embryogenesis, as ML1:AIP2 seeds do not resemble fus3-3. Lastly, targeted expression of a RING-inactive AIP2 variant to the protoderm/L1 layer causes FUS3 and ABI3 overexpression phenotypes and defects in cotyledon development. Taken together, these results indicate that AIP2 targets FUS3 for degradation and plays a role in cotyledon development and flowering time in Arabidopsis.
Keywords: AIP2; E3 ligase; FUSCA3; embryogenesis; post-translational regulation; protein degradation; protein localization; protein–protein interaction; seed development; transcription factor..
© The Author 2017. Published by Oxford University Press on behalf of the Society for Experimental Biology.
Figures


Similar articles
-
AKIN10 and FUSCA3 interact to control lateral organ development and phase transitions in Arabidopsis.Plant J. 2012 Mar;69(5):809-21. doi: 10.1111/j.1365-313X.2011.04832.x. Epub 2011 Dec 15. Plant J. 2012. PMID: 22026387
-
Identification of direct targets of FUSCA3, a key regulator of Arabidopsis seed development.Plant Physiol. 2013 Mar;161(3):1251-64. doi: 10.1104/pp.112.212282. Epub 2013 Jan 11. Plant Physiol. 2013. PMID: 23314941 Free PMC article.
-
The FUS3 transcription factor functions through the epidermal regulator TTG1 during embryogenesis in Arabidopsis.Plant J. 2004 Jan;37(1):73-81. doi: 10.1046/j.1365-313x.2003.01939.x. Plant J. 2004. PMID: 14675433
-
LEAFY COTYLEDON 2: A Regulatory Factor of Plant Growth and Seed Development.Genes (Basel). 2021 Nov 26;12(12):1896. doi: 10.3390/genes12121896. Genes (Basel). 2021. PMID: 34946844 Free PMC article. Review.
-
LEAFY COTYLEDONs: old genes with new roles beyond seed development.F1000Res. 2019 Dec 27;8:F1000 Faculty Rev-2144. doi: 10.12688/f1000research.21180.1. eCollection 2019. F1000Res. 2019. PMID: 31942235 Free PMC article. Review.
Cited by
-
Spatiotemporal Restriction of FUSCA3 Expression by Class I BPCs Promotes Ovule Development and Coordinates Embryo and Endosperm Growth.Plant Cell. 2020 Jun;32(6):1886-1904. doi: 10.1105/tpc.19.00764. Epub 2020 Apr 7. Plant Cell. 2020. PMID: 32265266 Free PMC article.
-
TRM61 is essential for Arabidopsis embryo and endosperm development.Plant Reprod. 2022 Mar;35(1):31-46. doi: 10.1007/s00497-021-00428-x. Epub 2021 Aug 18. Plant Reprod. 2022. PMID: 34406456
-
Metabolome and Transcriptome Analyses Reveal Metabolomic Variations and Key Transcription Factors Involved in Lipid Biosynthesis During Seed Development in Carya illinoinensis.Int J Mol Sci. 2024 Oct 28;25(21):11571. doi: 10.3390/ijms252111571. Int J Mol Sci. 2024. PMID: 39519123 Free PMC article.
-
Plastid chaperone HSP90C guides precursor proteins to the SEC translocase for thylakoid transport.J Exp Bot. 2020 Dec 31;71(22):7073-7087. doi: 10.1093/jxb/eraa399. J Exp Bot. 2020. PMID: 32853383 Free PMC article.
-
Repertoire of plant RING E3 ubiquitin ligases revisited: New groups counting gene families and single genes.PLoS One. 2018 Aug 31;13(8):e0203442. doi: 10.1371/journal.pone.0203442. eCollection 2018. PLoS One. 2018. PMID: 30169501 Free PMC article.
References
-
- Baumbusch LO, Hughes DW, Galau GA, Jakobsen KS. 2004. LEC1, FUS3, ABI3, and Em expression reveals no correlation with dormancy in Arabidopsis. Journal of Experimental Botany 55, 77–87. - PubMed
-
- Bowman JL, Floyd SK. 2008. Patterning and polarity in seed plant shoots. Annual Review of Plant Biology 59, 67–88. - PubMed
-
- Brady SM, Sarkar SF, Bonetta D, McCourt P. 2003. The ABSCISIC ACID INSENSITIVE 3 (ABI3) gene is modulated by farnesylation and is involved in auxin signaling and lateral root development in Arabidopsis. The Plant Journal 34, 67–75. - PubMed
Publication types
MeSH terms
Substances
LinkOut - more resources
Full Text Sources
Other Literature Sources
Molecular Biology Databases
