. 2017 Jul;151(3):349-362.
doi: 10.1111/imm.12737. Epub 2017 May 4.

Ageing adversely affects the migration and function of marginal zone B cells

Affiliations

Ageing adversely affects the migration and function of marginal zone B cells

Vivian M Turner et al. Immunology. 2017 Jul.

Abstract

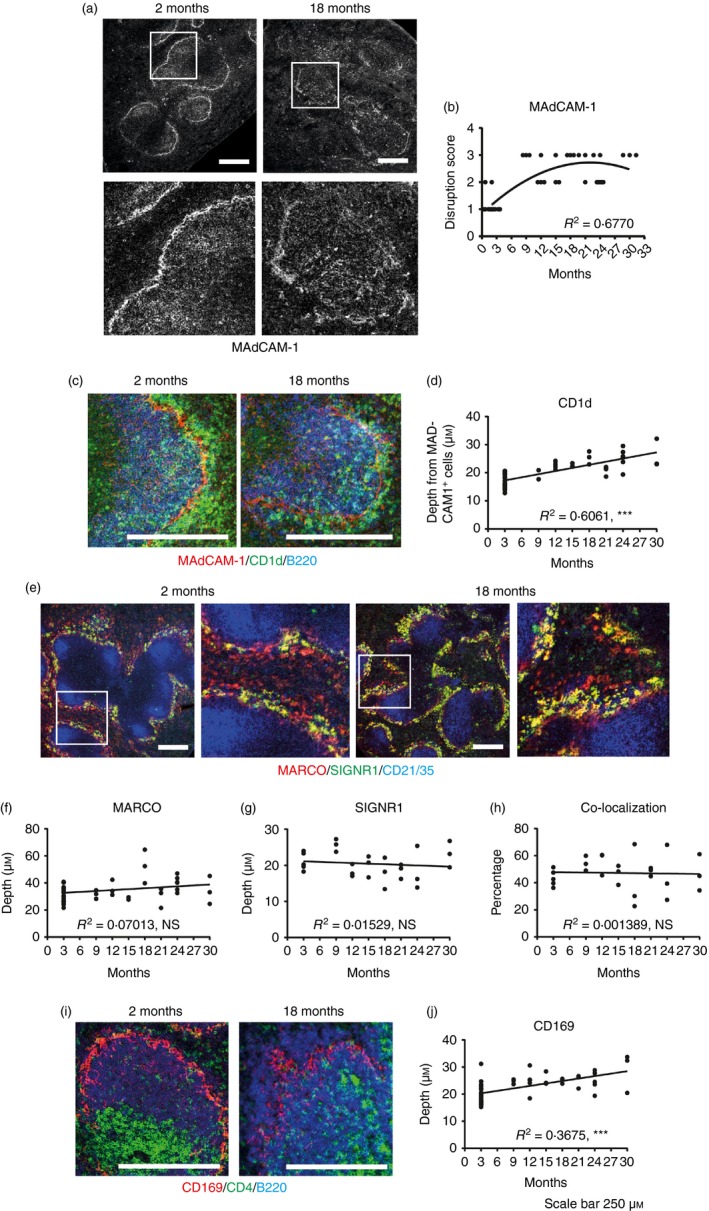
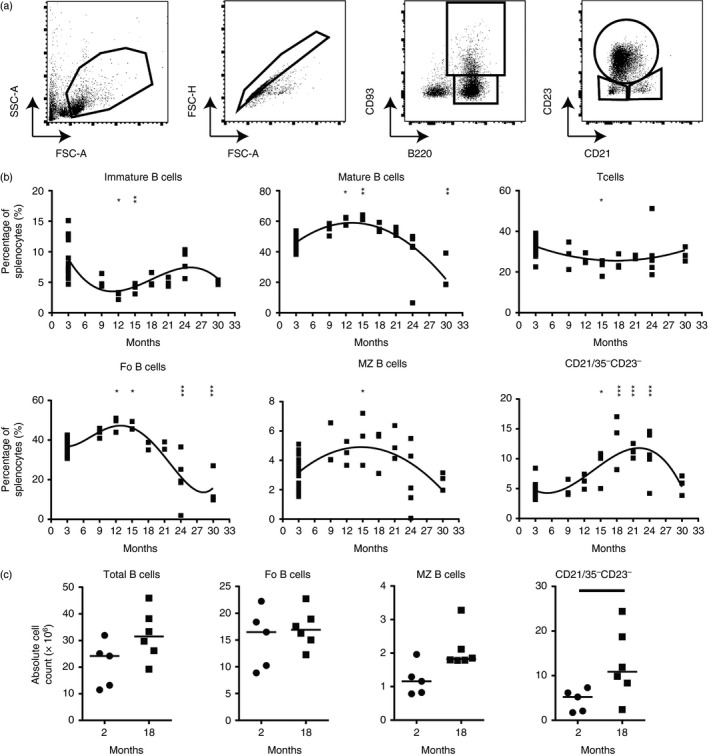
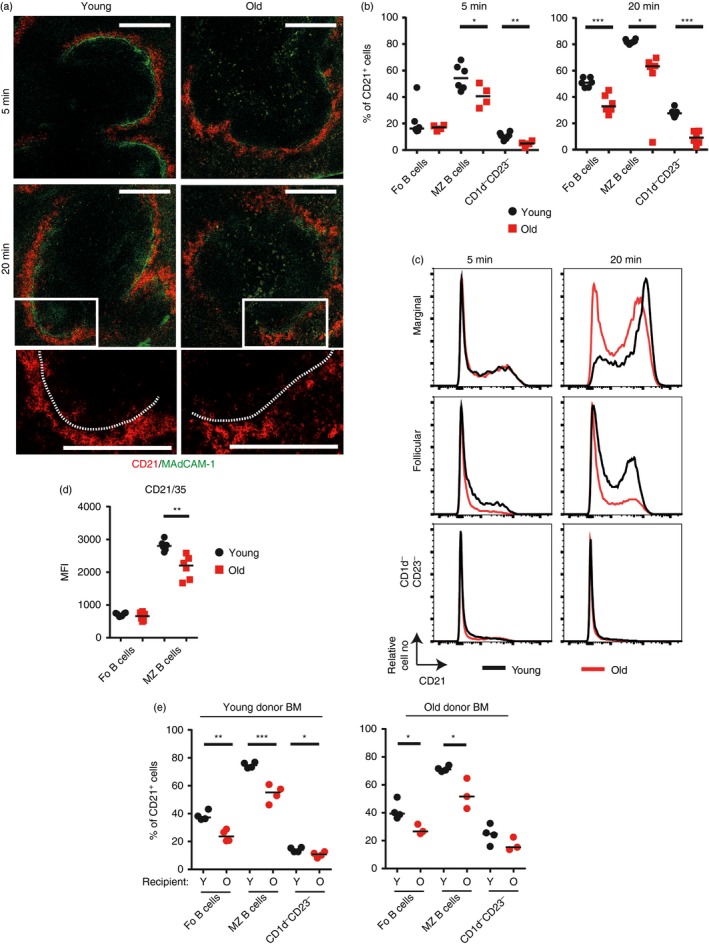
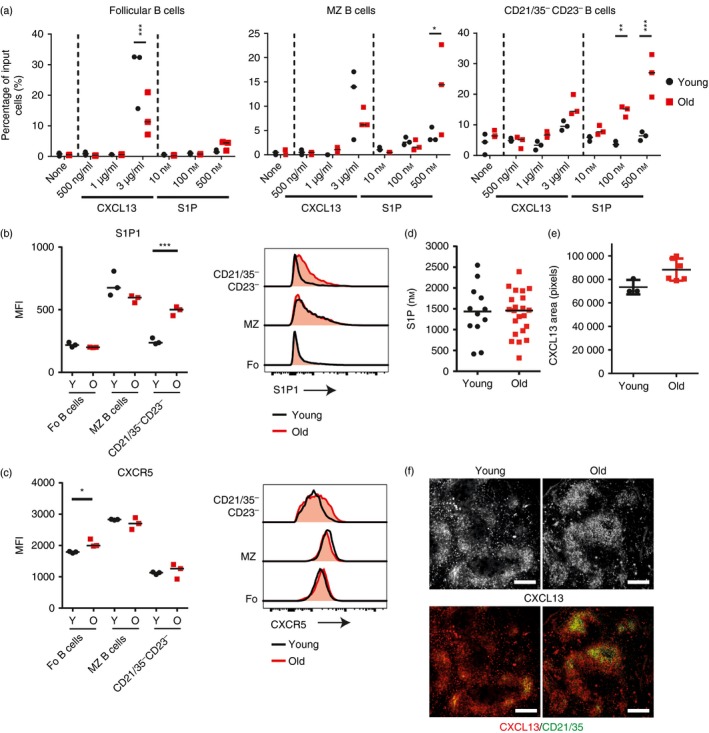
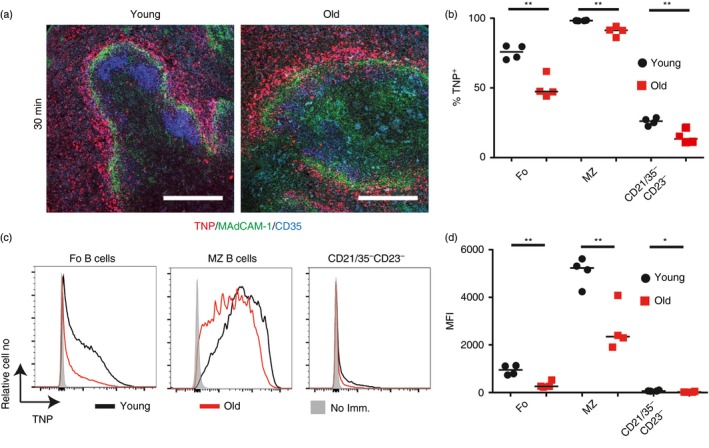
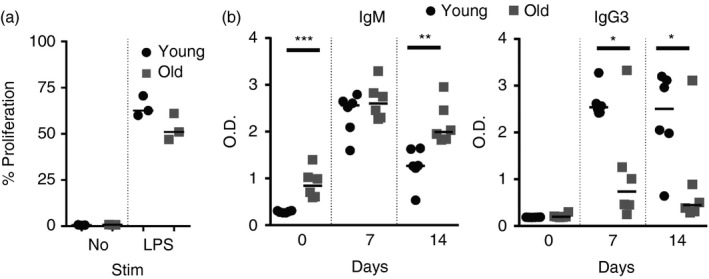
Marginal zone (MZ) B cells are positioned within the spleen to capture blood-borne antigen and immune complexes and deliver them to follicular dendritic cells in the B-cell follicles. We show that within the spleens of aged mice antigen capture by MZ B cells, and their ability to shuttle between the follicle and MZ, were impaired. The ability of aged MZ B cells to migrate towards the MZ chemoattractant sphingosine-1-phosphate was increased, suggesting that aged MZ B cells had a greater propensity to be retained within the MZ. An extrinsic impairment in aged B-cell migration towards the MZ was demonstrated using bone marrow chimeras. The follicular shuttling of MZ B cells derived from either young or aged bone marrow was similarly reduced in aged recipient spleens, showing that ageing effects on splenic stromal cells were responsible for the impaired follicular shuttling of MZ B cells. MZ B cells rapidly mount T-cell-independent (TI) antibody-responses to microbial polysaccharide antigen. In aged mice the ability to produce immunoglobulins in response to the TI type 1 antigen TNP-LPS was impaired. These ageing-related changes to the MZ and MZ B cells have implications for the clearance of blood-borne pathogens. Indeed elderly people have increased susceptibility to Streptococcus pneumoniae, a TI antigen, and decreased responses to vaccination. A thorough analysis of the mechanisms that underpin the ageing-related decline in the status of the MZ and MZ B cells will help the design of novel treatments to improve immunity in the elderly.

Keywords: B cells; T-independent responses; ageing; marginal zone; spleen.


Figures

Figure 1
Figure 1
Histological analysis of changes to splenic structure with age. Immunostained spleen sections from mice 2 months to 30 months of age were analysed. (a) Representative staining of MAdCAM‐1 on 2‐month and 18‐month spleens. (b) Quantification of the disruption of MAdCAM‐1+ cells at the ages indicated overlaid with a second‐order polynomial. (c) Representative staining of CD1d (green), B220 (blue) and MAdCAM‐1 (red) on 2‐month and 18‐month spleens. (d) Measurement of the depth of CD1d+ cells from the MAdCAM‐1+ cells at the ages indicated. (e) Representative staining of MARCO (red – marginal zone macrophages), SIGNR‐1 (green – a subset of marginal zone macrophages) and CD21/35 (blue – follicular dendritic cells and B cells) on 2‐month‐old and 18‐month‐old mice. (f) Measurement of the depth of MARCO + cells at the ages indicated. (g) Measurement of the depth of SIGNR‐1+ cells at the ages indicated. (h) Percentage of MARCO + that are SIGNR‐1+ at the ages indicated. (i) Representative staining of CD4 (green – T cells), B220 (blue – B cells) and CD169 (red – marginal metallophilic macrophages) on 2‐month‐old and 18‐month‐old mice. (j) Measurement of the depth of CD169+ cells at the ages indicated. n = 3 to n = 6 except in the 2‐month group where n = 23. Except for (b), graphs are overlaid with linear regression curve. R 2 values shown on bottom right of graphs based on curve fit. ***P < 0·001. Scale bars = 250 μm.
Figure 2
Figure 2
Effect of age on murine B‐cell populations. Flow cytometry was performed on splenocytes from mice aged 2 months to 30 months. (a) Gating strategy to identify B‐cell populations. (b) Percentage of splenocytes that are T cells (CD3e+, second‐order polynomial, R 2 = 0·2515), Immature B cells (B220+ CD93+, third‐order polynomial, R 2 = 0·3919), Mature B cells (B220+ CD93, second‐order polynomial, R 2 = 0·5858), follicular B cells (B220+ CD93 CD21mid CD23hi, fourth‐order polynomial, R 2 = 0·7130), marginal zone B cells (B220+ CD93 CD21hi CD23lo, second‐order polynomial, R 2 = 0·2903) or CD21/35 CD23 B cells (B220+ CD93 CD21lo CD23lo, third‐order polynomial, R 2 = 0·6417). n = 3 to n = 5 except in the 2‐month group where n = 23. Results were further analysed via one‐way analysis of variance with Dunnetts post‐test with groups compared to the 2‐month control group for statistical significance. (c) Quantification of absolute total (B220+), follicular (B220+ CD21mid CD23hi), marginal zone (B220+ CD21hi CD23lo) and CD21/35 CD23 (B220+ CD21lo CD23lo) B‐cell populations in 2‐ and 18‐month‐old mice. Median is shown, n = 5 or n = 6 mice per group. Results were analysed via Mann–Whitney U‐test. ***P < 0·001, **P < 0·01, *P < 0·05.
Figure 3
Figure 3
Decreased shuttling of B cells in the aged splenic environment. (a–c) Young and old mice were given 1 μg of anti‐CD21/35‐PE monoclonal antibody (mAb) intravenously then spleens collected for analysis 5 or 20 min later. Data are compiled from two experiments with a total of four to six mice per group. (a) Representative images of immunofluorescence histology on spleen sections from injected mice showing localization of CD21‐PE (red) and localization of MAdCAM‐1 (green). Enlargements show CD21‐PE movement into follicles at 20 min. Scale bar = 200 μm. (b) Percentage uptake of anti‐CD21/35‐PE by follicular (B220+ CD93 CD23+ CD1d), marginal zone (B220+ CD93 CD23 CD1dhi), or CD1d CD23 (B220+ CD93 CD23 CD1d) B cells is shown 5 or 20 min post‐injection in young (black circles) and old (red squares) mice. (c) Representative expression levels of CD21‐PE on follicular, marginal zone and CD1d CD23 B cells in young (black line) and old (red line) mice. (d) Median fluorescence intensity of CD21/35 on follicular (B220+ CD93 CD21mid CD23hi) and marginal zone (B220+ CD93 CD21hi CD23lo) B cells in young (black circles) and old (red squares) mice. Data are compiled from two experiments with a total of four to six mice per group. (e) Lethally irradiated young or old recipient mice were transplanted with bone marrow from young or old donor mice. Ten weeks post‐reconstitution mice were given 1 μg of anti‐CD21/35‐PE monoclonal antibody (mAb) intravenously then spleens were collected for analysis 20 min later. Percentage uptake of anti‐CD21/35‐PE mAb by follicular (B220+ CD93 CD23+ CD1d), marginal zone (B220+ CD93 CD23 CD1dhi), or CD1d CD23 (B220+ CD93 CD23 CD1d) B cells is shown. Median is shown, n = 3 or n = 4 mice per group and is representative of two experiments for young donor bone marrow and one experiment for old donor bone marrow. Results were analysed using t‐test. ***P < 0·001, **P < 0·01, *P < 0·05.
Figure 4
Figure 4
Altered chemotaxis of aged B cells to CXCL13 and sphingosine 1‐phosphate (S1P). (a) Chemotactic response of follicular (B220+ CD93 CD21mid CD23hi), marginal zone (B220+ CD93 CD21hi CD23lo) and CD21/35 CD23 (B220+ CD93 CD21lo CD23lo) B‐cell populations to indicated concentration of CXCL13 or S1P presented as the percentage of input of cells that have migrated through transwells into the lower chamber in a 4‐hr assay. Input cells were equal numbers of cells pooled from three young and three old mice and technical replicates are shown. Data are representative of two repeats and results were analysed via two‐way analysis of variance with Sidak's post‐test. Median fluorescence intensity of S1P1 (b) or CXCR5 (c) on follicular (B220+ CD93 CD21mid CD23hi), marginal zone (B220+ CD93 CD21hi CD23lo) and CD21/35 CD23 (B220+ CD93 CD21lo CD23lo) B‐cell populations from young and aged mice. Results were analysed using t‐test, n = 3 per group. (d) Concentration of S1P in the serum of young and aged mice, measured with HPLC. Results were analysed using Mann–Whitney U‐test, there was no significant difference. n = 12 young mice and 22 old mice. (e) CXCL13 area in the follicle of spleens from young and aged mice. Results were analysed via Mann–Whitney U‐test, there was no significant difference, n = 3 to n = 6 mice per group. (f) Representative histological staining of CXCL13 on young and aged spleens. Scale bars = 250 μm. ***P < 0·001, **P < 0·01, *P < 0·05.
Figure 5
Figure 5
B cells in aged mice have a decreased uptake of trinitrophenyl (TNP) ‐Ficoll. Young and old mice were immunized with TNP‐Ficoll. After 30 min spleens were collected for analysis. (a) Representative immunofluorescence images of TNP localization in the spleens of young and old mice (TNP – red, MAdCAM‐1 – green, CD35 – blue). Scale bars = 200 μm. (b) A flow cytometric analysis was performed to determine the percentage of follicular (B220+ CD21mid CD23hi), marginal zone (B220+ CD21hi CD23lo) and CD21/35 CD23 (B220+ CD21lo CD23lo) B cells that are binding TNP‐Ficoll. (c) Expression levels of TNP on the follicular (B220+ CD21mid CD23hi), marginal zone (B220+ CD21hi CD23lo) and CD21/35 CD23 (B220+ CD21lo CD23lo) B cells in non‐immunized, young and old mice as determined via flow cytometry. (d) Median fluorescence intensity levels of TNP on follicular, marginal zone and CD21/35 CD23 B cells. Results are representative of two experiments. Median is shown, n = 4 mice per group, and analysis was via t‐test. **P < 0·01, *P < 0·05.
Figure 6
Figure 6
Decreased long‐term response of aged mice to trinitrophenyl (TNP) ‐Ficoll. Mice were given TNP‐Ficoll and serum was collected from the tail vein before immunization and 7 or 14 days post‐immunization. ELISAs were performed to measure TNP‐specific IgM or IgG3 levels. Graphs show median OD 405; n = 5 or n = 6 mice per group. Results were analysed using one‐way analysis of variance with Tukeys post‐test. **P < 0·01, *P < 0·05.
Figure 7
Figure 7
Aged B cells have a decreased response to trinitrophenyl–lipopolysaccharide (TNPLPS). (a) B cells were enriched from the spleens of young or old mice, labelled with Cell Trace Far Red and cultured in vitro in media alone or containing 10 μg/ml LPS for 48 hr. The percentage of B cells that proliferated is shown. (b) Mice were given TNPLPS. Serum was collected from the tail vein before immunization and 7 or 14 days post‐immunization. ELISAs were performed to measure TNP‐specific IgM or IgG3 levels. Graphs shown median OD 405. n = 6 mice per group. Results were analysed by one‐way analysis of variance with Tukeys post‐test. ***P < 0·001, **P < 0·01, *P < 0·05.

References

    1. Pillai S, Cariappa A, Moran ST. Marginal zone B cells. Annu Rev Immunol 2005; 23:161–96. - PubMed
    1. Cinamon G, Matloubian M, Lesneski MJ, Xu Y, Low C, Lu T et al Sphingosine 1‐phosphate receptor 1 promotes B cell localization in the splenic marginal zone. Nat Immunol 2004; 5:713–20. - PubMed
    1. Cinamon G, Zachariah MA, Lam OM, Foss FW Jr, Cyster JG. Follicular shuttling of marginal zone B cells facilitates antigen transport. Nat Immunol 2008; 9:54–62. - PMC - PubMed
    1. Ferguson AR, Youd ME, Corley RB. Marginal zone B cells transport and deposit IgM‐containing immune complexes onto follicular dendritic cells. Int Immunol 2004; 16:1411–22. - PubMed
    1. Fagarasan S, Honjo T. T‐Independent immune response: new aspects of B cell biology. Science 2000; 290:89–92. - PubMed

Publication types

MeSH terms