. 2017 Nov;35(11):2567-2576.
doi: 10.1002/jor.23566. Epub 2017 Apr 24.

Changes in chondrolabral mechanics, coverage, and congruency following peri-acetabular osteotomy for treatment of acetabular retroversion: A patient-specific finite element study

Affiliations

Changes in chondrolabral mechanics, coverage, and congruency following peri-acetabular osteotomy for treatment of acetabular retroversion: A patient-specific finite element study

Spencer J Knight et al. J Orthop Res. 2017 Nov.

Abstract

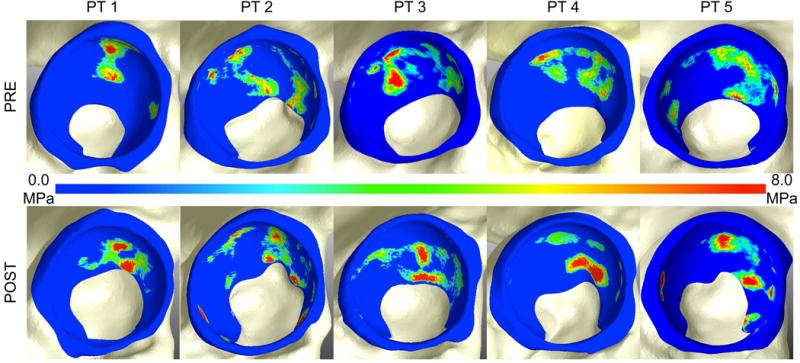
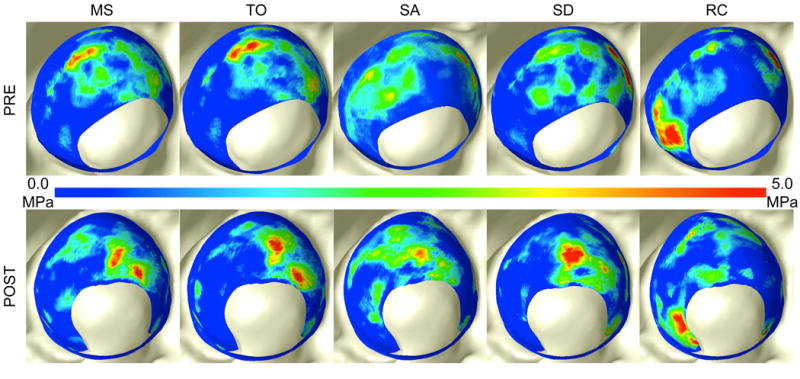
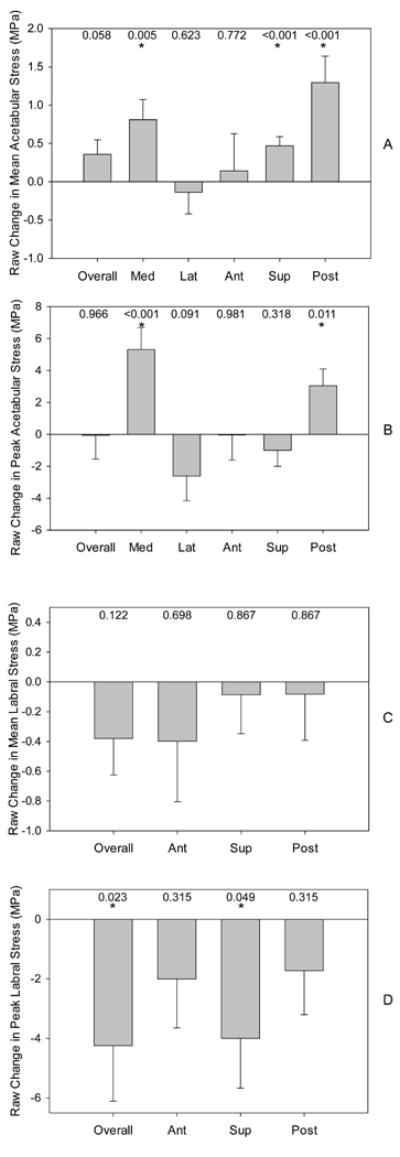
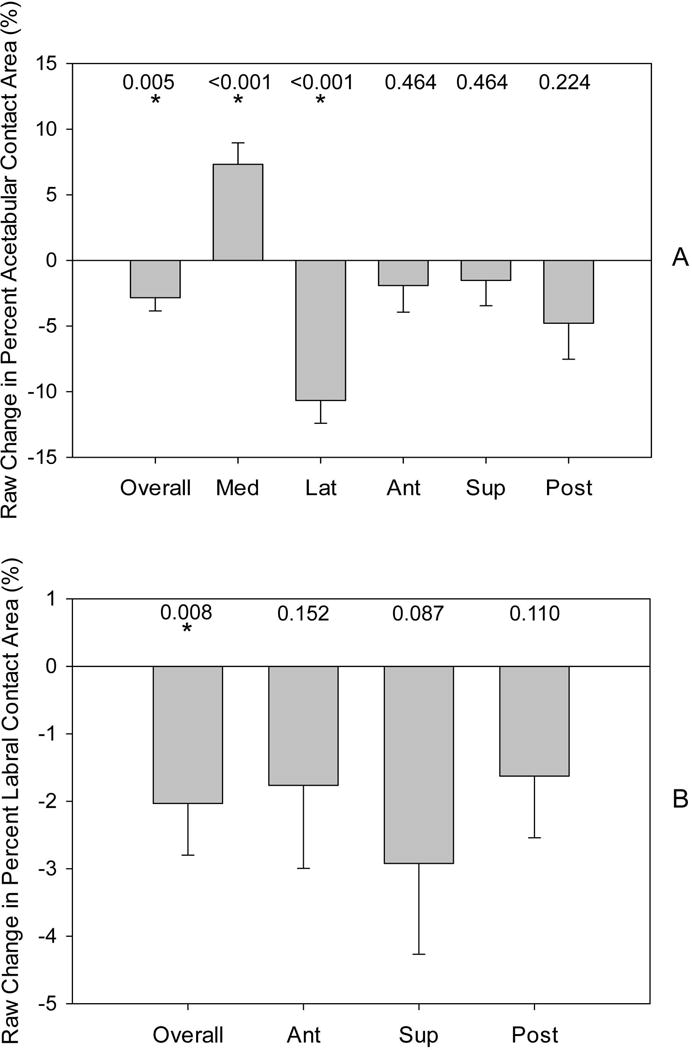
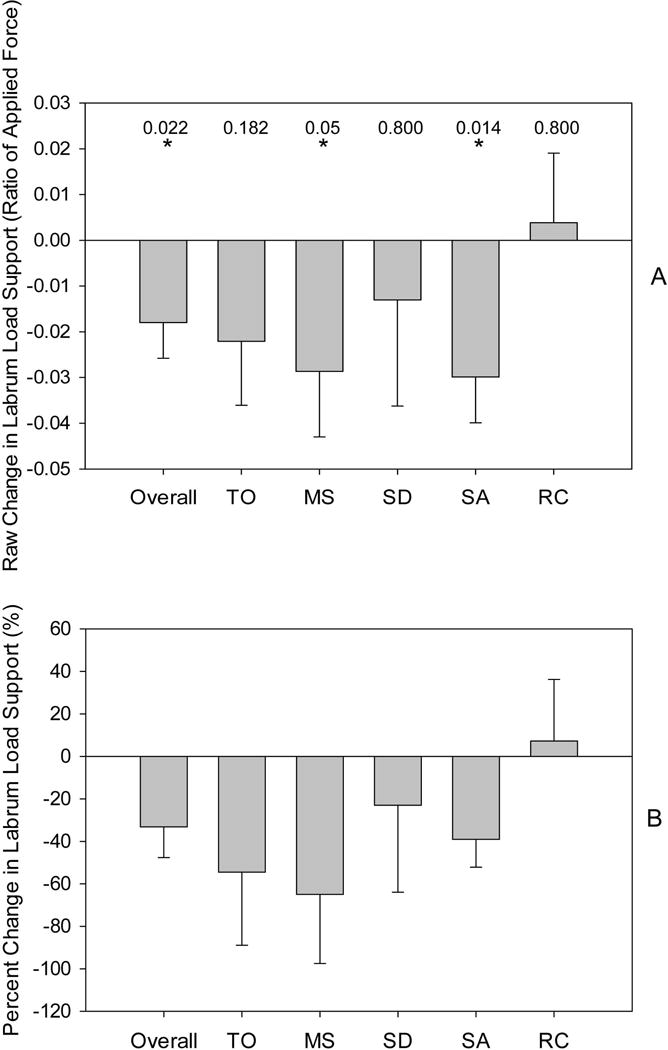
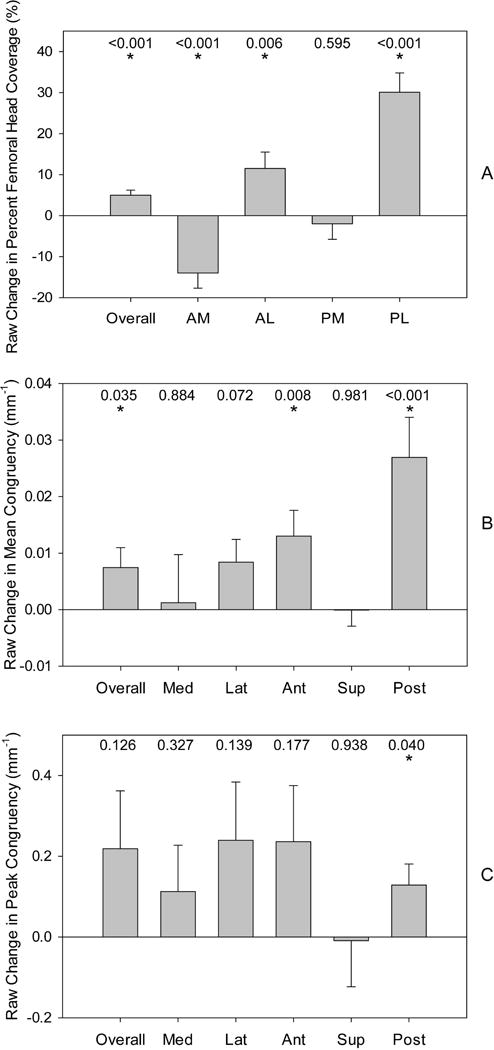
Using a validated finite element (FE) protocol, we quantified cartilage and labrum mechanics, congruency, and femoral coverage in five male patients before and after they were treated for acetabular retroversion with peri-acetabular osteotomy (PAO). Three-dimensional models of bone, cartilage, and labrum were generated from computed tomography (CT) arthrography images, acquired before and after PAO. Walking, stair-ascent, stair-descent, and rising from a chair were simulated. Cartilage and labrum contact stress, contact area, and femoral coverage were calculated overall and regionally. Mean congruency (average of local congruency values for FE nodes in contact) and peak congruency (most incongruent node in contact) were calculated overall and regionally. Load supported by the labrum was represented as a raw change in the ratio of the applied force transferred through the labrum and percent change following surgery (calculated overall only). Considering all activities, following PAO, mean acetabular cartilage contact stress increased medially, superiorly, and posteriorly; peak stress increased medially and posteriorly. Peak labrum stresses decreased overall and superiorly. Acetabular contact area decreased overall and laterally, and increased medially. Labral contact area decreased overall, but not regionally. Load to the labrum decreased. Femoral head coverage increased overall, anterolaterally, and posterolaterally, but decreased anteromedially. Mean congruency indicated the hip became less congruent overall, anteriorly, and posteriorly; peak congruency indicated a less congruent joint posteriorly.

Clinical relevance: Medialization of contact and reductions in labral loading following PAO may prevent osteoarthritis, but this procedure increases cartilage stresses, decreases contact area, and makes the hip less congruent, which may overload cartilage. © 2017 Orthopaedic Research Society. Published by Wiley Periodicals, Inc. J Orthop Res 35:2567-2576, 2017.

Keywords: chondrolabral mechanics; finite element analysis; hip; morphology; retroversion.


Conflict of interest statement

Conflict of Interest: None of the authors report conflicts of interest associated with the design, execution, and publication of this study.

Figures

Figure 1
Figure 1
Patient-specific 3D reconstructions of the pelvis in the pre-operative state. Acetabular cartilage (blue) was divided into medial and lateral regions (A) as well as anterior, superior, and posterior regions (B) for analysis of contact stresses, contact area, and congruency. The acetabular labrum (green) was divided into anterior, superior, and posterior regions to calculate labral contact stress and contact area.
Figure 2
Figure 2
Acetabular and labral contact stress in the pre- (top row) and post-operative (bottom row) state for walking at midstance (MS) for each patient (PT). Contact stresses were complex in shape, but appeared bi-centric in both operative states. Acetabular contact stresses appeared higher in magnitude in the post-operative state, and were located more medial, near the acetabular fossa. There was greater variation in the location and magnitude of stress across patients than that measured between operative states within the same subject. Note – the fringe scale has been set to a maximum of 8 MPa to show areas of elevated contact stress. However, peak contact stresses often exceeded 8 MPa.
Figure 3
Figure 3
Average contact stresses in the pre- (top row) and post-operative (bottom row) state. Here, contact stresses for each patient have been mapped to a representative mesh and then averaged. Contact stresses were generally higher in the post-operative state. Contact also shifted medially following surgery, which was most evident during the MS, TO, SA, and SD activities. A posteriorly directed shift in contact was observed during the SD and RC activities. Note: the labrum has been removed as average labral stresses were very low. MS = mid-stance during walking; TO = walking at toe-off; SA = heel-strike during stair ascent, SD = transition of heel strike and mid-stance for stair descent; RC = maximum joint reaction force during rising from a chair.
Figure 4
Figure 4
Raw changes in cartilage and labrum mean and peak contact stress following PAO. (A) Mean acetabular contact stress was increased significantly in the medial, superior, and posterior regions. (B) Peak acetabular contact stress was increased significantly in the medial and posterior regions. (C) There were no significant changes in mean labral contact stress. (D) Peak labral stresses were reduced significantly overall and in the anterior region. Bars indicate standard error. P values are listed and * indicates P ≤ 0.05.
Figure 5
Figure 5
Raw changes in cartilage and labrum contact area following PAO. (A) Acetabular contact area was reduced significantly overall and in the lateral region, but increased significantly in the medial region. (B) Labral contact area was significantly reduced overall. Note: acetabular and labral contact area are in units of percent, which was calculated by dividing the area actually in contact by the total area available for contact. Bars indicate standard error. P values are listed and * indicates P ≤ 0.05. TO = walking at toe-off; MS = mid-stance during walking; SD = transition of heel strike and mid-stance for stair descent; SA = heel-strike during stair ascent, RC = maximum joint reaction force during rising from a chair.
Figure 6
Figure 6
Changes to labrum load support following PAO. (A) The raw change in load support to the labrum, expressed as the load transferred to the labrum divided by the total force applied to the FE model, decreased significantly overall, and during the MS and SA activities. (B) The percent change in labrum load support demonstrated the same trends as the raw change. Note: both the raw change and percent change in labrum load support were calculated overall, not on a regional basis. Bars indicate standard error. Note: statistical testing was only performed on the raw change in labrum load support. P values are listed and * indicates P ≤ 0.05. TO = walking at toe-off; MS = mid-stance during walking; SD = transition of heel strike and mid-stance for stair descent; SA = heel-strike during stair ascent, RC = maximum joint reaction force during rising from a chair.
Figure 7
Figure 7
Raw changes in femoral head coverage and hip joint congruency following PAO. (A) The raw change in coverage of the femoral head indicated significant increases overall, and in the AL and PL regions; coverage decreased significantly in the AM region. Note: femoral head coverage was measured as the percent of the femoral head covered by the acetabulum. (B) Values for raw changes in mean congruency, expressed as the average of local congruency values for FE nodes in contact, indicated that the hip became less congruent overall, and the anterior and posterior regions. (C) Values for peak congruency, expressed as the most incongruent FE node in contact, indicated that the hip became less congruent in the posterior region. Bars indicate standard error. P values are listed and * indicates P ≤ 0.05. AM = anteromedial; AL = anterolateral; PM = posteromedial; PL = posterolateral.

References

    1. Murphy LB, Helmick CG, Schwartz TA, et al. One in four people may develop symptomatic hip osteoarthritis in his or her lifetime. Osteoarthritis Cartilage. 2010;18:1372–1379. - PMC - PubMed
    1. Ezoe M, Naito M, Inoue T. The prevalence of acetabular retroversion among various disorders of the hip. J Bone Joint Surg Am. 2006;88:372–379. - PubMed
    1. Reynolds D, Lucas J, Klaue K. Retroversion of the acetabulum. A cause of hip pain. J Bone Joint Surg Br. 1999;81:281–288. - PubMed
    1. Dandachli W, Islam SU, Liu M, et al. Three-dimensional CT analysis to determine acetabular retroversion and the implications for the management of femoro-acetabular impingement. J Bone Joint Surg Br. 2009;91:1031–1036. - PubMed
    1. Hansen BJ, Harris MD, Anderson LA, et al. Correlation between radiographic measures of acetabular morphology with 3D femoral head coverage in patients with acetabular retroversion. Acta Orthop. 2012;83:233–239. - PMC - PubMed

Publication types

LinkOut - more resources