. 2017 Apr;58(3):146-161.
doi: 10.1002/em.22083.

Interlaboratory evaluation of a multiplexed high information content in vitro genotoxicity assay

Affiliations

Interlaboratory evaluation of a multiplexed high information content in vitro genotoxicity assay

Steven M Bryce et al. Environ Mol Mutagen. 2017 Apr.

Abstract

We previously described a multiplexed in vitro genotoxicity assay based on flow cytometric analysis of detergent-liberated nuclei that are simultaneously stained with propidium iodide and labeled with fluorescent antibodies against p53, γH2AX, and phospho-histone H3. Inclusion of a known number of microspheres provides absolute nuclei counts. The work described herein was undertaken to evaluate the interlaboratory transferability of this assay, commercially known as MultiFlow® DNA Damage Kit-p53, γH2AX, Phospho-Histone H3. For these experiments, seven laboratories studied reference chemicals from a group of 84 representing clastogens, aneugens, and nongenotoxicants. TK6 cells were exposed to chemicals in 96-well plates over a range of concentrations for 24 hr. At 4 and 24 hr, cell aliquots were added to the MultiFlow reagent mix and following a brief incubation period flow cytometric analysis occurred, in most cases directly from a 96-well plate via a robotic walk-away data acquisition system. Multiplexed response data were evaluated using two analysis approaches, one based on global evaluation factors (i.e., cutoff values derived from all interlaboratory data), and a second based on multinomial logistic regression that considers multiple biomarkers simultaneously. Both data analysis strategies were devised to categorize chemicals as predominately exhibiting a clastogenic, aneugenic, or nongenotoxic mode of action (MoA). Based on the aggregate 231 experiments that were performed, assay sensitivity, specificity, and concordance in relation to a priori MoA grouping were ≥ 92%. These results are encouraging as they suggest that two distinct data analysis strategies can rapidly and reliably predict new chemicals' predominant genotoxic MoA based on data from an efficient and transferable multiplexed in vitro assay. Environ. Mol. Mutagen. 58:146-161, 2017. © 2017 Wiley Periodicals, Inc.

Keywords: DNA damage; H2AX; mode of action; p53; phospho-histone H3.


Conflict of interest statement

CONFLICT OF INTEREST STATEMENT

SMB, DB, JCB, and SDD are employed by Litron Laboratories. Litron has a patent covering the flow cytometry-based assay described in this manuscript and sells a commercial kit based on these procedures: MultiFlow DNA Damage Kit—p53, γH2AX, Phospho-Histone H3. DK serves as a consultant to Litron Laboratories.

Figures
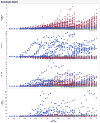
Figure 1
Figure 1
Fold-increase responses for four biomarkers are graphed against chemical concentration (log10). The graphs are aggregate data for 231 experiments conducted by seven laboratories. The data are coded according to genotoxic MoA: clastogens = red circles, aneugens = blue squares, and non-genotoxicants = green triangles. These graphs support the fact that these biomarkers as transferable across sites, and suggest that different response profiles among chemical classes should be valuable for elucidating genotoxic mode of action.
Figure 2
Figure 2
Upper panel shows biomarker response profiles for ethyl methanesulfonate-treated TK6 cells for each of 5 test sites. Lower panel shows biomarker response profiles for noscapine-treated TK6 cells for each of 4 test sites. The differences in response magnitude form the basis of the prediction algorithms described herein.
Figure 3
Figure 3
Color-coded results summarizing the Global Evaluation Factors approach for determining chemicals’ predominant genotoxic mode of action. The data are organized according to chemical (A = aneugen, C = clastogen, and NG = non-genotoxicant) as well as laboratory (LIT = Litron, BAY = Bayer, ORI = Orion, PFI = Pfizer, ROC = Roche, SAN = Sanofi, SER = Servier). The red color is indicative of a significant clastogen-sensitive biomarker response, blue is indicative of a significant aneugen-sensitive biomarker response, violet is indicative of a pan-genotoxicant biomarker response (i.e., p53 at 24 hrs), and white indicates no significant response. The right-most columns indicate the predominant MoA call (red for clastogen, blue for aneugen, white for non-genotoxicant. As described in the Materials and Methods section, a clastogen or aneugen call requires two or more supportive biomarker responses.
Figure 4
Figure 4
Figure 4a. Multinomial logistic regression probabilities for aneugen classification are graphed for each of 84 chemicals studied at Litron. Chemicals are coded according to genotoxic MoA: clastogens = red circles, aneugens = blue squares, and non-genotoxicants = green triangles. A series of probabilities are plotted for each chemical, with each point representing a different concentration. These data show that each of the aneugens were correctly classified by the 4-factor aneugen detection model (two successive concentrations with probabilities in excess of 0.8, or one concentration in excess of 0.9). None of the clastogens or non-genotoxicants were misclassified as aneugens. Figure 4b. Multinomial logistic regression probabilities for clastogen classification are graphed for each of 84 chemicals studied at Litron. Chemicals are coded according to genotoxic MoA: clastogens = red circles, aneugens = blue squares, and non-genotoxicants = green triangles. A series of probabilities are plotted for each chemical, with each point representing a different concentration. These data show that 32 of 33 clastogens were correctly classified by the clastogen-detection model. None of the aneugens were misclassified as clastogens, and only 1 of 38 non-genotoxicants was misclassified as clastogenic (imatinib mesylate).
Figure 4
Figure 4
Figure 4a. Multinomial logistic regression probabilities for aneugen classification are graphed for each of 84 chemicals studied at Litron. Chemicals are coded according to genotoxic MoA: clastogens = red circles, aneugens = blue squares, and non-genotoxicants = green triangles. A series of probabilities are plotted for each chemical, with each point representing a different concentration. These data show that each of the aneugens were correctly classified by the 4-factor aneugen detection model (two successive concentrations with probabilities in excess of 0.8, or one concentration in excess of 0.9). None of the clastogens or non-genotoxicants were misclassified as aneugens. Figure 4b. Multinomial logistic regression probabilities for clastogen classification are graphed for each of 84 chemicals studied at Litron. Chemicals are coded according to genotoxic MoA: clastogens = red circles, aneugens = blue squares, and non-genotoxicants = green triangles. A series of probabilities are plotted for each chemical, with each point representing a different concentration. These data show that 32 of 33 clastogens were correctly classified by the clastogen-detection model. None of the aneugens were misclassified as clastogens, and only 1 of 38 non-genotoxicants was misclassified as clastogenic (imatinib mesylate).
Figure 5
Figure 5
Figure 5a. Multinomial logistic regression probabilities for aneugen classification are graphed for each of 40 chemicals studied at Orion. Chemicals are coded according to genotoxic MoA: clastogens = red circles, aneugens = blue squares, and non-genotoxicants = green triangles. A series of probabilities are plotted for each chemical, as each represents a different concentration. These data show that each of the aneugens were correctly classified by the 4-factor aneugen detection model (two successive concentrations with probabilities in excess of 0.8, or one concentration in excess of 0.9). None of the clastogens or non-genotoxicants were misclassified as aneugens. Figure 5b. Multinomial logistic regression probabilities for clastogen classification are graphed for each of 40 chemicals studied at Orion. Chemicals are coded according to genotoxic MoA: clastogens = red circles, aneugens = blue squares, and non-genotoxicants = green triangles. A series of probabilities are plotted for each chemical, with each point representing a different concentration. These data show that all 14 clastogens were correctly classified by the clastogen-detection model. One aneugen at one concentration showed a high clastogen probability score (griseofulvin), and only 1 of 21 non-genotoxicants was misclassified as clastogenic (dexamethasone).
Figure 5
Figure 5
Figure 5a. Multinomial logistic regression probabilities for aneugen classification are graphed for each of 40 chemicals studied at Orion. Chemicals are coded according to genotoxic MoA: clastogens = red circles, aneugens = blue squares, and non-genotoxicants = green triangles. A series of probabilities are plotted for each chemical, as each represents a different concentration. These data show that each of the aneugens were correctly classified by the 4-factor aneugen detection model (two successive concentrations with probabilities in excess of 0.8, or one concentration in excess of 0.9). None of the clastogens or non-genotoxicants were misclassified as aneugens. Figure 5b. Multinomial logistic regression probabilities for clastogen classification are graphed for each of 40 chemicals studied at Orion. Chemicals are coded according to genotoxic MoA: clastogens = red circles, aneugens = blue squares, and non-genotoxicants = green triangles. A series of probabilities are plotted for each chemical, with each point representing a different concentration. These data show that all 14 clastogens were correctly classified by the clastogen-detection model. One aneugen at one concentration showed a high clastogen probability score (griseofulvin), and only 1 of 21 non-genotoxicants was misclassified as clastogenic (dexamethasone).
Figure 6
Figure 6
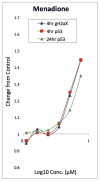
γH2AX (4 hr) and p53 (4 hr and 24 hr) responses are graphed for menadione-treated TK6 cells. Whereas the GEFs and lab-specific cutoff value approaches failed to recognize these modest responses as clastogenic, the multinomial logistic regression model interpreted the three clastogen-responsive biomarker results as clear evidence of clastogenic activity (probability > 90%).

References

    1. Ames BN, Durston WE, Yamasaki E, Lee FD. Carcinogens are mutagens: A simple test system combining liver homogenates for activation and bacteria for detection. PNAS. 1973;70:2281–2285. - PMC - PubMed
    1. Attia SM, Aleisa AM, Bakheet SA, Al-Yahya AA, Al-Rejaie SS, Ashour AE, Al-Shabanah OA. Molecular cytogenetic evaluation of the mechanism of micronucleus formation induced by camptothecin, topotecan, and irinotecan. Environ Mol Mutagen. 2009;50:145–151. - PubMed
    1. Attia SM. Molecular cytogenetic evaluation of the mechanism of genotoxic potential of amsacrine and nocodazole in mouse bone marrow cells. J Appl Toxicol. 2013;33:426–433. - PubMed
    1. Audebert M, Riu A, Jacques C, Hillenweck A, Jamin EL, Zalko D, Cravedi JP. Use of the γH2AX assay for assessing the genotoxicity of polycyclic aromatic hydrocarbons in human cell lines. Toxicol Lett. 2010;199:182–192. - PubMed
    1. Avlasevich SL, Bryce SM, Cairns SE, Dertinger SD. In vitro micronucleus scoring by flow cytometry: differential staining of micronuclei versus apoptotic and necrotic chromatin enhances assay reliability. Environ Mol Mutagen. 2006;47:56–66. - PubMed