. 2017 Apr 13;544(7649):250-254.
doi: 10.1038/nature21724. Epub 2017 Apr 3.

Mutual regulation of tumour vessel normalization and immunostimulatory reprogramming

Affiliations

Mutual regulation of tumour vessel normalization and immunostimulatory reprogramming

Lin Tian et al. Nature. .

Abstract

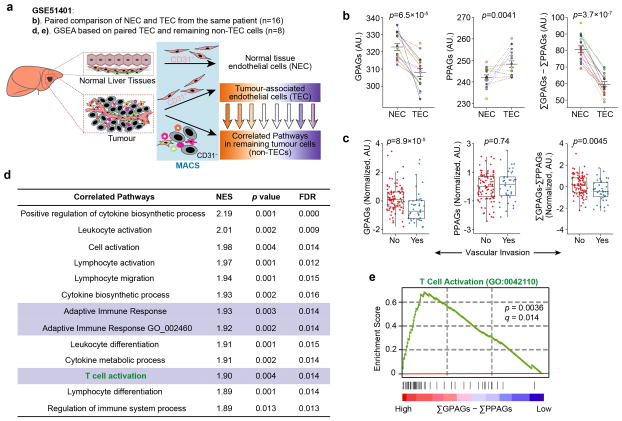
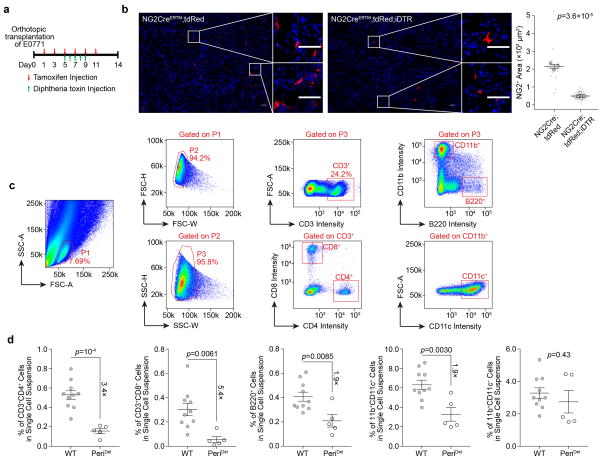
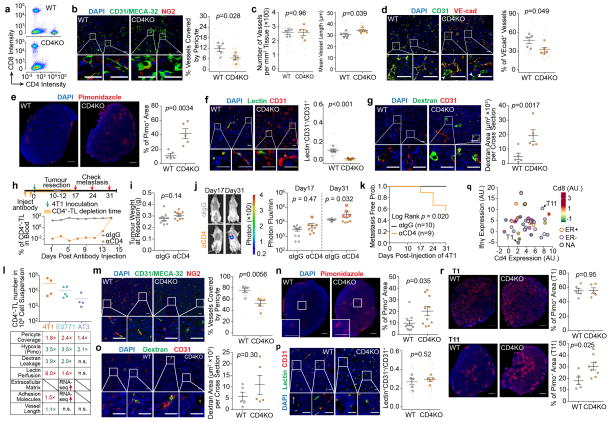
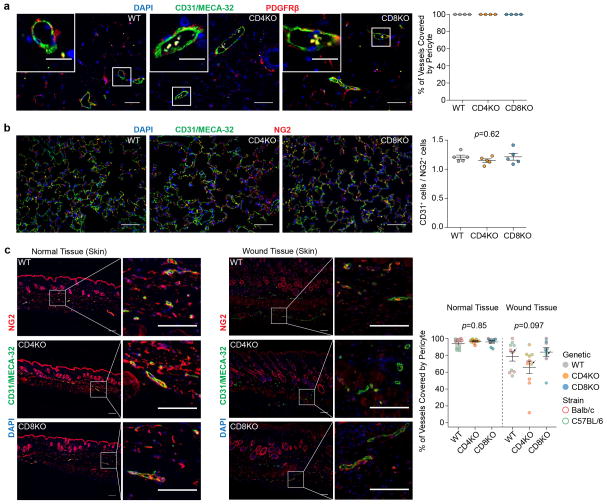
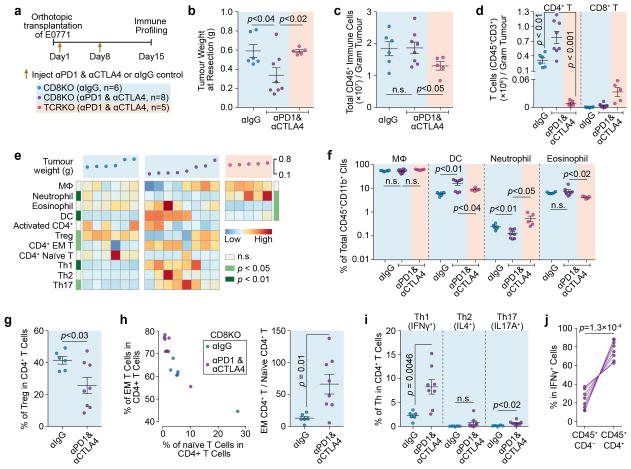
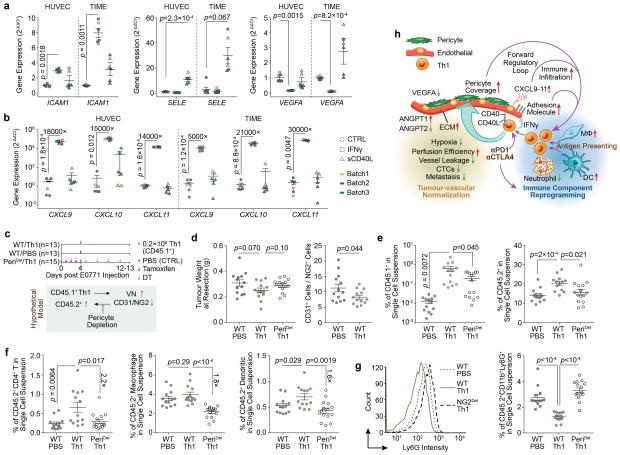
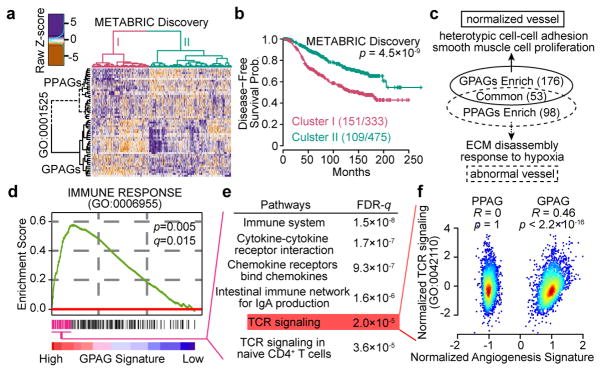
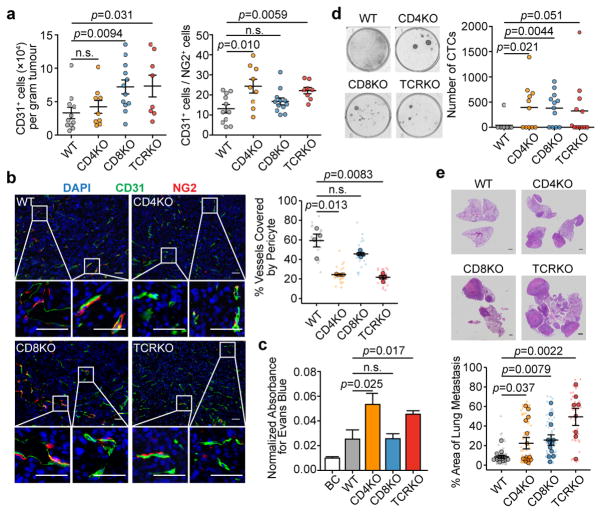
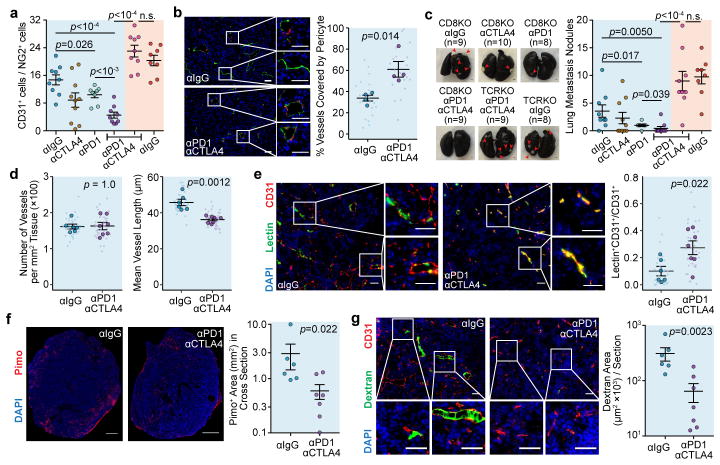
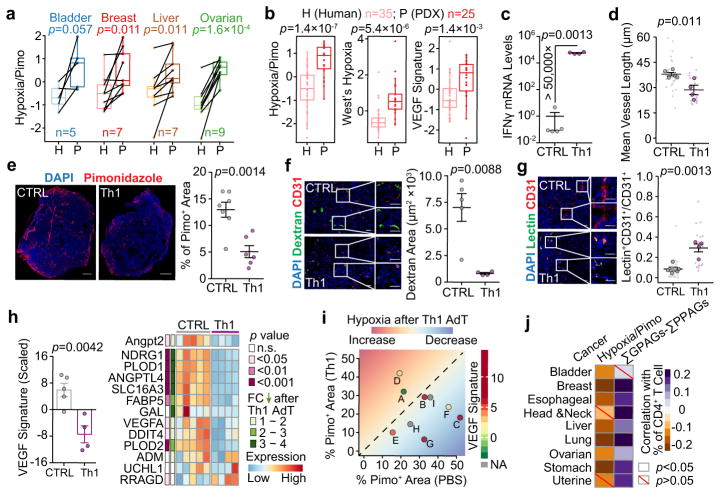
Blockade of angiogenesis can retard tumour growth, but may also paradoxically increase metastasis. This paradox may be resolved by vessel normalization, which involves increased pericyte coverage, improved tumour vessel perfusion, reduced vascular permeability, and consequently mitigated hypoxia. Although these processes alter tumour progression, their regulation is poorly understood. Here we show that type 1 T helper (TH1) cells play a crucial role in vessel normalization. Bioinformatic analyses revealed that gene expression features related to vessel normalization correlate with immunostimulatory pathways, especially T lymphocyte infiltration or activity. To delineate the causal relationship, we used various mouse models with vessel normalization or T lymphocyte deficiencies. Although disruption of vessel normalization reduced T lymphocyte infiltration as expected, reciprocal depletion or inactivation of CD4+ T lymphocytes decreased vessel normalization, indicating a mutually regulatory loop. In addition, activation of CD4+ T lymphocytes by immune checkpoint blockade increased vessel normalization. TH1 cells that secrete interferon-γ are a major population of cells associated with vessel normalization. Patient-derived xenograft tumours growing in immunodeficient mice exhibited enhanced hypoxia compared to the original tumours in immunocompetent humans, and hypoxia was reduced by adoptive TH1 transfer. Our findings elucidate an unexpected role of TH1 cells in vasculature and immune reprogramming. TH1 cells may be a marker and a determinant of both immune checkpoint blockade and anti-angiogenesis efficacy.


Conflict of interest statement

Competing financial interests

The authors declare no competing financial interests.

Figures

Extended Data Figure 1
Extended Data Figure 1. Evaluation of GPAGs and PPAGs in hepatocellular carcinoma links T cell activity with tumour vessel normalization
a). Schematic diagram for the bioinformatic analysis. NEC: Normal endothelial cells; TEC: Tumour-associated endothelial cells; MACS: magnetic-activated cell sorting. The numbers of patients are denoted in parentheses. b). GPAG and PPAG signatures of NECs versus TECs. n= NEC-TEC pairs from 16 patients. c). Comparison of GPAG and PPAG signatures in tumour with vascular invasion (n=40 patients) or without vascular invasion (n=95 patients). d). Pathways in the non-TEC cells that positively correlate with higher (ΣGPAGs–ΣPPAGs) in the paired TECs. e). GSEA mountain plot showing a strong association between (ΣGPAGs–ΣPPAGs) in the TEC and T cell activation signaling in the paired non-TEC cells. Data are presented as means ± s.e.m for dot plots. Data are obtained from GSE51401 (b, d–e), GSE20017 (c). P values were calculated using two-tailed paired Student’s t-test (b), two tailed unpaired Mann–Whitney U test (c), or a permutation-based approach with Benjamini–Hochberg multiple testing correction (d,e).
Extended Data Figure 2
Extended Data Figure 2. NG2+ cell-depleted mice display decreased immune infiltration in E0771 tumours
a). Schematic of the experimental design. b). Quantification of tumour-infiltrating NG2+ cells (NG2-CreERTM;tdRed, n=3; NG2-CreERTM; tdRed;iDTR, n=4). c). Flow cytometry gating strategy for tumour-infiltrating leukocytes. d). Flow cytometric quantification showing the decreased infiltration of TLs (CD3+CD4+ and CD3+CD8+), B cells (B220+), and dendritic cells (CD11b+CD11c+), but the percentage of total CD11b+ cells remains unchanged (WT, n=10; NG2-CreERTM;iDTR, n=5). Data are presented as means ± s.e.m. P values are determined by two-tailed paired Student’s t-test (b, d).
Extended Data Figure 3
Extended Data Figure 3. The effect of CD4+-TLs on promoting vessel normalization is cell number dependent
a). Flow cytometric plots of CD3+ cells of 4T1 tumour harvested from WT and CD4KO mice. Five animals were examined in each group. Representative plots are shown. b–g). Quantification of tumour vascular normalization markers including pericyte coverage (b), vessel density and vessel length (c), VE-cadherin expression (white arrow heads show vessels without VE-cadherin expression) (d), hypoxia measured by pimonidazole staining (e), lectin perfusion efficiency (f), and dextran leakage (g) (n=5/group; Scale bars, 50μm (d,f,g), 1mm (e)). h). (Top) Schematic of the experimental design. (Bottom) The two doses of antibody deplete CD4+-TLs for 2 weeks. One point represents one mouse. Whole blood was collected for the flow cytometric analysis. i). Dot plots showing that tumours were resected at similar size/weight j). Representative whole animal bioluminescence images showing spontaneous 4T1 metastasis in αIgG or αCD4 treated mice. Dots representing mice with detected metastases are labeled with a red boundary. k). Kaplan-Meier curves showing the metastasis-free frequency of 4T1 tumour-bearing mice treated with αIgG or αCD4. n=10 and 9 for αIgG and αCD4 groups, respectively (i–k). l). (Top) Flow cytometry quantification of tumour-infiltrating CD4+-TLs across three murine tumour models (4T1, n=4; E0771, n=5; AT3, n=4). The tumours were resected at similar size/weight (around 1 gram) from the same batch of experiments. (Bottom) A table summarizing the results from vessel normalization assays. The number indicates the fold change increased (red) or decreased (green) in WT mice compared to CD4KO mice. In E0771 model, RNA-seq reveals an increase in extracellular matrix and adhesion molecule gene expression in WT mice over CD4KO mice. m–p). Quantification of tumour vascular normalization markers (n=5/group; Scale bars, 50μm (m,o,p); n=10/group; Scale bars,1mm (n)). q). Scatter plot showing the Cd4 and Ifng gene expression levels of different p53−/− murine breast tumour models. The Cd8 gene expression and ER status are denoted by the colors of the dots and dot outlines, respectively. Two models chosen for hypoxia measurement are highlighted. r). Hypoxia quantification for T1 and T11 tumours in WT and CD4KO background as measured by pimonidazole staining (T1: n=5/group; T11: WT, n=5; CD4KO, n=8; Scale bars,1mm). Data are presented as means ± s.e.m. Animal numbers used in (i–k) are denoted in (k). P values are determined by two-tailed unpaired Student’s t-test (b–g,i,m–p,r), Fisher’s exact test (j) and Log-Rank test (k).
Extended Data Figure 4
Extended Data Figure 4. Comparison of pericyte coverage of normal tissues and wound tissues in different T cell deficient backgrounds
a). Quantification of pericyte coverage of blood vessels in the mammary gland. Since NG2 is also expressed by adipocytes, PDGFRβ was used as the marker for pericyte (n=4/group; Scale bars, 50μm; inset, 20μm). b). Representative fluorescent images and flow cytometric quantification of pericyte coverage of lung (n=5/group; Scale bars, 50μm). c). Quantification of pericyte coverage of normal skin tissues and skin wound tissues (WT, n=10; CD4KO, n=10; CD8KO, n=9; Scale bars, 50μm). Different immunodeficient backgrounds are denoted by the colors of the dots, and the strain information is denoted by the colors of point outlines. The points with arrows are the represented images of wound tissues in the left. Data are presented as means ± s.e.m. P values were calculated using non-parametric one-way ANOVA (Kruskal–Wallis) test (b–c). n.s., not significant.
Extended Data Figure 5
Extended Data Figure 5. Immune profiling on M-IIKO mice shows that CD4+-TL cell activation is inhibited
a,b). Flow cytometry quantification validating that M-IIKO mice have decreased MHC-II expression in tumour-infiltrating immune cells (CD45+), including macrophages (Mϕ, CD45+CD11b+Ly6G F4/80+), dendritic cells (DC, CD45+CD11b+Ly6GF4/80CD11c+), and B cells (CD45+B220+) (CTRL: n=10; M-IIKO: n=11). c). Flow cytometry gating of suspension cells dissociated from thymus, characterized as CD45+EpCAMimmune cells and CD45EpCAM+ epithelial cells. d,e). Quantification of MHC-II expression of thymus showing that MHC-II expression is inhibited in immune cells but preserved in epithelial cells in M-IIKO mice (CTRL: n=7; M-IIKO: n=6). f). Quantification of different types of tumour-infiltrating stroma cells (n=10/group). g). Quantification of MHC-II expression in different cell types (CTRL: n=10; Tie2Cre;H2Ab+/floxP: n=5; M-IIKO: n=11). h). Quantification of T cells in spleens from 5 – 6 week-old female mice showing the number of T cells is independent of MHC-II expression on Tie2Cre+ cells (CTRL: n=7; M-IIKO: n=6). i). Quantification of activated CD4+-TLs and effector CD4+-TLs from tumours of similar sizes. (activated CD4+-TL: CD45+CD3+CD4+CD25+FoxP3 Treg: CD45+CD3+CD4+CD25+FoxP3+; Effector memory cell: CD44+CD62L Naïve CD4+-TL: CD44CD62L+) (n=11/group). j). The percentages of CD4+-TL activation markers in spleen showing a similar pattern as in tumour (i) (CTRL: n=7; M-IIKO: n=6). k). Quantification of different E0771 tumour-infiltrating T helper cells (IFNγ+ Th1, IL4+ Th2 and IL17A+ Th17) (n=11/group). l). Quantification of E0771 tumour-infiltrating CD4+-TL cells, macrophage, dendritic cells, B cells and neutrophils (CD45+CD11b+Ly6Ghigh) (n=11/group). Data are presented as means ± s.e.m. The genetic backgrounds of mice are denoted with different colors shown on the right of (l). WT, Tie2Cre and H2AbfloxP/floxP were combined as CTRL group. P values were calculated using two-tailed unpaired Student’s t-test (a–b, d–f, h–k) or two-tailed unpaired Mann–Whitney U test (l). n.s., not significant.
Extended Data Figure 6
Extended Data Figure 6. Inhibition of MHC-II-mediated CD4+-TL activation phenocopies the depletion of CD4+-TL or NG2+ pericytes with regard to tumour VN and hypoxia
a). Immunofluorescence quantification of percentage endothelial cells (CD31+/MECA-32+) attached by pericytes (NG2+) (n=4/group), and flow cytometry quantification of endothelial cell to pericytes ratio. (CTRL: n=10; M-IIKO: n=11). b,c). Quantification of tumour-vasculature leakiness as measured by dextran (WT: n=5; M-IIKO: n=4; CD4KO: n=5; Scale bars, 50μm) and Evans Blue (WT: n=11; M-IIKO: n=8), respectively. d). Quantification of perfusion efficiency with lectin (WT: n=5; M-IIKO: n=4; CD4KO: n=5; Scale bars, 50μm). e,f). Quantification of tumour hypoxia with HIF1α (WT: n=5; M-IIKO: n=4; CD4KO: n=4; PeriDel, n=3; Scale bars, 50μm) and pimonidazole (WT: n=5; M-IIKO: n=4; CD4KO: n=5; PeriDel, n=8; Scale bars, 1mm). Data are presented as means ± s.e.m. P values were calculated using two-tailed unpaired Student’s t-test (a–f).
Extended Data Figure 7
Extended Data Figure 7. RNA-seq further supports that CD4+-TLs promote tumour vessel normalization
a). RNA-seq experiment design. FACS: fluorescence-activated cell sorting; MATQ-seq: multiple annealing and tailing based quantitative sequencing. b). t-Distributed Stochastic Neighbor Embedding (t-SNE) analysis of tumour-associated endothelial cells based on RNA-seq profiles of different transgenic mice. Different genetic backgrounds are denoted with different colors. c). ssGSEA projection of RNA-seq data validated the down-regulation of Immune Effector Process pathway (GO:0002697) in CD4+-TL deficient group. d). Analyses on RNA-seq data validated the down-regulation of GPAGs and up-regulation of PPAGs in CD4+-TL deficient group. e,f). Gene expression analysis of Vegfa and Angpt1/Angpt2 in tumour-associated CD31+ cells from different genetic backgrounds of mice. g). GSEA mountain plots showing increased biological activities in the tumour-associated vessel isolated from CD4+-TL competent backgrounds. h). A heatmap summarizing the top 20 genes upregulated in tumour-associated CD31+ cells isolated from CD4+-TL competent genetic background, compared to that from CD4+-TL deficient background. i). Analysis of sphingolipid metabolic process signature (GO:0006665) for tumour-associated CD31+ cells from different genetic background. j). Sphingolipid Metabolite Profiling of sphingolipid associated metabolites on whole E0771 tumour lysates from mice of different T cell deficient backgrounds. (WT, n=5; CD4KO, n=5; CD8KO, n=6; TCRKO, n=5). ASMase: acid sphingomyelinase; AC: acid ceramidase; SPHK: sphingosine kinase; P-choline: phosphatidylcholine; FA: fatty acid. All genotypes are divided into two groups based on CD4 status. CD4KO, TCRKO and conditional KO of H2Ab are deficient of CD4+-TL, and the others are not. The two groups have n= 9 and 10 animals, respectively. Data are presented as means ± s.e.m. Animal numbers used (b–i) are denoted in (b). P values were calculated using two-tailed unpaired Mann–Whitney U test (c–f, i), two-tailed one-way analysis of variance (ANOVA) (j) or permutation (g). n.s., not significant.
Extended Data Figure 8
Extended Data Figure 8. Spatial relationships between activated CD4+-TLs and lectin+ tumour-associated endothelial cells
a). Schematic of the experimental design. b). A table showing the counts of naïve CD4+-TLs (tdRed+CFSE+) and activated CD4+-TLs (tdRed+) in whole cross sectional area of five animals (n=5). c). The violin plots showing the kernel probability density of the distances of naïve and activated CD4+-TLs to the nearest lectin+ endothelial cells. Smaller dots without an outline are distances of individual CD4+-TL, and larger circles that are outlined represent mean distances taken over all CD4+-TLs in the section from the same mouse. CD4+-TLs from the same mouse are denoted with the same color. The p value was calculated using one sample Student’s t-test by comparing the mean distances of activated CD4+-TLs from individual mouse with the mean distance of all naïve CD4+-TLs (dashed horizontal line) (n=5 mice). d). (Top) Mosaic scanning images of whole tumour sections. Representative areas are magnified and naïve CD4+-TLs (yellow) are pinpointed with arrowhead. (Bottom) Solid lines show the distribution of distances between CD4+-TLs and lectin+ endothelial cells in whole tumour sections. The mean distances observed are shown as a vertical straight line. For comparison, dashed lines show the probability distribution of mean distances between endothelial cells and computer-simulated random dots. P values were calculated using a permutation based approach. More detailed information about image simulation is described in Method section.
Extended Data Figure 9
Extended Data Figure 9. ICB therapy promotes Th1 differentiation of CD4+-TLs and induces further immune reprogramming
a). Schematic of the experimental design. b). ICB leads to CD4+-TL dependent tumour growth inhibition, measured by tumour weight at Day 15 post E0771 injection. c,d).Total number of immune cells (c) and T cell (d) in tumours from different groups. Although the number of pan tumour-infiltrating immune cells (CD45+) is not changed, the number of CD4+-TLs increased after immune checkpoint blockade therapy. e). A heatmap summarizing changes to tumour-infiltrating immune components after ICB therapy. The number of different immune cells (rows) is shown for each tumour (columns) after control or checkpoint blockade treatment. The weight of each tumour is shown (top panel). Row-side annotations show p values comparing between CD8KO (αIgG) and CD8KO (αPD1αCTLA4) groups (far left column), and between CD8KO (αPD1αCTLA4) and TCRKO (αPD1αCTLA4) (far right column) (EM T: effector memory T cells). f). Quantification of different subsets among CD45+CD11b+ cells showing the effect of ICB on innate immune microenvironment (Eosinophil: CD45+CD11b+SiglecF+). g,h). Quantification of the percentage of Tregs among total CD4+-TLs, and the ratio of effector memory CD4+-TLs to naïve CD4+-TLs after ICB in CD8 KO mice. i). Quantification of the percentage of different CD4+ T helper cells. j). Percentage of IFNγ+ cells in CD4+ or CD4 cells among all the CD45+ tumour-associated immune cells, indicating CD4+-TLs make up the majority of IFNγ+ cells. Data are presented as means ± s.e.m. Animal numbers used in (b–j) are denoted in (a). P values were calculated using two-tailed unpaired (b–i) or paired (j) Student’s t-test.
Extended Data Figure 10
Extended Data Figure 10. Molecular and cellular mechanisms that contribute to tumour immunostimulatory reprogramming positive feedback loop
a,b). Quantitative RT-PCR analysis showing the effect of IFNγ and sCD40L on the mRNA levels of adhesion molecules, VEGFA (a), and T cell attractant chemokines (b). The experiments were repeated independently for three times (batches) with technical duplicates in each time. c). Schematic of the experimental design and hypothetical model. d). Tumours resected at Day12 – 13 post E0771 injection have similar size/weight, and the effect of Th1 adoptive transfer on vessel normalization as measured by the CD31+ endothelial cells to NG2+ pericytes ratio. e). Flow cytometry quantification CD45.1+ adoptive transferred Th1 cells, and CD45.2+ host immune cells. f). Characterization and quantification of CD45.2+ host immune cells showing that Th1-mediated immune infiltration is partially dependent on pericyte coverage. g). Effect of Th1 adoptive transfer and pericyte depletion on CD11b+Ly6G+ immune cells demonstrating different pattern with other tumour-infiltrating immune cells as from (f). h). Schematic summary of CD4+-TL-mediated vessel normalization, and subsequent formation of positive feedback loop through cell-cell interaction, cytokine production and increased pericyte coverage. Checkpoint blockade therapy and antigen presentation enhance Th1-skewed CD4+-TL activation and promote the vessel normalization/immunostimulatory reprogramming positive feedback loop. Data are presented as means ± s.e.m. Animal numbers used in (d–g) are denoted in (c). P values were calculated using two-tailed unpaired Student’s t-test based on biological replicates (a,b,d–g). Technical replicates are averaged within each biological replicate (a,b).
Figure 1
Figure 1. The dichotomy of angiogenesis-related genes supports the “vessel normalization theory”, and links good prognosis angiogenesis genes to T cell signaling
a,b). Hierarchical clustering of prognosis-related angiogenesis genes reveals two clusters of patients, and disease-free survival of the two clusters of patients. c). Pathways associated with GPAGs/PPAGs. Numbers of pathways shown in parentheses. d). GSEA reveals an association between Immune Response pathway and GPAGs. e). Top pathways associated with leading subset genes in (d). f). Scatter plot showing the correlation between TCR signaling genes and GPAG/PPAG signatures in METABRIC Discovery and Validation datasets (N=1992 patients). P values are determined by log rank tests (b), random permutation (d), hypergeometric test (e), and Student’s t-test (f). FDR or q values are determined by Benjamini-Hochberg adjustment (d,e).
Figure 2
Figure 2. Depletion of CD4+-TLs decreases tumour vessel pericyte coverage and increases metastasis
a). Flow cytometry quantification of E0771 tumour-infiltrating endothelial cells (CD31+) and pericytes (NG2+) (WT, n=11; CD4KO, n=9; CD8KO, n=12; TCRKO, n=8). b). Staining and quantification of endothelial cells (green) attached by pericytes (red) (n=4/group; Scale bar, 50μm) c). Normalized absorbance of Evans blue in tumours (BC (blank control), n=5; WT, n=11; CD4KO, n=11; CD8KO, n=12; TCRKO, n=12). d). Blood CTC frequencies from tumour-bearing mice (WT, n=11; CD4KO, n=11; CD8KO, n=12; TCRKO, n=12). e). Lung metastatic area from H&E images (WT, n=14; CD4KO, n=14; CD8KO, n=12; TCRKO, n=8; Scale bar, 1mm). Mean ± s.e.m shown. Smaller dots are values from individual fields (b) and whole lung sections (e). Outlined circles are mean values taken over multiple fields/sections from the same mouse. P values were calculated by comparing individual animals using two-tailed unpaired Student’s t-test (a–c,e) or two-tailed unpaired Mann–Whitney U test (d). n.s., not significant.
Figure 3
Figure 3. ICB therapy increases vessel normalization and decreases metastasis
a). Tumour-infiltrating endothelial cells:pericyte ratio by flow cytometry. b). Percentage endothelial attached by pericytes (n=4/group; Scale bar, 50μm). c). Lung metastasis nodule count by Indian Ink Assay (Scale bar, 1mm). d–g). Vessel length (d), lectin perfusion efficiency (e), pimonidazole staining (f), and dextran leakage (g) (αIgG, n=6; αPD1αCTLA4, n=7; Scale bar, 50μm (e,g), 1mm (f)). Mean ± s.e.m shown. Animal numbers used in (a,c) are denoted in (c). P values were calculated by two-tailed unpaired Student’s t-test (a,b) or two-tailed unpaired Mann–Whitney U test (c–g). n.s., not significant.
Figure 4
Figure 4. Human tumours transplanted into immunocompromised mice (PDX) exhibit enhanced hypoxia features, which can be mitigated by Th1 adoptive transfer
a). Hypoxia signature in PDX tumours compared to the paired original patient tumour in different cancers. b). Unpaired comparison of three hypoxia-related gene signatures between breast cancer patients and PDX samples. c). Quantitative RT-PCR analysis of Ifnγ in MDA-MB-231 tumours with Th1 adoptive transfer. d–g). Vessel length (d), pimonidazole staining (e), dextran leakage (f), and lectin perfusion efficiency (g) following Th1 adoptive transfer (Scale bar, 1mm (e), 50μm (f,g)). h). (Left) Scaled VEGF signature. (Right) Relative expression levels of individual genes in each sample. FC, fold change. i). Percentage of pimonidazole+ area in nine PDX models after Th1 adoptive transfer. AdT, adoptive transfer. j). Correlation between the percentage of CD4+-TLs with pimonidazole-based hypoxia signature and (ΣGPAGs ΣPPAGs) in different cancers. Mean ± s.e.m shown; PBS, n=5; Th1, n=4 (c–h). P values were calculated using two-tailed unpaired Student’s t-test (a–h,j). Information on datasets and analytical methods (a,b,i,j), and PDX (i) can be found in Methods and Supplementary Table 4, respectively

Comment in

References

    1. Ebos JML, et al. Accelerated metastasis after short-term treatment with a potent inhibitor of tumor angiogenesis. Cancer Cell. 2009;15:232–239. - PMC - PubMed
    1. Paez-Ribes M, et al. Antiangiogenic therapy elicits malignant progression of tumors to increased local invasion and distant metastasis. Cancer Cell. 2009;15:220–231. - PMC - PubMed
    1. Goel S, Wong AHK, Jain RK. Vascular normalization as a therapeutic strategy for malignant and nonmalignant disease. Cold Spring Harb Perspect Med. 2012;2:a006486. - PMC - PubMed
    1. Hamzah J, et al. Vascular normalization in Rgs5-deficient tumours promotes immune destruction. Nature. 2008;453:410–414. - PubMed
    1. Curtis C, et al. The genomic and transcriptomic architecture of 2,000 breast tumours reveals novel subgroups. Nature. 2012;486:346–352. - PMC - PubMed

Publication types

MeSH terms

Substances