. 2017 May:19:128-138.
doi: 10.1016/j.ebiom.2017.03.033. Epub 2017 Mar 28.

A Comprehensive Evaluation of Nasal and Bronchial Cytokines and Chemokines Following Experimental Rhinovirus Infection in Allergic Asthma: Increased Interferons (IFN-γ and IFN-λ) and Type 2 Inflammation (IL-5 and IL-13)

Affiliations

A Comprehensive Evaluation of Nasal and Bronchial Cytokines and Chemokines Following Experimental Rhinovirus Infection in Allergic Asthma: Increased Interferons (IFN-γ and IFN-λ) and Type 2 Inflammation (IL-5 and IL-13)

Trevor T Hansel et al. EBioMedicine. 2017 May.

Abstract

Background: Rhinovirus infection is a major cause of asthma exacerbations.

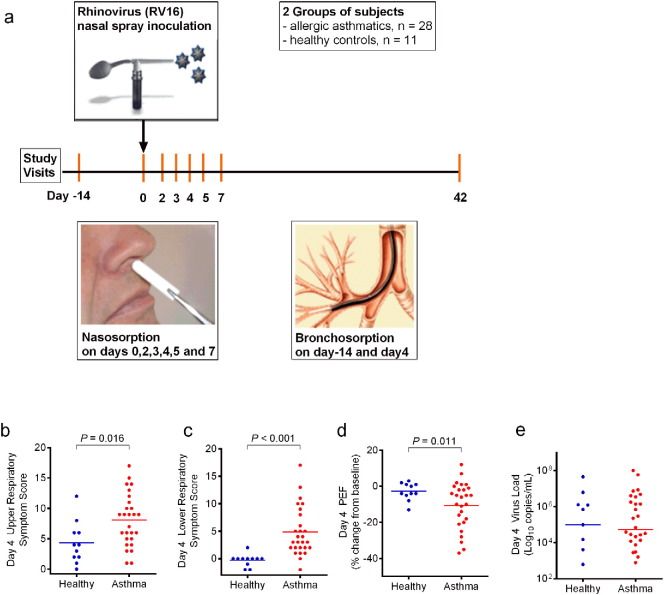
Objectives: We studied nasal and bronchial mucosal inflammatory responses during experimental rhinovirus-induced asthma exacerbations.

Methods: We used nasosorption on days 0, 2-5 and 7 and bronchosorption at baseline and day 4 to sample mucosal lining fluid to investigate airway mucosal responses to rhinovirus infection in patients with allergic asthma (n=28) and healthy non-atopic controls (n=11), by using a synthetic absorptive matrix and measuring levels of 34 cytokines and chemokines using a sensitive multiplex assay.

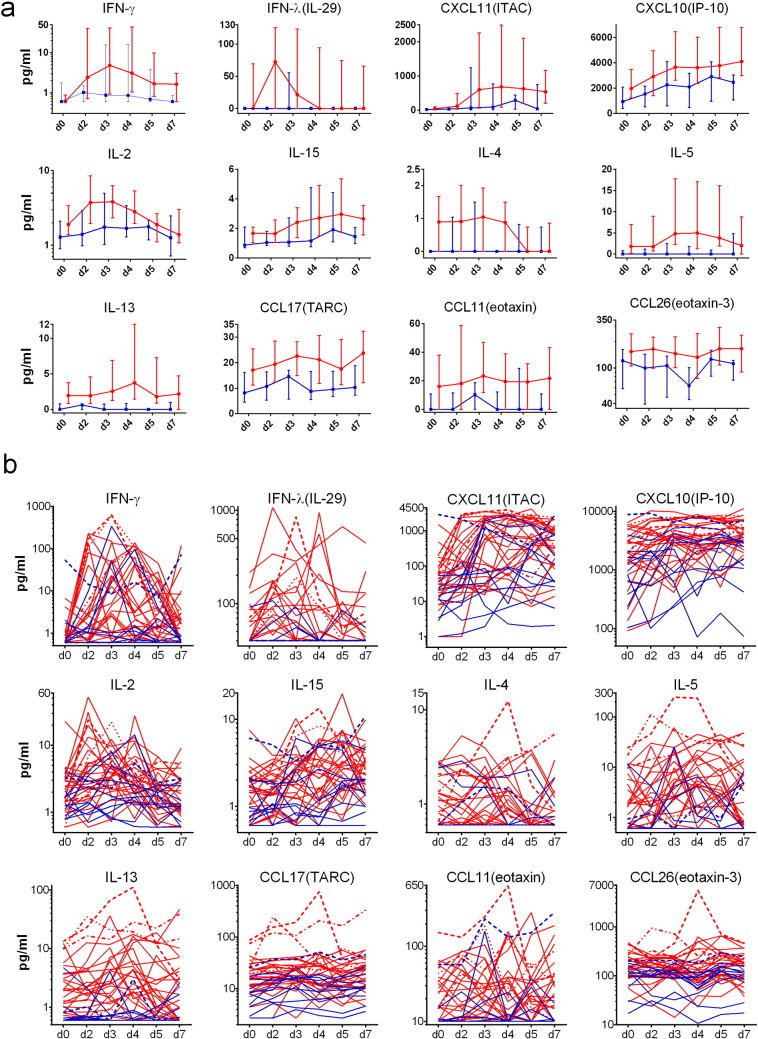
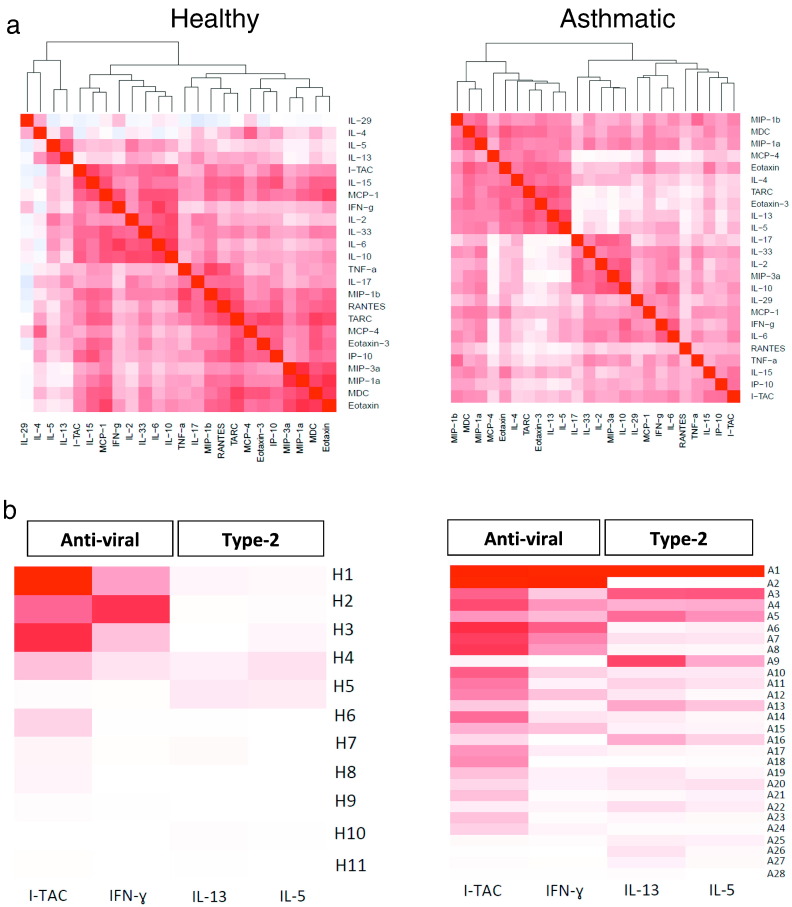
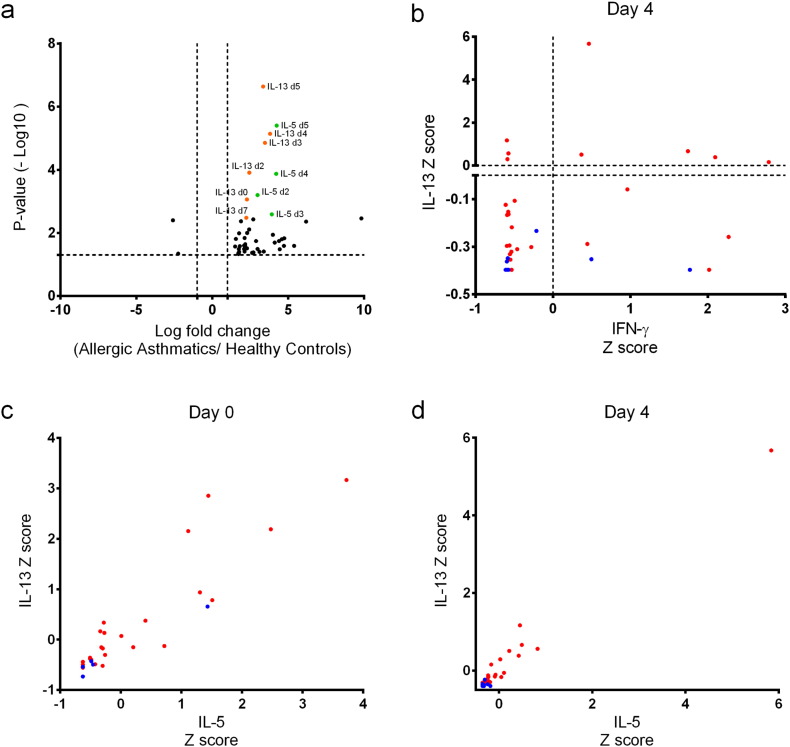
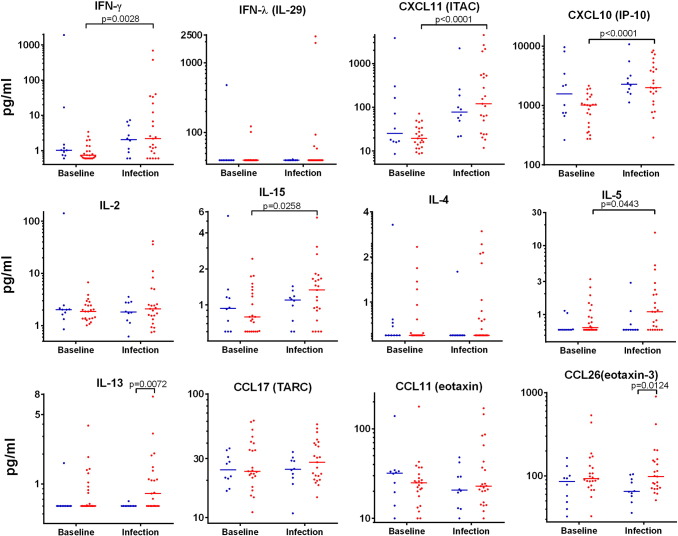
Results: Following rhinovirus infection asthmatics developed more upper and lower respiratory symptoms and lower peak expiratory flows compared to controls (all P<0.05). Asthmatics also developed higher nasal lining fluid levels of an anti-viral pathway (including IFN-γ, IFN-λ/IL-29, CXCL11/ITAC, CXCL10/IP10 and IL-15) and a type 2 inflammatory pathway (IL-4, IL-5, IL-13, CCL17/TARC, CCL11/eotaxin, CCL26/eotaxin-3) (area under curve day 0-7, all P<0.05). Nasal IL-5 and IL-13 were higher in asthmatics at day 0 (P<0.01) and levels increased by days 3 and 4 (P<0.01). A hierarchical correlation matrix of 24 nasal lining fluid cytokine and chemokine levels over 7days demonstrated expression of distinct interferon-related and type 2 pathways in asthmatics. In asthmatics IFN-γ, CXCL10/IP10, CXCL11/ITAC, IL-15 and IL-5 increased in bronchial lining fluid following viral infection (all P<0.05).

Conclusions: Precision sampling of mucosal lining fluid identifies robust interferon and type 2 responses in the upper and lower airways of asthmatics during an asthma exacerbation. Nasosorption and bronchosorption have potential to define asthma endotypes in stable disease and at exacerbation.

Keywords: Absorption of mucosal lining fluid; Asthma; Interferons; Mucosal immunology; Rhinovirus; Type II inflammation.


Figures

Fig. 1
Fig. 1
Study design with clinical and viral load responses to rhinovirus infection. Nasal inoculation with rhinovirus 16 (RV16) was performed in 28 asthmatic and 11 healthy controls (a). Nasal mucosal lining fluid was sampled by the technique of nasosorption on days 0,2,3,4,5 and 7 post-inoculation. Bronchial lining fluid was sampled by bronchosorption at baseline (− 14d) and day 4 post-inoculation. Upper (b) and lower (c) respiratory tract symptom scores, with changes in morning peak expiratory flow (PEF) from baseline (d) and nasal viral load (e) are shown for asthmatic (red) and healthy (blue) subjects. Bars represent mean values (b-d) or median values (e). This clinical data and the viral load responses have previously been reported (Jackson et al., 2014).
Fig. 2
Fig. 2
Nasal mucosal lining fluid cytokine and chemokine levels. Levels of 12 cytokines and chemokines in nasal mucosal lining fluid obtained by nasosorption were determined by multiplex immunoassay. (a). Median levels with quartiles for allergic asthmatics (red) and healthy control subjects (blue). (b). Individual values for all subjects (shown on log scale): asthmatics (red, n = 28) and healthy subjects (blue, n = 11). Four representative asthmatics and one healthy control subject are given specific line patterns to allow identification of these individuals across the panel of cytokine responses. See Tables S4–9 for relevant statistical analyses on nasosorption levels of cytokines and chemokines: noting that for the 12 cytokines and chemokines displayed the area under the curve (AUC) for days 0–7 was significantly greater in allergic asthmatics than in healthy controls (P < 0.05 in all cases) (Table S5). formula image
Fig. 3
Fig. 3
Nasal mucosal lining fluid heat maps. (a) Dynamical hierarchical correlation matrix for nasosorption levels of 24 cytokines and chemokines on days 0 to 7 generated using R statistical analysis software (version 2.15.2) (Opgen-Rhein & Strimmer, 2006). Cytokines are grouped together according to the strength of correlation using hierarchical clustering, as represented by the dendrogram. Positive or negative correlation is shown in the colour key. (b) Individual responses in terms of nasal cytokine and chemokine responses in individual subjects are shown as individual rows for separate healthy control (n = 11) (left) and allergic asthmatic (n = 28) (right) subjects. The order of asthmatic and healthy subjects was generated within a group in terms of the overall AUC (day 0–7) intensity, ranging from the highest mean value at the top to the lowest mean value at the bottom (controls and asthmatics together). The columns are for representative anti-viral (IFN-γ and ITAC/CXCL11) and type 2 (IL-5 and IL-13) cytokines and chemokines. R statistical analysis software (version 3.0.2) was used to generate heat maps. Colour intensity ranges from dark red (close correlation) to white (minimum correlation) for each cytokine/chemokine across all subjects. For 2 missing samples the last observation was carried forward (LOCF). formula image
Fig. 4
Fig. 4
Nasal Mucosal Lining Fluid Volcano Plot and Cluster Analyses. (a) Volcano plot analysis was performed on normal transformed data for all 34 cytokines and chemokines, assessing the fold change between asthmatics and controls from day 0 in relation to days 2,3,4,5 and 7 post infection. The fold change was calculated between asthmatics and controls using mean levels of cytokine or chemokine on particular days. P values were derived by t-test and corrected for multiple testing (Benjamin-Hochberg), the horizontal dotted line demonstrates the cut off value for P = 0.05. (b) Cluster analysis of nasosorption levels of IFN-γ and IL-13 on day 4, with horizontal and vertical lines on zero. This shows the distribution of asthmatic subjects (red dots) and healthy controls (blue): asthmatics have high and low levels of IFN-γ and IL-13 (with red dots in 4 quadrants), while control subjects have low levels of IL-13 but can have higher levels of IFN-γ (with blue dots in 2 quadrants). (c) (d) These cluster analyses used levels of nasosorption IL-5 and IL-13 (Z score normalised) on day 0 and day 4 plotted as a 2D cluster. This illustrates how nasal IL-5 and IL-13 can be used to discriminate asthmatics from controls, and how nasal IL-5 and IL-13 levels are related.
Fig. 5
Fig. 5
Bronchial mucosal lining fluid levels of 12 cytokines and chemokines. Individual raw data is presented for levels of cytokines and chemokines in bronchial lining fluid, for asthmatic (red) and healthy (blue) subjects. Baseline bronchial samples were taken on day - ~ 14 before inoculation with rhinovirus, while post samples were taken on day 4 post-inoculation. Probability was tested using a Wilcoxon signed rank test: matched/paired samples (baseline/day 4) and the Mann-Whitney test for the unmatched samples (healthy vs asthma). Data is shown for asthmatics (n = 25) and healthy volunteers (n = 11) at baseline and (n = 10) for day 4. A full table of summary statistics and probability values is given in the Table S12. For display purposes on a log scale, the lower limit of detection (LLD) was used for all cytokines with values ≤ LLD.

Comment in

References

    1. Alam R., Sim T.C., Hilsmeier K., Grant J.A. Development of a new technique for recovery of cytokines from inflammatory sites in situ. J. Immunol. Methods. 1992;155:25–29. - PubMed
    1. Bardin P.G., Sanderson G., Robinson B.S., Holgate S.T., Tyrrell D.A. Experimental rhinovirus infection in volunteers. Eur. Respir. J. 1996;9:2250–2255. - PubMed
    1. Barnig C., Cernadas M., Dutile S., Liu X., Perrella M.A., Kazani S., Wechsler M.E., Israel E., Levy B.D. Lipoxin A4 regulates natural killer cell and type 2 innate lymphoid cell activation in asthma. Sci. Transl. Med. 2013;5 (174ra126) - PMC - PubMed
    1. Bartemes K.R., Kephart G.M., Fox S.J., Kita H. Enhanced innate type 2 immune response in peripheral blood from patients with asthma. J. Allergy Clin. Immunol. 2014;134:671–678. (e674) - PMC - PubMed
    1. Beale J., Jayaraman A., Jackson D.J., Macintyre J.D., Edwards M.R., Walton R.P., Zhu J., Ching Y.M., Shamji B., Edwards M., Westwick J., Cousins D.J., Hwang Y.Y., McKenzie A., Johnston S.L., Bartlett N.W. Rhinovirus-induced IL-25 in asthma exacerbation drives type 2 immunity and allergic pulmonary inflammation. Sci. Transl. Med. 2014;6 (256ra134) - PMC - PubMed