. 2017 May 15;6(5):602-618.
doi: 10.1242/bio.021758.

Mouse embryonic dorsal root ganglia contain pluripotent stem cells that show features similar to embryonic stem cells and induced pluripotent stem cells

Affiliations

Mouse embryonic dorsal root ganglia contain pluripotent stem cells that show features similar to embryonic stem cells and induced pluripotent stem cells

Ryuhei Ogawa et al. Biol Open. .

Abstract

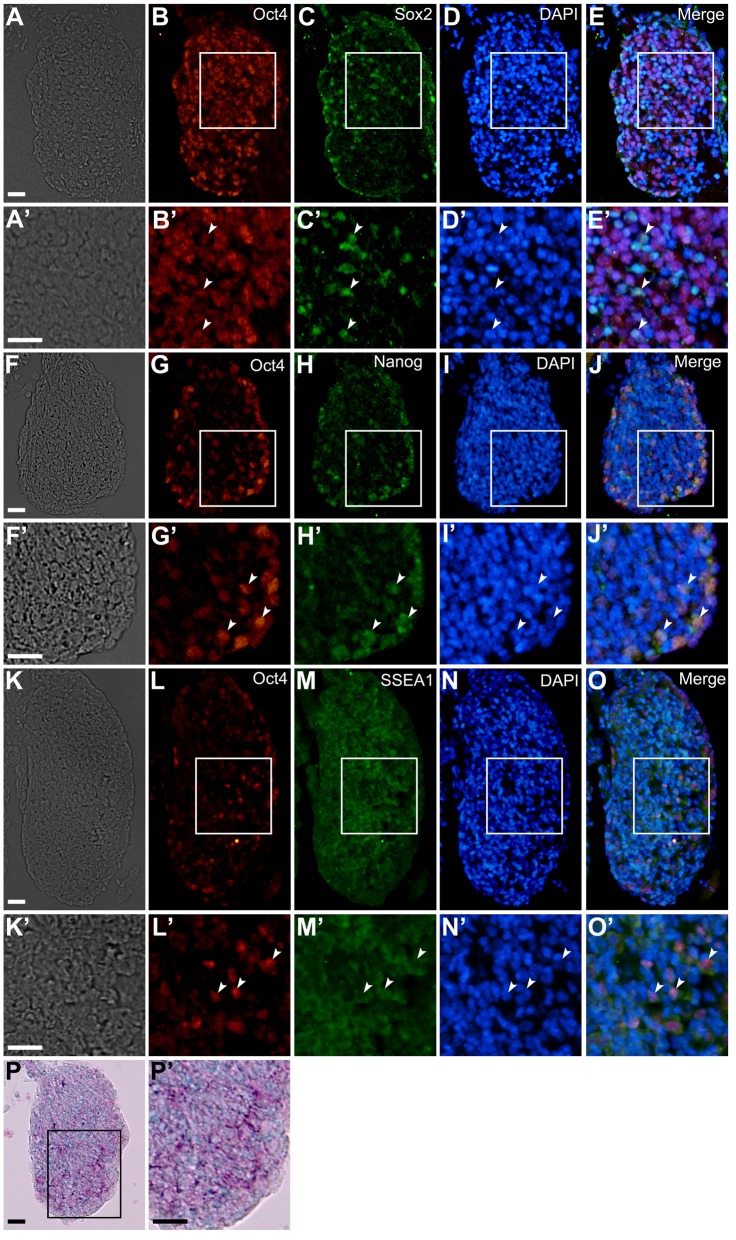
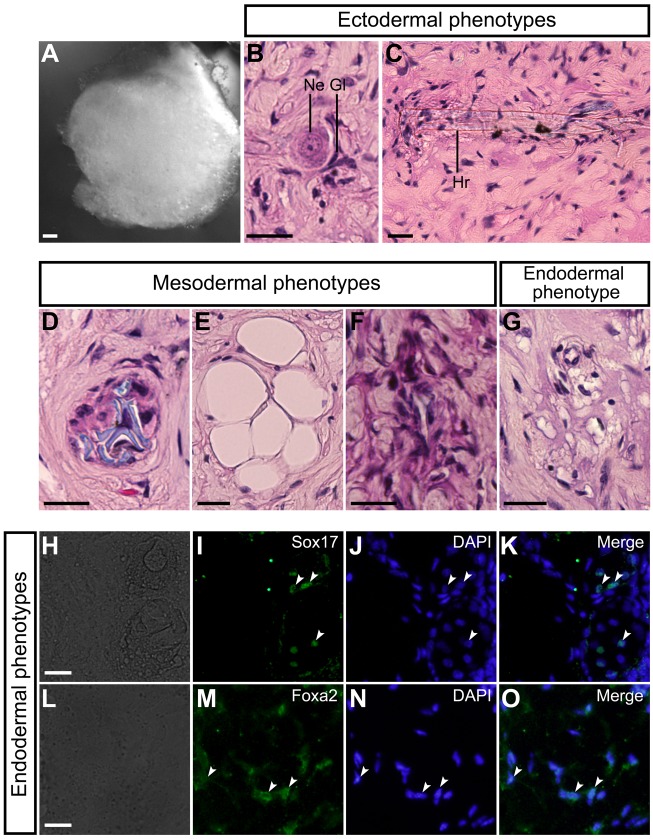
In the present study, we showed that the dorsal root ganglion (DRG) in the mouse embryo contains pluripotent stem cells (PSCs) that have developmental capacities equivalent to those of embryonic stem (ES) cells and induced pluripotent stem cells. Mouse embryonic DRG cells expressed pluripotency-related transcription factors [octamer-binding transcription factor 4, SRY (sex determining region Y)-box containing gene (Sox) 2, and Nanog] that play essential roles in maintaining the pluripotency of ES cells. Furthermore, the DRG cells differentiated into ectoderm-, mesoderm- and endoderm-derived cells. In addition, these cells produced primordial germ cell-like cells and embryoid body-like spheres. We also showed that the combination of leukemia inhibitor factor/bone morphogenetic protein 2/fibroblast growth factor 2 effectively promoted maintenance of the pluripotency of the PSCs present in DRGs, as well as that of neural crest-derived stem cells (NCSCs) in DRGs, which were previously shown to be present there. Furthermore, the expression of pluripotency-related transcription factors in the DRG cells was regulated by chromodomain helicase DNA-binding protein 7 and Sox10, which are indispensable for the formation of NCSCs, and vice versa. These findings support the possibility that PSCs in mouse embryonic DRGs are NCSCs.

Keywords: Dorsal root ganglia; Mouse; Neural crest-derived stem cells; Pluripotency-related transcription factors; Pluripotent stem cells; Signaling molecules.


Conflict of interest statement

Competing interestsThe authors declare no competing or financial interests.

Figures

Fig. 1.
Fig. 1.
Expression patterns of Oct4, Sox2, Nanog, and SSEA1 in mouse embryonic DRGs. (A-O) Transverse sections of E12 mouse DRGs. The top, bottom, left, and right of each photograph correspond to the dorsal, ventral, proximal, and distal side of the embryo, respectively. (A) Bright-field image. (B) Expression pattern of Oct4 in the same field as A. (C) Expression pattern of Sox2 in the same field as A. (D) DAPI nuclear staining of the same field as A. (E) Merged image of B-D. (F) Bright-field image. (G) Expression pattern of Oct4 in the same field as F. (H) Expression pattern of Nanog in the same field as F. (I) DAPI nuclear staining of the same field as F. (J) Merged image of G-I. (K) Bright-field image. (L) Expression pattern of Oct4 in the same field as K. (M) Expression pattern of SSEA1 in the same field as K. (N) DAPI nuclear staining of the same field as K. (O) Merged image of L-N. (P) Alkaline phosphatase activity (purple) in mouse embryonic DRGs. Nuclei were stained by methyl green (blue). A′-E′,F′-J′,K′-O′, and P′ show enlarged images of boxed regions in A-E,F-J,K-O, and P, respectively. White arrowheads indicate cells expressing both Oct4 and Sox2 (B′-E′), both Oct4 and Nanog (G′-J′), and both Oct4 and SSEA1 (L′-O′). Scale bars: 20 µm.
Fig. 2.
Fig. 2.
Developmental capacities of mouse embryonic DRG cells in explant cultures. (A) E12 mouse DRG explants were exposed to various differentiation-promoting factors for 4 or 6 days. Immunostaining was performed by using anti-NF68, anti-GFAP, anti-SMA, anti-Collagen type II, anti-Sox17, or anti-Foxa2 on culture day 4 or 6. (B) Bright-field image. (C) Anti-NF68-positive cells in the same field as B. (D) DAPI nuclear staining of the same field as B. (E) Merged image of C and D. (F) Bright-field image. (G) Anti-GFAP-positive cells in the same field as F. (H) DAPI nuclear staining of the same field as F. (I) Merged image of G and H. (J) Bright-field image. (K) Anti-SMA-positive cells in the same field as J. (L) DAPI nuclear staining of the same field as J. (M) Merged image of K and L. (N) Bright-field image. (O) Anti-Collagen type II-positive cells in the same field as N. (P) DAPI nuclear staining of the same field as N. (Q) Merged image of O and P. (R) Bright-field image. (S) Anti-Sox17-positive cells in the same field as R. (T) DAPI nuclear staining of the same field as R. (U) Merged image of S and T. (V) Bright-field image. (W) Anti-Foxa2-positive cells in the same field as V. (X) DAPI nuclear staining of the same field as V. (Y) Merged image of W and X. Scale bars: 50 µm.
Fig. 3.
Fig. 3.
Developmental capacities of single DRG cells. E12 mouse DRG explants were cultured for 2 days and clonal culture analysis was subsequently performed in the presence of differentiation promoting factors for 5 days. Immunostaining using anti-SMA and anti-NF68, anti-SMA and anti-Foxa2, or anti-SMA and anti-GFAP was carried out on culture day 7. (A) Anti-SMA-positive cells. (B) Anti-NF68-positive cells in the same field as A. (C) DAPI nuclear staining of the same field as A. (D) Merged image of A-C. (E) Anti-SMA-positive cells. (F) Anti-Foxa2-positive cells in the same field as E. (G) DAPI nuclear staining of the same field as E. (H) Merged image of E-G. (I) Anti-GFAP-positive cells. (J) Anti-Foxa2-positive cells in the same field as I. (K) DAPI nuclear staining of the same field as I. (L) Merged image of I-K. B′ shows enlarged images of boxed region in B. Blue arrowheads indicate anti-SMA-positive cells (A,C,D,E,G, and H) or anti-GFAP-positive cells (I,K, and L). Orange arrowheads indicate anti-NF68-positive cells (B-D) or anti-Foxa2-positive cells (F-H). White arrows of I-L indicate cells expressing both GFAP and Foxa2. Scale bars: 50 µm.
Fig. 4.
Fig. 4.
In vivo developmental capacities of mouse embryonic DRG cells. (A) Teratomas were harvested at 2-3 months after injection of dissociated cells derived from E12 mouse DRGs. (B) Glia (Gl) and neuron (Ne). (C) Nerve fiber. (D) Bone and bone marrow. (E) Bone matrix (Bm) and osteocytes (Ocy) in enlarged images of one of the boxed regions in D. (F) Megakaryocyte (Meg), hematopoietic cells (Hec), and red blood cells (Rbc) in enlarged images of the boxed regions in D. (G) Chondrocytes (Ccy). (H) Adipocytes. (I) Smooth muscle (Sm). (J) Bright-field image. (K) Anti-Sox17-positive cells in the same field as J. (L) DAPI nuclear staining of the same field as J. (M) Merged image of K and L. White arrowheads in K-M indicate typical cells containing Sox17. (N) Bright-field image. (O) Anti-Foxa2-positive cells in the same field as N. (P) DAPI nuclear staining of the same field as N. (Q) Merged image of O and P. White arrowheads in O-Q indicate typical cells containing Foxa2. Scale bars: 200 µm in A; 50 µm in D; 20 µm in B,C,E-J, and N.
Fig. 5.
Fig. 5.
Signaling molecules that promote maintenance of NCSCs in mouse embryonic DRGs. E12 mouse DRG explants were exposed to signaling molecules for 6 days. Immunostaining was performed using anti-CHD7 or anti-Sox10 on culture day 6. (A) Bright-field image of a culture treated with LIF/BMP2/FGF2. (B) Anti-CHD7-positive cells in the same field as A. (C) Anti-Sox10-positive cells in the same field as A. (D) DAPI nuclear staining of the same field as A. (E) Merged image of B-D. (F) Percentage of cells expressing both CHD7 and Sox10 per DRG cell colony. *P<0.05 (Student's t-test) compared to untreated cultures. Data are expressed as mean±s.e.m. of separate counts of 5-16 colonies (the number in parentheses above each bar). Scale bar: 50 µm.
Fig. 6.
Fig. 6.
Effects of LIF/BMP2/FGF2 on expression of Oct4. E12 mouse DRG explants were exposed to signaling molecules for 2, 4, 6, or 9 days. Immunostaining was performed using anti-Oct4 on culture day 2, 4, 6, or 9. (A) Bright-field image of a culture treated with LIF/BMP2/FGF2 for 6 days. (B) Anti-Oct4-positive cells in the same field as A. (C) DAPI nuclear staining of the same field as A. (D) Merged image of B and C. (E) Percentage of cells expressing Oct4 per DRG cell colony. *P<0.05 (Student's t-test) compared to the cultures at 2 days under the respective conditions. Data are expressed as mean±s.e.m. of separate counts of 5-12 colonies (the number in parentheses above each bar). Scale bar: 50 µm.
Fig. 7.
Fig. 7.
Effects of LIF/BMP2/FGF2 on expression of Sox2 and Nanog. E12 mouse DRG explants were cultured in medium containing LIF/BMP2/FGF2 for 6 days. Immunostaining was performed using anti-Oct4, anti-Sox2, or anti-Nanog on culture day 6. (A) Bright-field image of a culture treated with LIF/BMP2/FGF2. (B) Anti-Sox2-positive cells in the same field as A. (C) Anti-Oct4-positive cells in the same field as A. (D) DAPI nuclear staining of the same field as A. (E) Merged image of B-D. (F) Bright-field image of LIF/BMP2/FGF2-treated culture. (G) Anti-Nanog-positive cells in the same field as F. (H) Anti-Oct4-positive cells in the same field as F. (I) DAPI nuclear staining of the same field as F. (J) Merged image of G-I. (K) Percentage of cells expressing Sox2 per DRG cell colony. (L) Percentage of cells expressing Nanog per DRG cell colony. (M) Percentage of cells expressing both Oct4 and Sox2 per total cells expressing Sox2 in a DRG cell colony. (N) Percentage of cells coexpressing Oct4 and Nanog per total cells expressing Nanog in a DRG cell colony. *P<0.05 (Student's t-test) compared to untreated cultures. Data are expressed as mean±s.e.m. of separate counts of 6-10 colonies (the number above the parentheses on each bar). Scale bars: 50 µm.
Fig. 8.
Fig. 8.
Developmental capacities of mouse embryonic DRG cells in explant cultures containing LIF/BMP2/FGF2. (A) E12 mouse DRG explants were cultured in medium containing LIF/BMP2/FGF2 during the first 6 days and subsequently exposed to differentiation-promoting factors for 4 or 6 days. Immunostaining was performed using anti-NF68, anti-GFAP, anti-SMA, anti-Collagen type II, anti-Sox17, or anti-Foxa2 on culture day 10 or 12. (B) Bright-field image. (C) Anti-NF68-positive cells in the same field as B. (D) DAPI nuclear staining of the same field as B. (E) Merged image of C and D. (F) Bright-field image. (G) Anti-GFAP-positive cells in the same field as F. (H) DAPI nuclear staining of the same field as F. (I) Merged image of G and H. (J) Bright-field image. (K) Anti-SMA-positive cells in the same field as J. (L) DAPI nuclear staining of the same field as J. (M) Merged image of K and L. (N) Bright-field image. (O) Anti-Collagen type II-positive cells in the same field as N. (P) DAPI nuclear staining of the same field as N. (Q) Merged image of O and P. (R) Bright-field image. (S) Anti-Sox17-positive cells in the same field as R. (T) DAPI nuclear staining of the same field as R. (U) Merged image of S and T. (V) Bright-field image. (W) Anti-Foxa2-positive cells in the same field as V. (X) DAPI nuclear staining of the same field as V. (Y) Merged image of W and X. Scale bars: 50 µm.
Fig. 9.
Fig. 9.
Developmental capacities of single cells derived from E12 mouse DRG explants treated with LIF/BMP2/FGF2. The DRG explants were cultured in the medium containing LIF/BMP2/FGF2 for 2 days and clonal culture analysis was subsequently performed in the presence of differentiation promoting factors for 5 days. Immunostaining using anti-SMA and anti-NF68, anti-SMA and anti-Foxa2, or anti-SMA and anti-GFAP was carried out on culture day 7. (A) Anti-SMA-positive cells. (B) Anti-NF68-positive cells in the same field as A. B′ shows enlarged images of boxed region in B. (C) DAPI nuclear staining of the same field as A. (D) Merged image of A-C. (E) Anti-SMA-positive cells. (F) Anti-Foxa2-positive cells in the same field as E. (G) DAPI nuclear staining of the same field as E. (H) Merged image of E-G. (I) Anti-GFAP-positive cells. (J) Anti-Foxa2-positive cells in the same field as I. (K) DAPI nuclear staining of the same field as I. (L) Merged image of I-K. Blue arrowheads indicate anti-SMA-positive cells (A,C,D,E,G, and H) or anti-GFAP-positive cells (I,K, and L). Orange arrowheads indicate anti-NF68-positive cells (B-D) or anti-Foxa2-positive cells (F-H). White arrows of I-L indicate cells expressing both GFAP and Foxa2. Scale bars: 50 µm.
Fig. 10.
Fig. 10.
In vivo developmental capacities of mouse embryonic DRG cells treated with LIF/BMP2/FGF2. (A) Teratomas were harvested at 2-3 months after injection of dissociated cells that had been derived from E12 mouse DRG explants cultured for 6 days in medium containing LIF/BMP2/FGF2. (B) Glia (Gl) and neuron (Ne). (C) Hair (Hr). (D) Cartilage. (E) Adipocytes. (F) Connective tissue. (G) Alveolar epithelium-like structure. (H) Bright-field image. (I) Anti-Sox17-positive cells in the same field as H. (J) DAPI nuclear staining of the same field as H. (K) Merged image of I and J. White arrowheads in I-K indicate typical cells containing Sox17. (L) Bright-field image. (M) Anti-Foxa2-positive cells in the same field as L. (N) DAPI nuclear staining of the same field as L. (O) Merged image of M and N. White arrowheads in M-O indicate typical cells containing Foxa2. Scale bars: 200 µm in A; 20 µm in B-H and L.
Fig. 11.
Fig. 11.
Effects of LIF/BMP2/FGF2 on proliferation of mouse embryonic DRG cells. E12 mouse DRG explants were cultured in medium containing LIF/BMP2/FGF2 for 6 days. Immunostaining was performed using anti-PCNA, anti-Oct4, and anti-Caspase-3 on culture day 6. (A) Bright-field image of a culture treated with LIF/BMP2/FGF2. (B) Anti-PCNA-positive cells in the same field as A. (C) Anti-Oct4-positive cells in the same field as A. (D) DAPI nuclear staining of the same field as A. (E) Merged image of B-D. (F) Bright-field image of the untreated culture. (G) Anti-Cacpase-3-positive cells in the same field as F. (H) Anti-Oct4-positive cells in the same field as F. (I) DAPI nuclear staining of the same field as F. (J) Merged image of G-I. (K) Percentage of cells expressing PCNA per DRG cell colony. (L) Percentage of cells coexpressing PCNA and Oct4 per total cells expressing PCNA in a DRG cell colony. (M) Percentage of cells expressing Caspase-3 per DRG cell colony. *P<0.05 (Student's t-test) compared to untreated cultures. Data are expressed as mean±s.e.m. of separate counts of 6-10 colonies (the number in parentheses above each bar). (N) Time course of average diameter of spheres in suspension cultures of dissociated cells derived from E12 mouse DRGs. Data are expressed as mean±s.e.m. of separate measurements of four spheres. †P<0.05 (Student's t-test) compared to untreated suspension cultures. (O) Bright-field image of a sphere cultured in the medium containing LIF/BMP2/FGF2 for 6 days. (P) Bright-field image of a sphere in the untreated culture at 6 days. Scale bars: 50 µm.
Fig. 12.
Fig. 12.
PGCLC formation by mouse embryonic DRG cells. E12 mouse DRG explants were cultured for 2 or 8 days. Immunostaining was performed using anti-Blimp1 and anti-Oct4 on culture day 2 or 8. (A) Bright-field image of a culture treated with LIF/BMP2/FGF2 during the first 6 days and subsequently exposed to 10% Nu-serum and LIF/BMP4 for 2 days. (B) Anti-Blimp1-positive cells in the same field as A. (C) Anti-Oct4-positive cells in the same field as A. (D) DAPI nuclear staining of the same field as A. (E) Merged image of B-D. White arrowheads in B-E indicate cells expressing both Blimp1 and Oct4. Scale bar: 50 µm. (F) Culture schedules of E12 mouse DRG explants for inducing the formation of PGCLCs. (G) Percentage of cells expressing both Blimp1 and Oct4 per DRG cell colony. *P<0.05 (Student's t-test) compared to the cultures treated with LIF/ BMP4 for 2 days. Data are expressed as mean±s.e.m. of separate counts of 6-11 colonies (the number in parentheses above each bar).
Fig. 13.
Fig. 13.
Coexpression of Oct4 and CHD7 in mouse embryonic DRGs. (A-E) Transverse sections of E12 mouse DRGs. The top, bottom, left, and right of each photograph correspond to the dorsal, ventral, proximal, and distal side of embryo, respectively. (A) Bright-field image. (B) Expression pattern of Oct4 in the same field as A. (C) Expression pattern of CHD7 in the same field as A. (D) DAPI nuclear staining of the same field as A. (E) Merged image of B-D. A′-E′ show enlarged images of boxed regions in A-E. White arrowheads in B′-E′ indicate cells expressing both Oct4 and CHD7. (F-L) In vitro coexpression of Oct4 and CHD7 in E12 mouse DRG explants on culture day 2, 4, 6, and 9. (F) Bright-field image of a culture treated with LIF/BMP2/FGF2 for 6 days. (G) Anti-Oct4-positive cells in the same field as F. (H) Anti-CHD7-positive cells in the same field as F. (I) DAPI nuclear staining of the same field as F. (J) Merged image of G-I. (K) Percentage of cells expressing both Oct4 and CHD7 per DRG cell colony. (L) Percentage of cells coexpressing Oct4 and CHD7 per total cells expressing CHD7 in a DRG cell colony. *P<0.05 (Student's t-test) compared to the cultures at 2 days under the respective conditions. Data are expressed as mean±s.e.m. of separate counts of 5-12 colonies (the number in parentheses above each bar). Scale bars: 20 µm in A and A′; 50 µm in F.
Fig. 14.
Fig. 14.
Effects of WT CHD7 or DN CHD7 expression vectors and of CHD7, Oct4, Sox2, or Nanog siRNAs on CHD7, Sox10, or Oct4 expression. (A) E12 mouse DRG explants were exposed to LIF/BMP2/FGF2 for 6 days. Each expression vector or siRNA was applied from day 0 to day 2 in culture. (B) Percentage of cells expressing CHD7 per DRG cell colony. (C) Percentage of cells expressing Sox10 per DRG cell colony. (D) Percentage of cells expressing both CHD7 and Sox10 per DRG cell colony. (E) Percentage of cells expressing CHD7 per DRG cell colony. (F) Percentage of cells expressing Oct4 per DRG cell colony. (G) Percentage of cells expressing both CHD7 and Oct4 per DRG cell colony. *P<0.05 (Student's t-test) compared to untreated cultures. †P<0.05 (Student's t-test) compared to LIF/BMP2/FGF2-treated cultures. Data are expressed as mean±s.e.m. of separate counts of 5-15 colonies (the number in parentheses above each bar).

Similar articles

Cited by

References

    1. Achilleos A. and Trainor P. A. (2012). Neural crest stem cells: discovery, properties and potential for therapy. Cell Res. 22, 288-304. 10.1038/cr.2012.11 - DOI - PMC - PubMed
    1. Atari M., Barajas M., Hernández-Alfaro F., Gil C., Fabregat M., Ferrés Padró E., Giner L. and Casals N. (2011). Isolation of pluripotent stem cells from human third molar dental pulp. Histol. Histopathol. 26, 1057 10.14670/HH-26.1057 - DOI - PubMed
    1. Avilion A. A., Nicolis S. K., Pevny L. H., Perez L., Vivian N. and Lovell-Badge R. (2003). Multipotent cell lineages in early mouse development depend on SOX2 function. Genes Dev. 17, 126-140. 10.1101/gad.224503 - DOI - PMC - PubMed
    1. Bajpai R., Chen D. A., Rada-Iglesias A., Zhang J., Xiong Y., Helms J., Chang C.-P., Zhao Y., Swigut T. and Wysocka J. (2010). CHD7 cooperates with PBAF to control multipotent neural crest formation. Nature 463, 958-962. 10.1038/nature08733 - DOI - PMC - PubMed
    1. Bengtsson H., Söderström S., Kylberg A., Charette M. F. and Ebendal T. (1998). Potentiating interactions between morphogenetic protein and neurotrophic factors in developing neurons. J. Neurosci. Res. 53, 559-568. 10.1002/(SICI)1097-4547(19980901)53:5<559::AID-JNR6%3.0.CO;2-8 - DOI - PubMed