

A new sub-pathway of long-patch base excision repair involving 5' gap formation
- PMID: 28373211
- PMCID: PMC5452013
- DOI: 10.15252/embj.201694920
A new sub-pathway of long-patch base excision repair involving 5' gap formation
Abstract
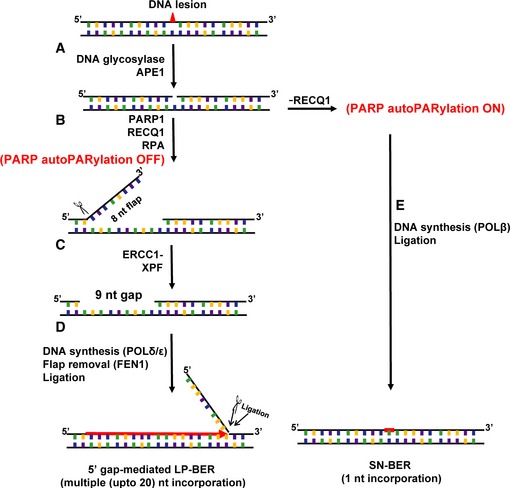
Base excision repair (BER) is one of the most frequently used cellular DNA repair mechanisms and modulates many human pathophysiological conditions related to DNA damage. Through live cell and in vitro reconstitution experiments, we have discovered a major sub-pathway of conventional long-patch BER that involves formation of a 9-nucleotide gap 5' to the lesion. This new sub-pathway is mediated by RECQ1 DNA helicase and ERCC1-XPF endonuclease in cooperation with PARP1 poly(ADP-ribose) polymerase and RPA The novel gap formation step is employed during repair of a variety of DNA lesions, including oxidative and alkylation damage. Moreover, RECQ1 regulates PARP1 auto-(ADP-ribosyl)ation and the choice between long-patch and single-nucleotide BER, thereby modulating cellular sensitivity to DNA damage. Based on these results, we propose a revised model of long-patch BER and a new key regulation point for pathway choice in BER.
Keywords: BER pathway switch; PARP inhibition; RECQ1; XPF‐ERCC1; oxidative damage.
© 2017 The Authors.
Figures
- A
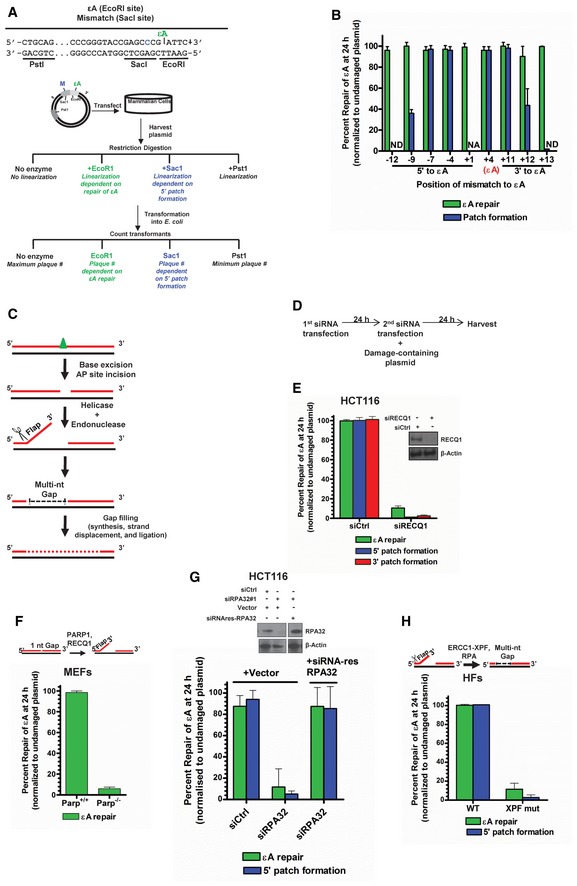
Experimental strategy of the plaque‐based assay for detecting patch formation during BER. Plasmid #4 (see Appendix Table S1) is used as a representative example. Sequence of relevant restriction sites is shown in which green “εA” indicates the position of εA (at EcoRI site), which inhibits EcoRI digestion, and the blue “C” indicates the position of the C:A mismatch (at SacI site), which inhibits SacI digestion. The PstI site is used as a control and is unmodified. The schematic of the plasmid shows the green εA within the EcoRI site and a blue “M” indicating the mismatch within the SacI site. After transfection of the plasmid into cells, the plasmid is harvested for digestion with indicated enzymes and transformation into E. coli. Repair at the modified restriction sites will yield linearized plasmid and no transformants (plaques) while unrepaired restriction sites will be resistant to digestion and will produce transformants.
- B
εA repair patch mapping. Plasmids used are listed in Appendix Table S1. NA indicates “not applicable”, and ND indicates “repair and/or 5′ patch formation not detectable”.
- C
Schematic representation of BER 5′ patch formation hypothesis.
- D
Experimental timeline for plaque‐based repair assay in the presence of gene‐specific siRNA.
- E
εA repair, 5′ patch formation, and 3′ patch formation were monitored by plaque assay in control and RECQ1 KD HCT116 cells using plasmids #4 (to monitor 5′ patch formation) and #2 (to monitor 3′ patch formation). Inset shows Western blot analysis of control and RECQ1 KD. Inset shows Western blot analysis of control and RECQ1 KD cells.
- F–H
εA repair was monitored by plaque assay using plasmid #4 in (F) Parp +/+ and Parp −/− MEFs, (G) control and RPA KD HCT116 cells complemented with empty vector or siRNA‐resistant RPA32 (siRNA res‐RPA32), and (H) wild‐type (WT) and XPF mutant (XPF mut) HFs. Schematics above (F) and (H) depict the proposed action of indicated proteins in BER. Inset in (G) shows Western blot analysis of control and RPA KD cells complemented with empty vector or siRNA res‐RPA32. Space between samples indicates where samples were separated by gel lanes.
- A–D
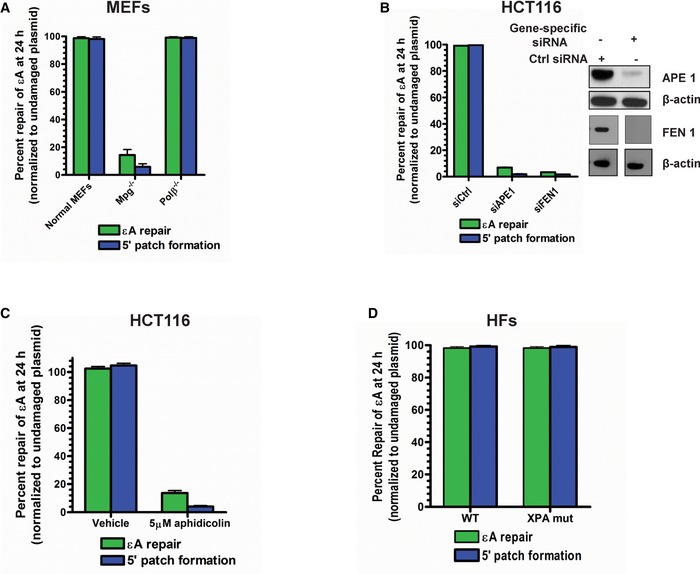
εA repair and 5′ patch formation in plasmid #4 (Appendix Table S1) were monitored 24 h post‐plasmid transfection under various conditions: (A) wild‐type, Mpg −/−, and Polb −/− MEFs, (B) control, APE1 KD, and FEN1 KD HCT116 cells, (C) under vehicle or aphidicolin treatment in HCT116 cells, and (D) wild‐type and XPA mutant HFs. For KD experiments, control or gene‐specific (APE1 or FEN1) siRNAs were transfected into HCT116 cells and repair was analyzed in the same manner as described in Fig 1D. APE1 and FEN1 expression was analyzed by Western blot, which is shown in the inset in (B). Space between samples indicates where samples were separated by gel lanes.
- A
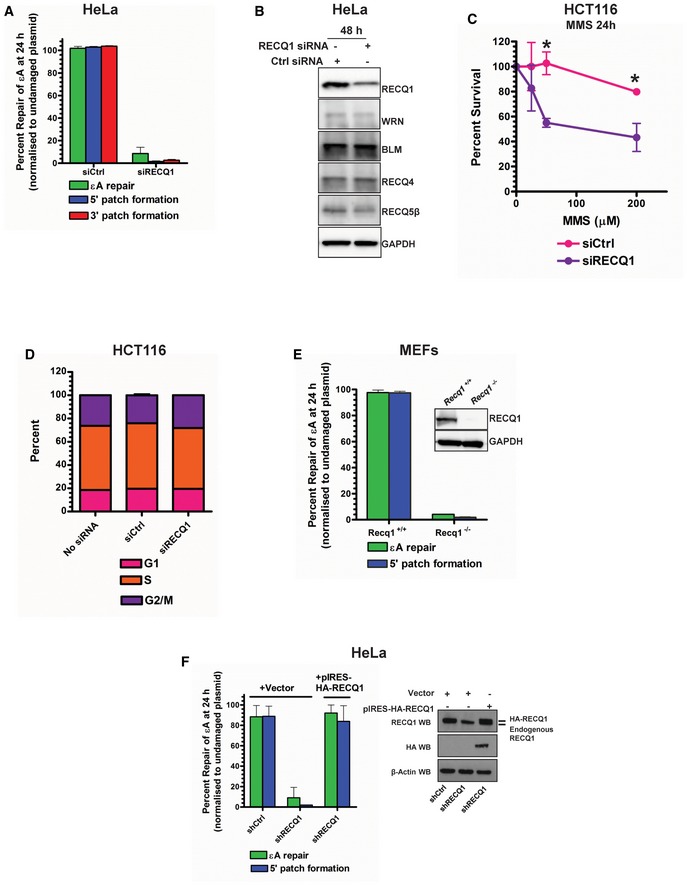
εA repair, 5′ patch formation, and 3′ patch formation were monitored by plaque assay 24 h post‐plasmid transfection (plasmids #2 and #4 for monitoring the 3′ and 5′ patch formation, respectively) in control and RECQ1 KD HeLa cells in the same manner as described in Fig 1D.
- B
Western blot analysis of RECQ family helicases in HeLa cells 48 h post‐RECQ1 siRNA transfection.
- C
Survival of control and RECQ1 KD HCT116 cells treated for 24 h with indicated doses of MMS was measured by cell counting. Asterisk (*) denotes P‐value of Student's t‐test < 0.05.
- D
Cell cycle distribution was monitored in control and RECQ1 KD HCT116 cells 24 h post‐siRNA transfection by DNA content analysis (propidium iodide staining) using flow cytometry.
- E, F
εA repair and 5′ patch formation were monitored 24 h post‐plasmid transfection (plasmid #4) by plaque assay in (E) Recq1 +/+ and Recq1 −/− MEFs and (F) stable control and RECQ1 KD cells complemented with empty vector or shRNA‐resistant RECQ1. Insets show Western blot for RECQ1 in MEFs (E) and RECQ1 stable KD HeLa cells (F).
- A–D
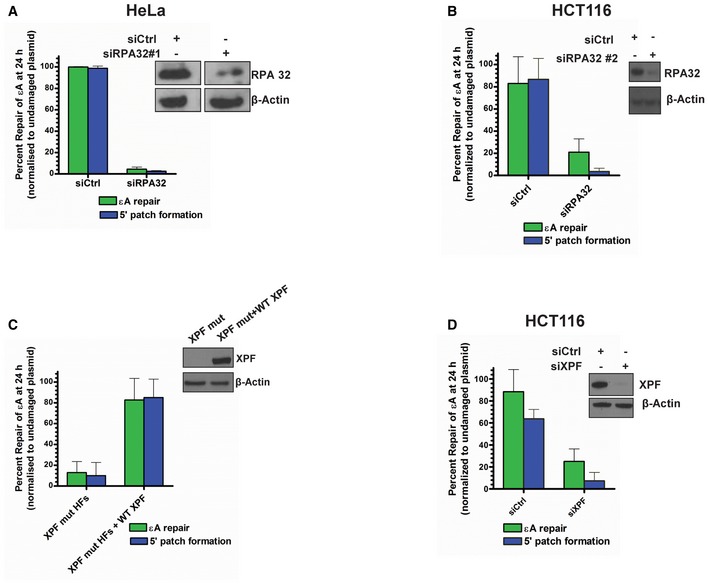
εA repair and 5′ patch formation were monitored by plaque assay 24 h post‐plasmid transfection (plasmid #4) in the same manner as described in Fig 1D in (A) control and RPA KD HeLa cells (using RPA siRNA #1), (B) control and RPA KD HCT116 cells (using RPA siRNA #2), (C) parental XPF mutant HFs and XPF mutant HFs lentivirally transduced with WT XPF, and (D) control and XPF KD HCT116 cells. Insets in panels show Western blots for RPA and XPF, as indicated. Space between samples indicates where samples were separated by gel lanes, which is shown in the inset in (A).
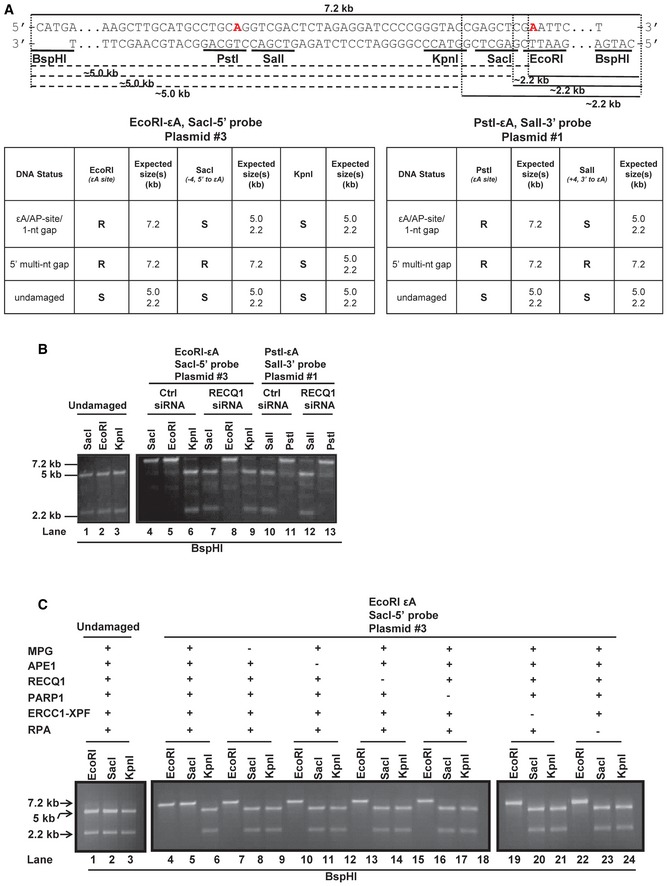
The MCS region of M13mp18 is shown with the EcoRI (εA), SacI (−4, 5′ to εA), KpnI (−12, 5′ to εA), and BspHI restriction sites noted. The red “A” within the EcoRI site indicates the adenine that is modified to εA for assays utilizing plasmid #3 (see Appendix Table S1). The red “A” within the PstI site indicates the adenine that is modified to εA for assays utilizing plasmid #1 (see Appendix Table S1). After incubation with HCT116 nuclear extracts, aliquots of the reaction products were double digested with EcoRI/BspHI, SacI/BspHI, or KpnI/BspH1. The dotted lines indicate digestion of each enzyme (+ BspHI) and the resulting product sizes, 5 kb and 2.2 kb. Tables indicate the expected digestion results of the assay according to the DNA structure of reaction products. R = resistant, S = sensitive. The details of the plasmids used are found in Appendix Table S1.
Lanes 1–3, undamaged M13mp18 DNA was incubated with aphidicolin‐treated HCT116 nuclear extracts for 1 h at 37°C. Samples were subsequently aliquoted and digested with EcoRI, SacI, and KpnI in combination with BspHI, and reaction products were resolved on a 1% agarose gel. Lanes 4‐13, M13mp18‐εA DNA was incubated with aphidicolin‐treated control and RECQ1 KD HCT116 nuclear extracts for 1 h at 37°C. Samples were subsequently aliquoted and digested with EcoRI, SacI, and KpnI (lanes 4–9) or PstI and SalI (lanes 10–13) in combination with BspHI, and reaction products were resolved on a 1% agarose gel.
Undamaged (lanes 1–3) and M13mp18‐εA (lanes 4–24) DNA were incubated with purified proteins MPG, APE1, RECQ1, PARP1, ERCC1‐XPF, and RPA and processed as described in (B). Spaces between lanes indicate where samples were separated by lanes or where two gels were required to accommodate the number of samples.
- A
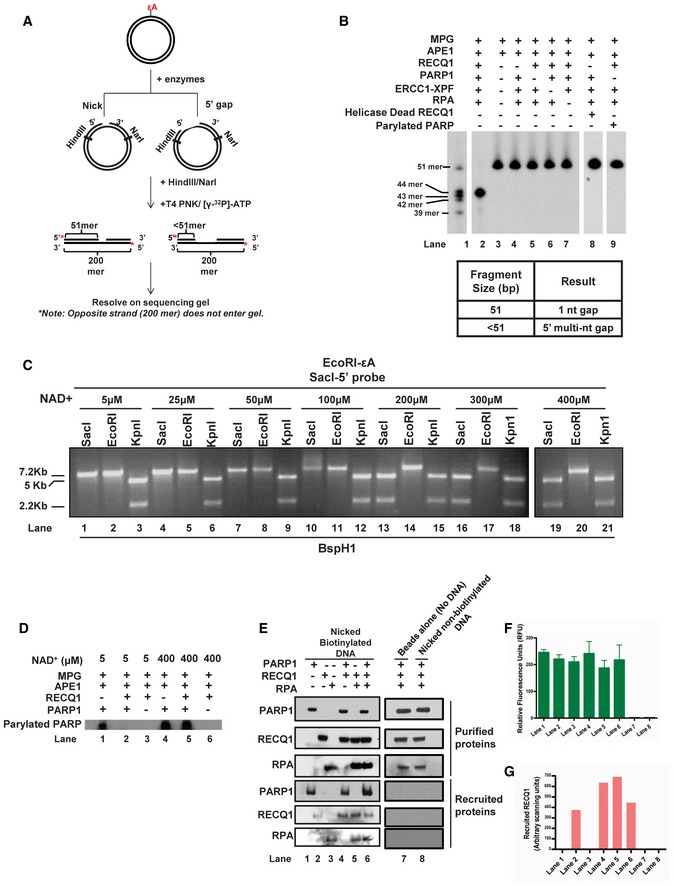
Schematic depiction of gap mapping assay. M13mp18‐εA plasmid DNA (plasmid #3) was treated with the indicated purified proteins for 1 h at 37°C. Samples were subsequently digested with HindIII and NarI, and the 5′ termini were radiolabeled by polynucleotide kinase‐mediated exchange reaction with [γ‐32P]‐ATP (red stars). The radiolabeled reaction products were resolved on a 10% denaturing polyacrylamide gel.
- B
Results of gap mapping assay. Table lists the expected results interpreted by labeled fragment sizes.
- C
Increasing concentrations of NAD+ were incubated for 1 h at 37°C with M13mp18‐εA plasmid DNA (plasmid #3) and indicated proteins and processed as described in Fig 2C.
- D
PARP PARylation with [γ‐32P]‐NAD+. M13mp18‐εA DNA was incubated with the indicated proteins and [γ‐32P]‐NAD+ for 1 h at 37°C. Reactions were subsequently analyzed by SDS–PAGE followed by autoradiography.
- E–G
Biotinylated or non‐biotinylated M13mp18 plasmid DNA (plasmid #3) with an incised AP site were incubated with the indicated proteins at room temperature for 20 min. DNA was collected using streptavidin‐coated magnetic beads and a magnetic separator. Samples collected on the magnet were immunoblotted for respective proteins and (F) tested for DNA content by the PicoGreen dsDNA assay. Graph depicts the RFU for corresponding samples from (E). Spaces between lanes indicate two separate gels. (G) Graph depicts the quantitation of RECQ1 band from RECQ1 immunoblot in (E). In (F & G) data are presented as mean ± SD from three independent experiments.
- A
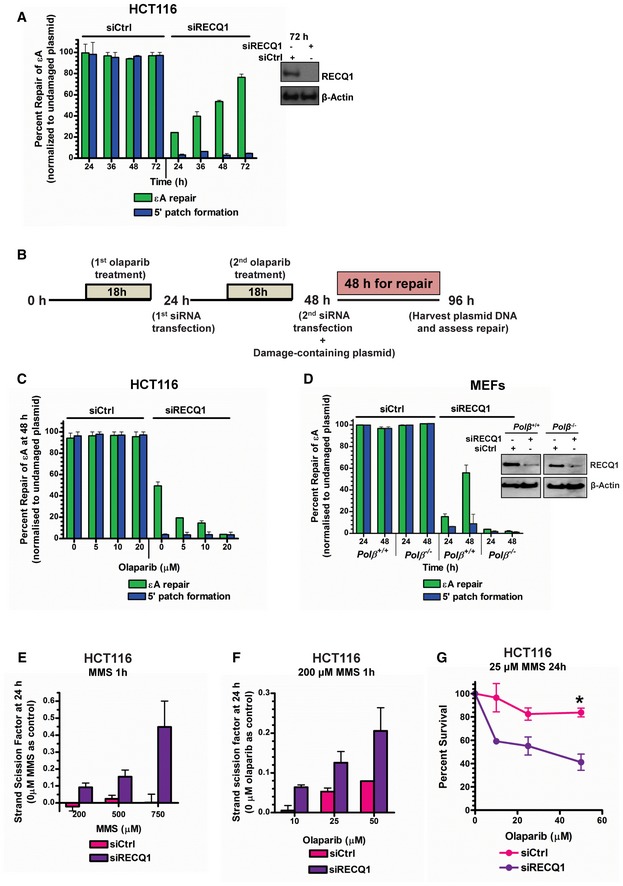
εA repair and 5′ patch formation were monitored by plaque assay post‐plasmid transfection (plasmid #4) in control and RECQ1 KD HCT116 cells at 24–72 h. Inset shows Western blot analysis of RECQ1 KD in HCT116 cells.
- B
Experimental timeline for plaque‐based repair assay in the presence of olaparib and RECQ1 siRNA.
- C, D
εA repair and 5′ patch formation were monitored by plaque assay post‐plasmid transfection (plasmid #4) in (C) olaparib‐treated control and RECQ1 KD HCT116 cells at 48 h, and (D) control and RECQ1 KD Polb +/+ and Polb −/− MEFs at 24–48 h. Inset in (D) shows Western blot analysis of RECQ1 KD in MEFs.
- E
SSBs were quantified in control and RECQ1 KD HCT116 cells 24 h after treatment for 1 h with indicated doses of MMS.
- F
SSBs were quantified in control and RECQ1 KD HCT116 cells 24 h after treatment for 1 h with 200 μM MMS (sub‐lethal 1‐h treatment) in the presence of indicated doses of olaparib.
- G
Survival of control and RECQ1 KD HCT116 treated for 24 h with 25 μM MMS (sub‐lethal 24‐h treatment) and indicated doses of olaparib was measured by cell counting. Asterisk (*) denotes P‐value of Student's t‐test < 0.05. Insets in (A) and (D) show Western blot analysis of RECQ1 KD in HCT116 cells and MEFs, respectively.
- A, B
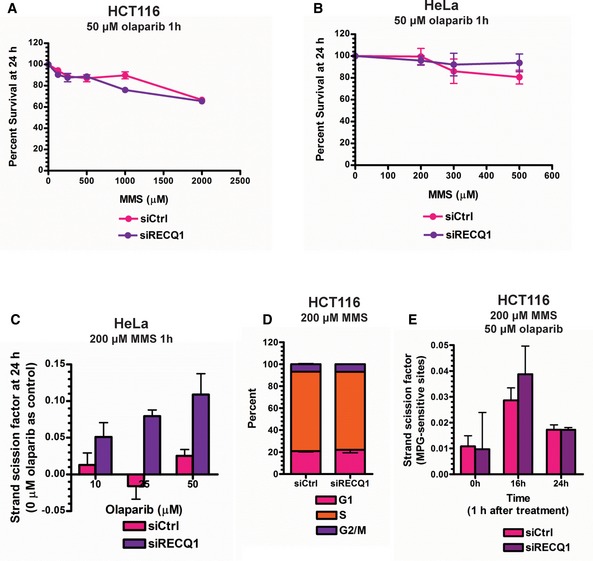
MTT assays were performed in control and RECQ1 KD (A) HCT116 cells and (B) HeLa cells 24 h after treatment with increasing doses of MMS for 1 h in combination with 50 μM olaparib.
- C
SSBs were quantified in control and RECQ1 KD HeLa cells 24 h after treatment for 1 h with 200 μM MMS (sub‐lethal 1‐h treatment) in the presence of indicated doses of olaparib.
- D
Cell cycle distribution measured by DNA content analysis (propidium iodide staining) using flow cytometry was monitored in control and RECQ1 KD HCT116 cells 24 h after treatment with 200 μM MMS in combination with 50 μM of olaparib for 1 h.
- E
MPG‐sensitive sites were quantified in genomic DNA isolated from control and RECQ1 KD HCT116 cells 0, 16, and 24 h after 1‐h treatment with 200 μM MMS in combination with 50 μM of olaparib.
- A, B
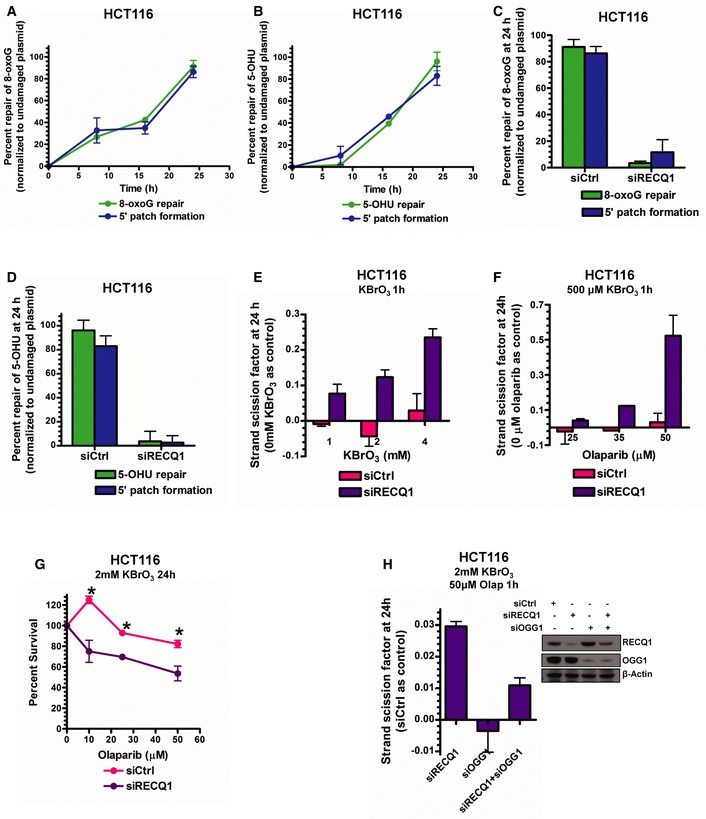
8‐oxoG repair and 5′ patch formation (A) and 5‐OHU repair and 5′ patch formation (B) were monitored by real‐time PCR‐based repair assay in HCT116 cells for 24 h post‐plasmid transfection (plasmids #13 and 14, respectively).
- C, D
8‐oxoG repair and 5′ patch formation (C) and 5‐OHU repair and 5′ patch formation (D) were monitored by real‐time PCR‐based repair assay in control and RECQ1 KD HCT116 cells 24 h post‐plasmid transfection in the same manner as described in Fig 1D.
- E
SSBs were quantified in control and RECQ1 KD HCT116 cells 24 h after treatment for 1 h with indicated doses of KBrO3.
- F
SSBs were quantified in control and RECQ1 KD HCT116 cells 24 h after treatment for 1 h with 500 μM KBrO3 (sub‐lethal 1‐h treatment) in the presence of indicated doses of olaparib.
- G
Survival of control and RECQ1 KD HCT116 treated for 24 h with 2 mM KBrO3 (sub‐lethal 24‐h treatment) and increasing doses of olaparib was measured by cell counting. Asterisk (*) denotes P‐value of Student's t‐test < 0.05.
- H
SSBs were quantified in control, RECQ1 KD, OGG1 KD, and RECQ1/OGG1 double KD HCT116 cells 24 h after treatment for 1 h with 2 mM KBrO3 (sub‐lethal 1‐h treatment) in the presence of 50 μM olaparib. Inset shows Western blot analysis of RECQ1 KD and OGG1 KD in HCT116 cells.
- A, B
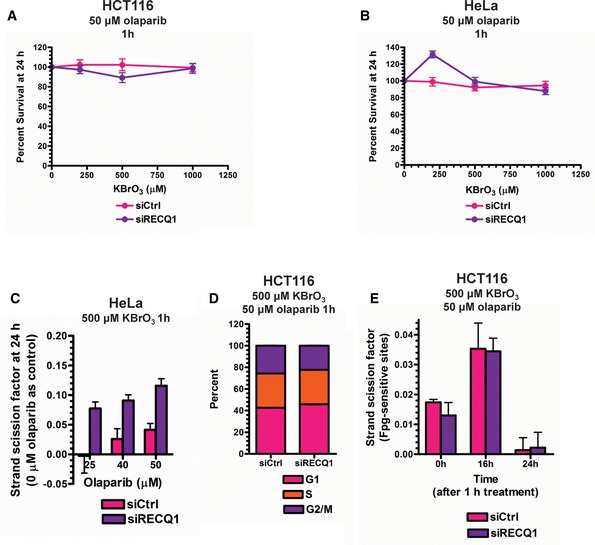
MTT assays were performed in control and RECQ1 KD (A) HCT116 cells and (B) HeLa cells 24 h after treatment with increasing doses of KBrO3 for 1 h in combination with 50 μM olaparib.
- C
SSBs were quantified in control and RECQ1 KD HeLa cells 24 h after treatment for 1 h with 500 μM KBrO3 (sub‐lethal 1‐h treatment) in the presence of indicated doses of olaparib.
- D
Cell cycle distribution measured by DNA content analysis (propidium iodide staining) using flow cytometry was monitored in control and RECQ1 KD HCT116 cells 24 h after treatment with 500 μM KBrO3 in combination with 50 μM olaparib for 1 h.
- E
E. coli Fpg‐sensitive sites were quantified in genomic DNA isolated from control and RECQ1 KD HCT116 cells 0, 16, and 24 h after 1‐h treatment with 500 μM KBrO3 in combination with 50 μM olaparib.
References
-
- Agnihotri S, Burrell K, Buczkowicz P, Remke M, Golbourn B, Chornenkyy Y, Gajadhar A, Fernandez NA, Clarke ID, Barszczyk MS, Pajovic S, Ternamian C, Head R, Sabha N, Sobol RW, Taylor MD, Rutka JT, Jones C, Dirks PB, Zadeh G et al (2014) ATM regulates 3‐methylpurine‐DNA glycosylase and promotes therapeutic resistance to alkylating agents. Cancer Discov 4: 1198–1213 - PMC - PubMed
-
- Akbari M, Pena‐Diaz J, Andersen S, Liabakk NB, Otterlei M, Krokan HE (2009) Extracts of proliferating and non‐proliferating human cells display different base excision pathways and repair fidelity. DNA Repair 8: 834–843 - PubMed
-
- Allinson SL, Dianova II, Dianov GL (2003) Poly(ADP‐ribose) polymerase in base excision repair: always engaged, but not essential for DNA damage processing. Acta Biochim Pol 50: 169–179 - PubMed
-
- Ballmaier D, Epe B (1995) Oxidative DNA damage induced by potassium bromate under cell‐free conditions and in mammalian cells. Carcinogenesis 16: 335–342 - PubMed
Publication types
MeSH terms
Substances
Grants and funding
LinkOut - more resources
Full Text Sources
Other Literature Sources
Miscellaneous
