. 2017 May 26;292(21):8874-8891.
doi: 10.1074/jbc.M116.765313. Epub 2017 Apr 3.

An immunoaffinity-based method for isolating ultrapure adult astrocytes based on ATP1B2 targeting by the ACSA-2 antibody

Affiliations

An immunoaffinity-based method for isolating ultrapure adult astrocytes based on ATP1B2 targeting by the ACSA-2 antibody

Mykhailo Y Batiuk et al. J Biol Chem. .

Abstract

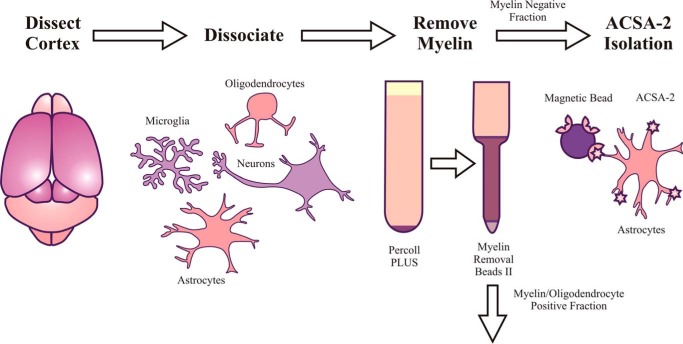
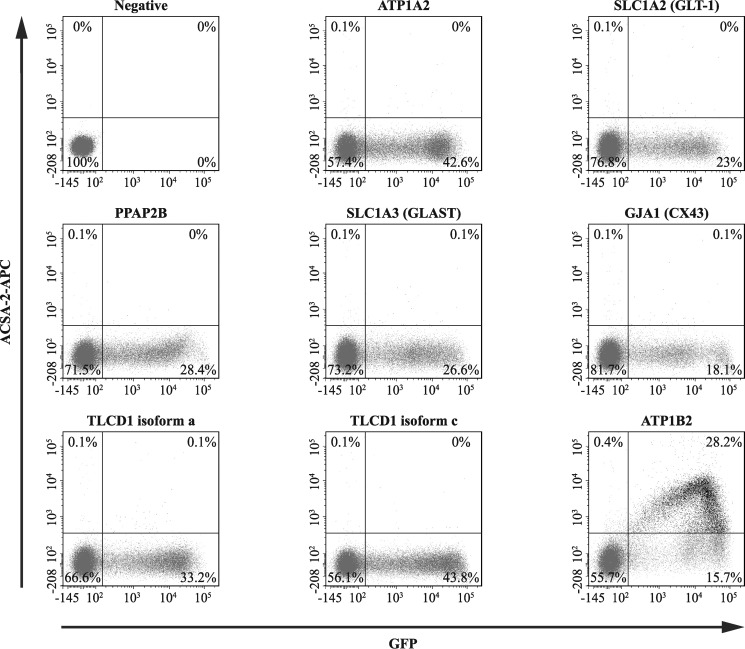
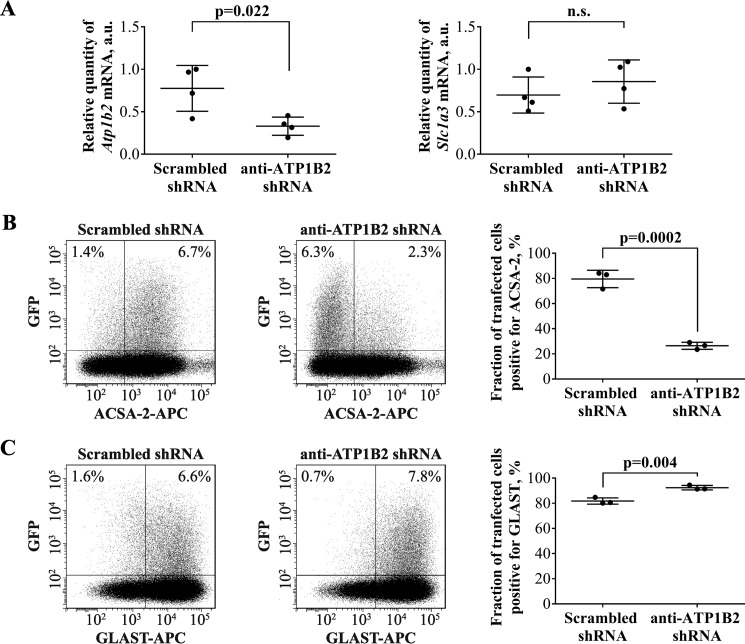
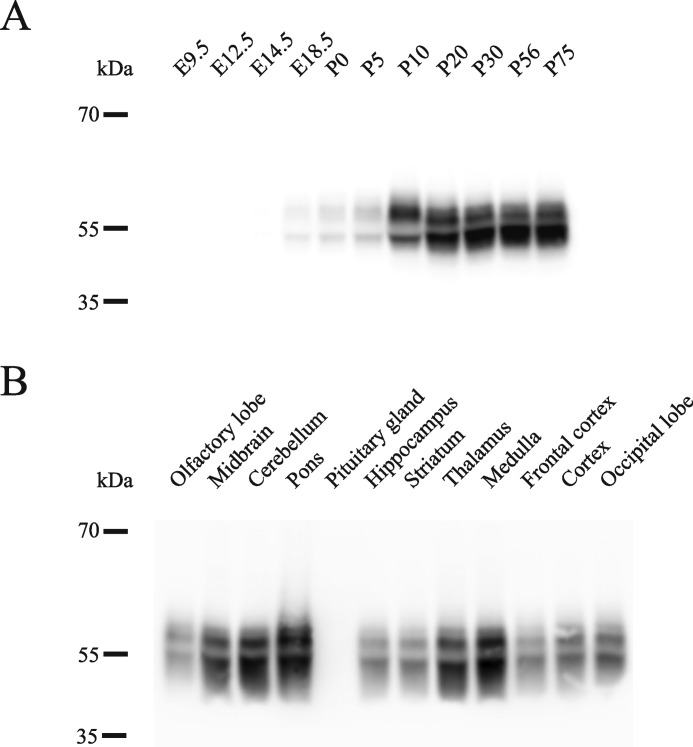
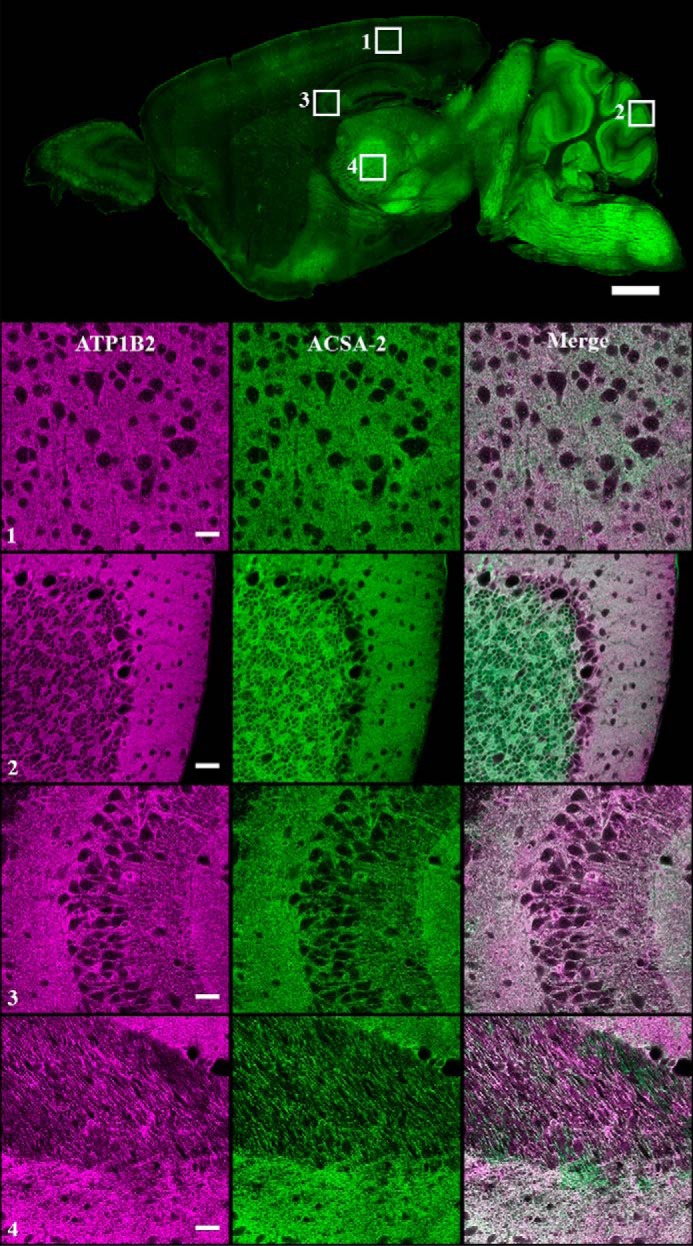
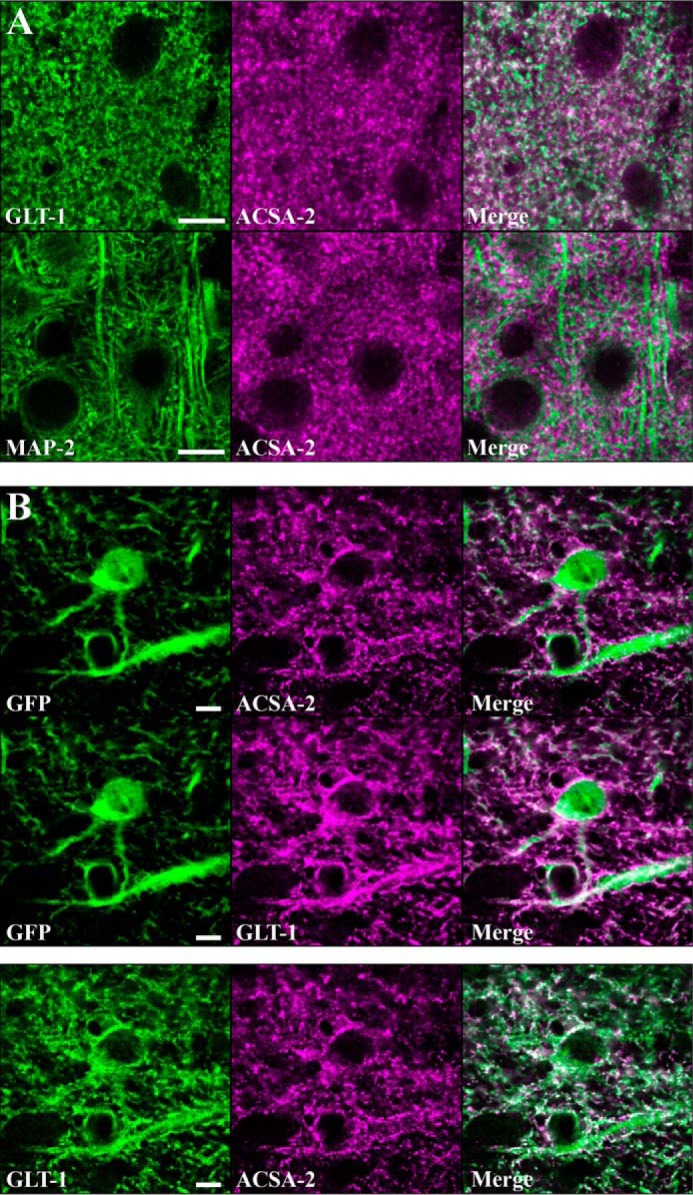
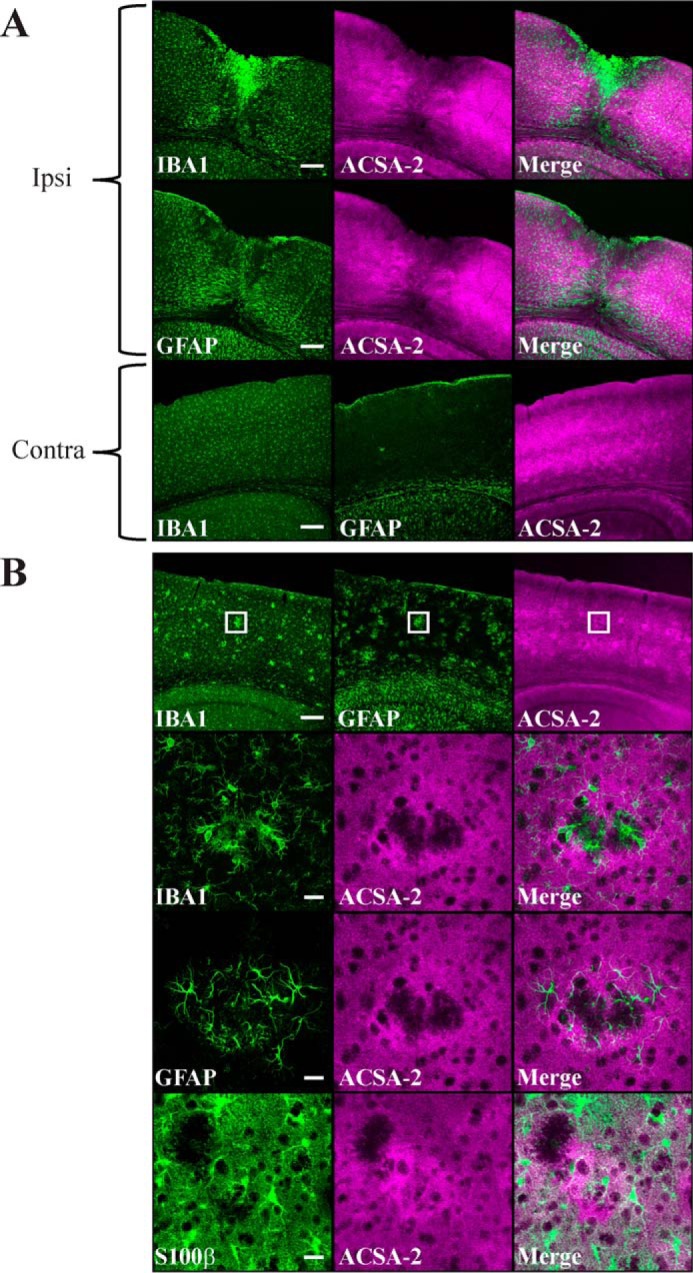
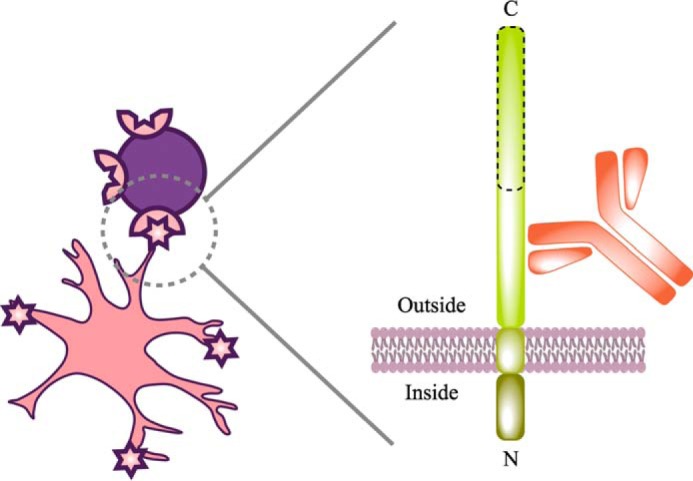
Astrocytes are a major cell type in the mammalian CNS. Astrocytes are now known to play a number of essential roles in processes including synapse formation and function, as well as blood-brain barrier formation and control of cerebral blood flow. However, our understanding of the molecular mechanisms underlying astrocyte development and function is still rudimentary. This lack of knowledge is at least partly due to the lack of tools currently available for astrocyte biology. ACSA-2 is a commercially available antibody originally developed for the isolation of astrocytes from young postnatal mouse brain, using magnetic cell-sorting methods, but its utility in isolating cells from adult tissue has not yet been published. Using a modified protocol, we now show that this tool can also be used to isolate ultrapure astrocytes from the adult brain. Furthermore, using a variety of techniques (including single-cell sequencing, overexpression and knockdown assays, immunoblotting, and immunohistochemistry), we identify the ACSA-2 epitope for the first time as ATP1B2 and characterize its distribution in the CNS. Finally, we show that ATP1B2 is stably expressed in multiple models of CNS injury and disease. Hence, we show that the ACSA-2 antibody possesses the potential to be an extremely valuable tool for astrocyte research, allowing the purification and characterization of astrocytes (potentially including injury and disease models) without the need for any specialized and expensive equipment. In fact, our results suggest that ACSA-2 should be a first-choice method for astrocyte isolation and characterization.

Keywords: astrocyte; cell surface protein; flow cytometry; immunoblotting; immunohistochemistry; immunoisolation; membrane protein; neuroscience; plasma membrane; single-cell RNA-seq.


Conflict of interest statement

The authors declare that they have no conflicts of interest with the contents of this article

Figures

Figure 1.
Figure 1.
Schematic of astrocyte isolation from mouse cortex using ACSA-2. To account for the high level of myelination present in the adult CNS, the standard manufacturer's protocol was modified to include an additional myelin removal step (using Percoll PLUS and Myelin Removal Beads II, Miltenyi Biotec) immediately following tissue dissociation but before astrocyte isolation.
Figure 2.
Figure 2.
Quantitative RT-PCR analysis of astrocytes isolated from young and adult mouse cortex. RNA was extracted from isolated astrocytes and reverse transcribed into cDNA. (As a positive control for relative quantification, RNA was also extracted from a single-cell suspension of whole cortex.) Quantitative PCR was then performed using a range of primers for cell type-specific markers, including Aldh1l1 (astrocytes), Cx3cr1 (microglia), doublecortin (Dcx) (neuronal precursors), myelin basic protein (Mbp) (oligodendrocytes), chondroitin sulfate proteoglycan (Cspg4) (oligodendrocyte precursors: NG2+ cells), occludin (Ocln) (endothelia), and synaptotagmin I (SytI) (neurons). Tata box-binding protein (Tbp) and cytochrome c1 (Cyc1) were used as housekeeping genes for normalization. (Full details of primer sequences used can be found in Table 1.) We routinely see a 2-fold enrichment of Aldh1l1 signal relative to control and a substantial decrease in contaminating cell types at both of the developmental ages we assayed, indicating that our astrocytes are of exceptional purity. The one exception was chondroitin sulfate proteoglycan (Cspg4), which was detectable at high levels in astrocytes isolated from P56 mice. Graphs show results from three independent cell isolation experiments (with a minimum of two technical replicates performed for each sample). qPCR runs on cells from different isolation experiments were repeated more than 3 times with the same results. The dotted line represents the level of mRNA in the positive control (whole-cortex cell suspension). a.u., arbitrary units. Graphs are plots of average ± S.D. (error bars).
Figure 3.
Figure 3.
Flow cytometry-based analysis of astrocytes isolated from young and adult mouse cortex. Live, non-fixed astrocytes were stained using a range of fluorescently conjugated antibodies for cell type-specific markers, including ACSA-2 and anti-GLAST (astrocytes), anti-CD11B (microglia), anti-O1 and anti-O4 (oligodendrocytes), anti-NG2 (oligodendrocyte precursors: NG2+ cells), anti-CD31 (endothelia), and anti-THY1.2 (neurons). (Full details of antibodies used can be found in Table 2.) We routinely see that > 95% of all cells purified are astrocytes, indicating that the preparation is of exceptional purity (consistent with data from qPCR analysis; Fig. 2). Trace amounts of all other cell types were detected (< 2%) except in the case of NG2+ cells, where levels were higher (∼4%, although this figure could be a slight underestimation due to the sensitivity of the epitope to papain; see “Experimental procedures”). Note that THY1.2 staining was performed on astrocytes isolated from the Aldh1l1-EGFP mouse line (which expresses EGFP specifically in astrocytes), because THY1.2 was previously reported to stain both neurons and astrocytes. Graphs show results from one representative experiment. This experiment was repeated twice on separate days with identical results. In total, two biological replicates were analyzed for each condition, with at least 10,000 cells analyzed per sample (effectively 1 technical replicate per sample). Lines in each plot delineate gates; numbers represent the proportion of cells in each particular gate.
Figure 4.
Figure 4.
The ACSA-2 epitope is expressed on all cortical astrocytes. A suspension of cortical cells from the Aldh1l1-EGFP mouse line (which is a pan-astrocyte marker line) was generated according to the standard protocol used for magnetic isolation of astrocytes. However, although we used adult brains in the experiments, we actually omitted the use of Percoll PLUS density medium, using only HBSS with calcium and magnesium. The cell suspension was initially depleted of myelin using Myelin Removal Beads II before labeling with an ACSA-2-PE antibody for flow-cytometry experiments. All EGFP-positive astrocytes were labeled with ACSA-2 antibody, indicating that the ACSA-2 epitope is present on all cortical astrocytes. Note the small population of cells labeled with ACSA-2 alone, which could be astrocytes not labeled by Aldh1l1-EGFP or other cell types that express ACSA-2 (e.g. oligodendrocytes) that are otherwise removed during our astrocyte purification procedure. This experiment was repeated four times using independent samples (effectively 1 technical replicate per sample) on separate days. At least 20,000 cells were analyzed for each sample.
Figure 5.
Figure 5.
Flow cytometry-based experiments identify ATP1B2 as a target for ACSA-2. HEK293T cells (which do not bind ACSA-2 under normal conditions) were transfected with plasmids encoding for proteins identified by our bioinformatic screen (see Table 3). These plasmids also expressed soluble GFP as a marker for successful plasmid transfection. Cells were then stained with an ACSA-2-APC conjugate and analyzed by flow cytometry. From the list of proteins identified in Table 3, only cells expressing ATP1B2 showed strong co-labeling for ACSA-2 and GFP (28.2% of cells). A representative experiment is presented in the figure. This experiment was repeated twice using independent samples (effectively 1 technical replicate per sample) on separate days with the same results. At least 60,000 cells were analyzed per sample. Lines in each plot delineate gates; numbers represent the proportion of cells in each particular gate.
Figure 6.
Figure 6.
ACSA-2 targets ATP1B2 on the plasma membrane of primary astrocytes. A, primary astrocytes expressing ATP1B2 shRNA for 7 days showed a 57% drop in the level of Atp1b2 mRNA, as judged by qPCR. This result was statistically significant (p = 0.022) when compared with a scrambled control shRNA. The level of an independent marker gene Slc1a3 (which encodes for the plasma membrane transporter GLAST) did not change upon expression of either shRNA. Results are from four sets of samples, prepared independently on four different days. Each sample was run using four technical replicates. a.u., arbitrary units. Graphs are plots of average ± S.D. (error bars). B, primary astrocytes expressing a scrambled control shRNA readily bind ACSA-2, as measured using flow cytometry (left). However, when primary astrocytes were transfected with shRNAs targeting Atp1b2, staining with ACSA-2 was markedly reduced (center). 7 days post-transfection, the average drop in the number of ACSA-2-positive cells for the most effective shRNA construct was 67% when compared with the scrambled control (quantified in the summary plot; right). This difference was statistically significant (p = 0.0002). C, astrocytes transfected with the same shRNAs as used in A (left, scrambled control; center, anti-Atp1b2) readily bind an antibody targeting the astrocyte plasma membrane protein GLAST, indicating the specificity of the shRNA for Atp1b2. Experiments were repeated three times with independent samples (effectively 1 technical replicate per sample) with similar results. Flow-cytometry plots show representative experiments. At least 100,000 cells were analyzed per sample. Graphs are plots of average ± S.D.
Figure 7.
Figure 7.
ATP1B2 is highly expressed in most regions of the CNS from late embryonic stages to adulthood. A, ATP1B2 was detectable from late embryonic stages (E18.5) with levels increasing until P10–P20, after which high levels were maintained into adulthood. B, ATP1B2 was expressed at high levels in all brain regions tested, except for the olfactory lobe and the pituitary gland. Trace amounts of ATP1B2 were present in the olfactory lobe, but levels were below the detection limit in the pituitary. Blots were performed using two independent sets of tissue samples. For each tissue sample, a minimum of three separate blots were run with identical results.
Figure 8.
Figure 8.
Colocalization of ACSA-2 and ATP1B2 signals in mouse brain. ACSA-2 was used to stain sagittal sections of mouse brain. A low-magnification widefield image taken on a slide scanner (top) shows ACSA-2 to be expressed throughout the brain at various levels. To accurately assess the degree of ATP1B2 and ACSA-2 colocalization, a laser-scanning confocal microscope was used to take images at higher magnification in four different brain regions indicated by the numbered white boxes (1, visual cortex; 2, cerebellum; 3, CA3 region of the hippocampus; 4, thalamus). ATP1B2 (magenta) and ACSA-2 (green) show nearly perfect overlap (bottom panels). For all images, acquisition parameters were individually optimized for maximum dynamic range to allow easier visualization of protein localization. Tissue sections from three animals were analyzed with the same results. Scale bars, 1000 μm (low magnification) and 30 μm (high magnification).
Figure 9.
Figure 9.
ATP1B2 is expressed in discrete subcellular domains on the plasma membrane of astrocytes. A, top panels, astrocytes were stained with ACSA-2 and an antibody against an astrocyte-specific membrane protein, GLT-1. Imaging in the visual cortex revealed the staining patterns to be highly similar although non-overlapping. Bottom panels, co-staining of ACSA-2 together with a marker of neuronal microtubules (MAP2) showed highly dissimilar staining. Scale bar, 10 μm. B, top panels, tissue sections from an Aldh1l1-EGFP mouse. Images were taken in the corpus callosum, where the lower cell density allows the clear identification of individual astrocytes based on GFP expression. Both ACSA-2 and GLT-1 signal clearly localize to astrocytes. Note that ACSA-2 signal is detected around astrocyte cell bodies and extending into astrocyte processes. Scale bar, 5 μm. Bottom panels, both GLT-1 and ACSA-2 signal colocalize to the same cell, albeit in non-overlapping domains. Scale bar, 5 μm. Tissue sections from two animals were analyzed with the same results for both sets of stainings.
Figure 10.
Figure 10.
ACSA-2 staining is retained in reactive astrocytes. A, IBA1 (microglia), GFAP (reactive astrocytes), and ACSA-2 staining 5 days after a stab wound injury to the cortex. A low-magnification confocal image shows the pronounced migration of microglia ipsilateral (ipsi) to the injury. Astrocytes in the immediate vicinity of the injury appear to be lost, although those that remain appear to be highly reactive (as judged by up-regulation of GFAP expression throughout the ipsilateral cortex in comparison with the contralateral (contra) side). Note that ACSA-2 staining is still widespread even on reactive astrocytes, including those immediately adjacent to the site of injury. Tissue sections from three animals were analyzed with the same results. Scale bars, 200 μm. B, staining for IBA1, GFAP, S100β (astrocytes), and ACSA-2 in the cortex of an AppNL-G-F knock-in model of Alzheimer's disease at 6 months of age. Animals at this age show clear amyloid plaques in the cortex, which cause typical accumulation of microglia and local reactive astrogliosis, as seen in the low-magnification confocal images (top). Note that the ACSA-2 signal is consistent across the cortex. The boxed region is shown at higher magnification in the bottom panels. Plaques cause local aggregates of microglia to form in the tissue, which exclude astrocytes (as judged using an independent marker for astrocyte cell bodies, S100β). Astrocytes immediately adjacent to plaques show high levels of reactivity (as judged by up-regulation of GFAP expression) but do not lose immunoreactivity for ACSA-2. Tissue sections from two animals were analyzed with the same results. Scale bars, 200 μm (low magnification) and 20 μm (high magnification).
Figure 11.
Figure 11.
Schematic of cell labeling with ACSA-2. This schematic attempts to summarize our understanding of ACSA-2 binding to astrocytes. Multiple lines of experimental evidence suggest that the target of ACSA-2 is ATP1B2. ATP1B2 is a single-pass transmembrane protein, consisting of a short N-terminal intracellular region (which is protected from binding by ACSA-2 by the shielding effect of the plasma membrane) and a longer extracellular C-terminal domain. Although detailed epitope mapping was not undertaken, immunoblotting experiments, performed immediately after cell isolation, indicate that ATP1B2 is sensitive to papain, because the apparent molecular mass of the protein decreases from 55 to 25 kDa (data not shown). The proteolytically sensitive region is outlined with a dashed line in this schematic. As such, ACSA-2 must be binding ATP1B2 on an intact, membrane-proximal region, as illustrated, to be useful for immunoisolation.

References

    1. Barres B. A. (2008) The mystery and magic of glia: a perspective on their roles in health and disease. Neuron 60, 430–440 - PubMed
    1. McCarthy K. D., and de Vellis J. (1980) Preparation of separate astroglial and oligodendroglial cell cultures from rat cerebral tissue. J. Cell Biol. 85, 890–902 - PMC - PubMed
    1. Foo L. C., Allen N. J., Bushong E. A., Ventura P. B., Chung W. S., Zhou L., Cahoy J. D., Daneman R., Zong H., Ellisman M. H., and Barres B. A. (2011) Development of a method for the purification and culture of rodent astrocytes. Neuron 71, 799–811 - PMC - PubMed
    1. Zamanian J. L., Xu L., Foo L. C., Nouri N., Zhou L., Giffard R. G., and Barres B. A. (2012) Genomic analysis of reactive astrogliosis. J. Neurosci. 32, 6391–6410 - PMC - PubMed
    1. Doetsch F., Caillé I., Lim D. A., García-Verdugo J. M., and Alvarez-Buylla A. (1999) Subventricular zone astrocytes are neural stem cells in the adult mammalian brain. Cell 97, 703–716 - PubMed

Publication types

MeSH terms

LinkOut - more resources