. 2017 Apr 18;114(16):E3354-E3363.
doi: 10.1073/pnas.1702975114. Epub 2017 Apr 3.

Phosphatidylinositol 3-phosphate-binding protein AtPH1 controls the localization of the metal transporter NRAMP1 in Arabidopsis

Affiliations

Phosphatidylinositol 3-phosphate-binding protein AtPH1 controls the localization of the metal transporter NRAMP1 in Arabidopsis

Astrid Agorio et al. Proc Natl Acad Sci U S A. .

Abstract

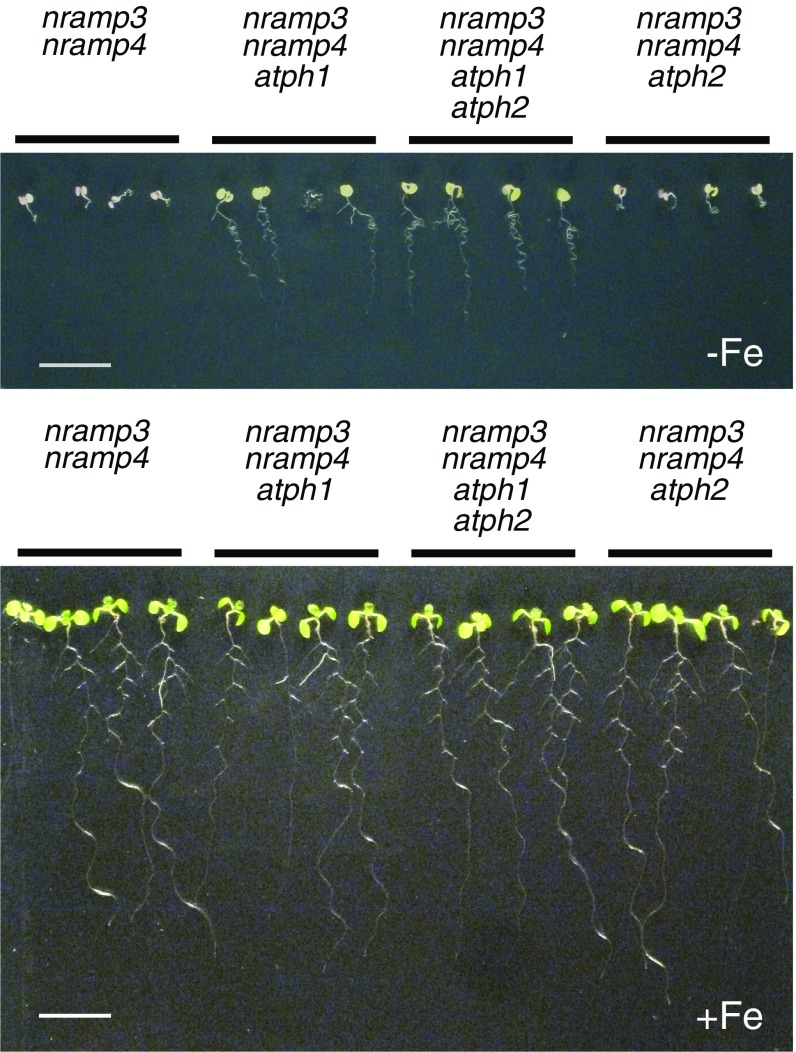
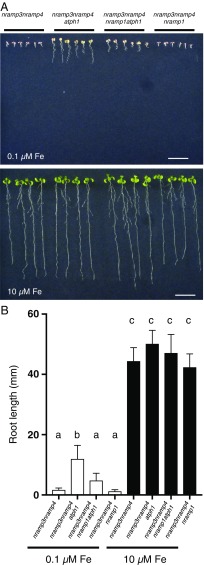
"Too much of a good thing" perfectly describes the dilemma that living organisms face with metals. The tight control of metal homeostasis in cells depends on the trafficking of metal transporters between membranes of different compartments. However, the mechanisms regulating the location of transport proteins are still largely unknown. Developing Arabidopsis thaliana seedlings require the natural resistance-associated macrophage proteins (NRAMP3 and NRAMP4) transporters to remobilize iron from seed vacuolar stores and thereby acquire photosynthetic competence. Here, we report that mutations in the pleckstrin homology (PH) domain-containing protein AtPH1 rescue the iron-deficient phenotype of nramp3nramp4 Our results indicate that AtPH1 binds phosphatidylinositol 3-phosphate (PI3P) in vivo and acts in the late endosome compartment. We further show that loss of AtPH1 function leads to the mislocalization of the metal uptake transporter NRAMP1 to the vacuole, providing a rationale for the reversion of nramp3nramp4 phenotypes. This work identifies a PH domain protein as a regulator of plant metal transporter localization, providing evidence that PH domain proteins may be effectors of PI3P for protein sorting.

Keywords: NRAMP; late endosome; metal transport; phosphatidylinositol 3-phosphate; vacuole.


Conflict of interest statement

The authors declare no conflict of interest.

Figures

Fig. 1.
Fig. 1.
nns1 partially reverts nramp3nramp4 phenotypes. (A) Wild-type (Ws), nramp3-1nramp4-1, and nns1 plants were grown vertically for 9 d on ABIS agar medium containing 30 µM CdCl2 (+Cd). (B) Root length of plants growing on ABIS medium (black bars) or supplemented with 30 µM CdCl2 (white bars). Data are shown as mean ± SD; n = 27–34 roots. (C) Wild-type (Ws), nramp3-1nramp4-1, and nns1 plants were grown vertically for 7 d on ABIS agar medium without Fe (−Fe). (D) Root length of plants growing on ABIS medium without Fe (white bars) or supplemented with 50 µM Fe-HBED (black bars). Data are shown as mean ± SD; n = 21–31. (Scale bars in A and C: 10 mm.)
Fig. 2.
Fig. 2.
The suppressor1 mutation affects AtPH1. (A) Alignment of reads from the nns1 mutant to the Col-0 reference genome (TAIR10) at the AtPH1/At2g27900 locus. Paired reads are in blue; broken pairs are in red and green. The translation of the At2g27900.1 gene model is given under the nucleotide sequence. The asterisk denotes the mutation identified in nns1 converting Arg46 to His. (B) Amino acid sequence of AtPH1/At2g27900.1. The PH domain is highlighted in gray, and the PPBM is highlighted in red. (C) Alignment of the AtPH1 PH domain N terminus showing conservation to other PH domain from Oryza sativa (XP_015638090.1), Physcomitrella patens (XP_001766896.1), Dictyostelium discoideum (XP_643886.1), A. thaliana DRP2A (NP_172500.1), Homo sapiens PKB/AKT1 (NP_001014431.1) and DAPP1 (NP_055210.1), and Saccharomyces cerevisiae ScOSH2 (NP_010265.1). The background color reflects sequence conservation. (D) Wild-type (Ws), nramp3-1nramp4-1, nns1, and homozygous T3 nns1 lines constitutively expressing AtPH1-GFP were grown vertically for 10 d on ABIS medium without iron (−Fe). (E) Wild-type (Col), nramp3-2nramp4-2, and nramp3-2nramp4-2atph1-2 plants were grown vertically for 8 d on ABIS medium without iron (−Fe) or for 10 d on medium containing 30 µM CdCl2 (+Cd). (Scale bars: 10 mm.)
Fig. S1.
Fig. S1.
The expression of AtPH1 under the control of the 2x35S promoter does not affect root growth under Fe-sufficient conditions. Wild-type (Ws), nramp3-1nramp4-1, nns1, and homozygous T3 nns1 lines constitutively expressing AtPH1-GFP under the control of the 2x35S promoter were grown vertically for 10 d on ABIS-agar medium containing 50 µM Fe-HBED (+Fe). This experiment was performed side-by-side with the experiment presented in Fig. 2D. (Scale bar: 10 mm.)
Fig. S2.
Fig. S2.
Molecular characterization of the atph1 and atph2 mutants. (A and B) Structure of the AtPH1/At2g29700.1 (A) andAtPH2/At5g05710.1 (B) ORFs showing the localization of the mutations isolated in this study. The localization of the primers used for RT-PCR experiments is shown also. (C) The presence of AtPH1 and AtPH2 transcripts in different genetic backgrounds was analyzed by RT-PCR using AtPH1-for3/AtPH1-rev1 and AtPH2-for1/AtPH2-rev1 primers, respectively. The PCR products were analyzed on a 1.5% agarose gel with the GeneRuler 1 Kb Plus DNA ladder (Thermo Fisher Scientific).
Fig. S3.
Fig. S3.
atph1 mutants do not show developmental and Fe-deficiency phenotypes. (A and B) atph1-1 (A) and atph1-2 (B) mutants were sown on ABIS-agar medium without Fe (−Fe) together with nramp3-1nramp4-1, nramp3-2nramp4-2, Ws, and Col respectively. Plants were grown vertically for 11 d at 21 °C with 16 h of light. (Scale bars: 10 mm.)
Fig. S4.
Fig. S4.
The atph2 mutation does not revert the nramp3nramp4 Fe-deficiency root-length phenotype. The atph2-1 mutant (Col) was crossed with nramp3-2nramp4-2 and nramp3-2nramp4-2atph1-2 mutants (Col). Seeds of nramp3-2nramp4-2, nramp3-2nramp4-2atph1-2, nramp3-2nramp4-2atph1-2atph2-1, and nramp3-2nramp4-2atph2-1 mutants were sown on ABIS-agar medium without Fe (−Fe) or supplemented with 100 µM Fe-HBED (+Fe). Plants were grown vertically for 11 and 8 d, respectively, at 21 °C with 16 h of light. (Scale bars: 10 mm.)
Fig. 3.
Fig. 3.
AtPH1 localization depends on binding to PI3P. (A) Confocal images of the root elongation zone of nns1 plants expressing AtPH1-GFP or AtPH1R46H-GFP under the control of the 2x35S promoter. The boxed area in the left panel is enlarged at right. Cell walls stained by PI are in magenta. The white arrow indicates the vacuolar membrane detaching from the cell periphery. (B) nns1 plants expressing AtPH1-GFP were crossed with plants expressing the PI3P marker 2xFYVE-mCherry. Colocalization of both fluorescent markers was analyzed by confocal microscopy on roots of F1 plants. On the merged picture the overlap of GFP (green) and mCherry (magenta) channels appears in white. Cell contours are represented by dashed lines. Pearson (rp) and Spearman (rs) correlation coefficients as well as M1 (GFP) and M2 (mCherry) Manders overlap coefficients above threshold were calculated. (C) The roots of nns1 plants expressing AtPH1-GFP were treated by 30 µM wortmannin or 0.1% DMSO for 3 h. (Scale bars: 10 µm.)
Fig. S5.
Fig. S5.
The R46H mutation affects the binding of AtPH1 to PI3P in vitro. (A) The structure of the AtPH1 PH domain was modeled using the structure of the PH domain of DAPP1 with inositol 1,3,4,5-tetrakisphosphate (IP4) as template (99.9% confidence). The position of the Arg46 lateral chain, corresponding to DAPP1 Arg184, is displayed (ProQ2 score = 0.00). (B) A close-up view of the area outlined in white in A. AtPH1 Arg46 is predicted to establish a hydrogen bond with the three-phosphate group of the IP4 inositol ring. (C) GST-AtPH1 and GST-AtPH1R46H proteins were purified from E. coli extracts. (D) GST-AtPH1 and GST-AtPH1R46H lipid overlay assay using a membrane spotted with serial dilutions of phospholipids (from 100–1.56 pmol per spot). A short (Upper) and a long (Lower) exposure are presented.
Fig. 4.
Fig. 4.
AtPH1 colocalizes with a marker of the LE/MVB. nns1 plants expressing AtPH1-GFP were crossed with plants expressing the trans-Golgi marker ST-mRFP, the TGN/EE marker mRFP-SYP43, or the LE/MVB marker mRFP-ARA7. Colocalization of fluorescent markers was analyzed by confocal microscopy on root epidermal cells of F1 plants. On merged pictures the overlap of GFP (green) and mRFP (magenta) channels appears white. Cell contours are represented by dashed lines. The regions within the white outline are enlarged in the lower panels (magnification: 3×). Pearson (rp) and Spearman (rs) correlation coefficients as well as M1 (GFP) and M2 (mRFP) Manders overlap coefficients above threshold were calculated. (Scale bars: 10 µm.)
Fig. S6.
Fig. S6.
Colocalization of AtPH1 with ARA6. Confocal images of the root elongation zone of transgenic F1 plants expressing AtPH1-GFP (A) or NRAMP1-GFP (B) and the LE/MVB marker mRFP-ARA6. Areas outlined in white on the left are enlarged on the right (magnification: 3×). On these merged images, the overlap of the GFP (green) and mRFP (magenta) channels appears in white. Dashed lines represent cell contours. Pearson (rp) and Spearman (rs) correlation coefficients as well as M1 (GFP) and M2 (mRFP) Manders overlap coefficients above threshold were calculated. (Scale bars: 10 µm.)
Fig. S7.
Fig. S7.
The nns1 mutant is not visibly affected in the biogenesis of ILVs. (A and B) Transmission electronic microscopy images of root cells from wild-type (Ws) (A) and the nns1 mutant (B). GA, Golgi apparatus; MVB, multivesicular bodies; V, vacuole. (Scale bars: 200 nm.) (C) The diameter of MVBs and the number of ILVs per MVB were quantified in Ws and nns1 strains. Results are shown as mean ± SD (Ws: 82 MVBs, 43 sections, two roots; nns1: 96 MVBs, 37 sections, two roots). Results were analyzed using a nonparametric Mann–Whitney test.
Fig. 5.
Fig. 5.
NRAMP1 loss of function partially reverts the effect of atph1. (A) The multiple mutants nramp3-2nramp4-2, nramp3-2nramp4-2atph1-2, nramp3-2nramp4-2nramp1-1atph1-2, and nramp3-2nramp4-2nramp1-1 (Col) were grown vertically for 10 d on Hoagland-agar medium containing a limited amount of Fe (0.1 µM Fe-HBED) or sufficient Fe (10 µM Fe-HBED). Representative plants from four independent culture plates were realigned for the pictures. (Scale bars: 10 mm.) (B) Quantification of root lengths shown in A. Results are shown as mean value ± SD; n = 21–27, four independent plates; letters indicate significant differences according to a Kruskal–Wallis test corrected by a Dunn’s multiple comparison test; P < 0.01.
Fig. 6.
Fig. 6.
NRAMP1 is present in the endosomal pathway and on the plasma membrane. Root epidermal cells of nramp1 plants complemented by NRAMP1-GFP were imaged by confocal microscopy. (A) The vacuolar plane of elongating cells (Upper) and cortical plane of dividing cells (Lower) showing that NRAMP1-GFP was present mostly in cytoplasmic vesicles but also was detected on the plasma membrane (white arrow), more clearly in younger cells. Transmitted-light (differential interference contrast, DIC) images are shown also. (B, Upper) NRAMP1-GFP plants were crossed with plants expressing the trans-Golgi marker ST-mRFP, the TGN/EE marker mRFP-SYP43, and the LE/MVB marker mRFP-ARA7. Colocalization of fluorescent markers was analyzed in root epidermal cells of F1 plants. On the merged pictures the overlap of GFP (green) and mRFP (magenta) channels appears white. Cell contours are represented by dashed lines. (Lower) Enlarged view of the region marked by the white outline in the upper row (magnification: 3×). Pearson (rp) and Spearman (rs) correlation coefficients as well as M1 (GFP) and M2 (mRFP) Manders overlap coefficients above threshold were calculated. (Scale bars: 10 µm.)
Fig. S8.
Fig. S8.
The expression of NRAMP1-GFP complements the Mn deficiency phenotype of nramp1. The nramp1-1 mutant (Col) was transformed with pMUBI83-NRAMP1. Among four independent lines showing complementation of nramp1-1 phenotype, the homozygous single-locus line #K is shown (two homozygous T3 progenies). Plants were grown vertically for 9 d on Hoagland-agar medium made with EDTA-washed agar containing 20 µM Fe-HBED and supplemented (+Mn) or not (−Mn) with 5 µM MnSO4. (Scale bars: 10 mm.)
Fig. 7.
Fig. 7.
NRAMP1 localizes on the vacuole in the nns1 mutant. (A and B) NRAMP1-GFP and TagRFP-SYP22 were expressed in nramp3-1nramp4-1 (A) and nramp3-1nramp4-1atph1-1 (nns1) (B) mutants. Root epidermal cells in the elongation zone were imaged on a spinning disk confocal microscope for GPF and tagRFP. (Scale bars: 10 µm.) (C) NRAMP1 localization on the vacuole was quantified in single-plane images corresponding to individual cells of nramp3nramp4 (n = 48) and nramp3nramp4atph1 (n = 42) as a normalized fraction of NRAMP1-GFP signal colocalizing with the TagRFP-SYP22 signal. Note that because of the close proximity of cytoplasmic NRAMP1 structures with the vacuole, the value of the vacuolar membrane localization index is never null. In the graph, boxes include the two central quartiles, separated by the median. The whiskers extend to the 5th and 95th percentiles, and outliers are represented by a dot. P < 0.0001; Mann–Whitney test. (D) Root epidermal cells of nramp3nramp4 and nns1 mutants expressing NRAMP1-GFP were imaged across vacuolar planes using spinning disk confocal imaging. GPF fluorescence and transmitted-light (DIC) images are displayed. The asterisks denote the position of vacuoles. Plants were placed in darkness for 14 h (Dark) before imaging to reduce GFP degradation in the vacuoles. The contrast of the images was adjusted for the visualization of GFP in vacuoles. (Scale bar: 10 µm.)
Fig. S9.
Fig. S9.
Effect of Concanamycin A on NRAMP1-GFP localization. Root epidermal cells of nramp3nramp4 and nns1 mutants expressing NRAMP1-GFP were imaged across vacuolar planes by spinning disk confocal microscopy. GPF fluorescence and transmitted light images (DIC) are displayed. Plants were treated with 2 µM Concanamycin A (ConcA) for 3 h before imaging or with DMSO (0.1%) as control. The arrows indicate the position of vacuolar structures in which GFP signal accumulates upon ConcA treatment. (Scale bar: 10 µm.)
Fig. 8.
Fig. 8.
Possible hypotheses to explain the role of AtPH1 in the reversion of nramp3nramp4 through the regulation of NRAMP1 trafficking. (A) In wild-type plants, NRAMP1 could cycle between the plasma membrane and TGN/EE. A fraction of NRAMP1 is directed to the vacuole, where it is degraded. AtPH1 that localizes in LE/MVB and the vacuolar membrane could be involved in the targeting of NRAMP1 in ILVs (1), in the recycling of NRAMP1 from the LE/MVB compartment to the plasma membrane (2), or in the degradation of NRAMP1 on the vacuolar membrane (3). (B) The absence of functional AtPH1 in the nns1 mutant (nramp3nramp4atph1) leads to the accumulation of NRAMP1 on the membrane of the vacuole, thus complementing the activity of NRAMP3 and NRAMP4 in the remobilization of Fe from the vacuole.

References

    1. Kaplan J, Ward DM. The essential nature of iron usage and regulation. Curr Biol. 2013;23:R642–R646. - PMC - PubMed
    1. Briat JF, Dubos C, Gaymard F. Iron nutrition, biomass production, and plant product quality. Trends Plant Sci. 2015;20:33–40. - PubMed
    1. Murgia I, Arosio P, Tarantino D, Soave C. Biofortification for combating ‘hidden hunger’ for iron. Trends Plant Sci. 2012;17:47–55. - PubMed
    1. Robinson NJ, Procter CM, Connolly EL, Guerinot ML. A ferric-chelate reductase for iron uptake from soils. Nature. 1999;397:694–697. - PubMed
    1. Eide D, Broderius M, Fett J, Guerinot ML. A novel iron-regulated metal transporter from plants identified by functional expression in yeast. Proc Natl Acad Sci USA. 1996;93:5624–5628. - PMC - PubMed

Publication types

MeSH terms

Substances

LinkOut - more resources