. 2017 Apr 18;114(16):4225-4230.
doi: 10.1073/pnas.1620843114. Epub 2017 Apr 3.

Plasmodium falciparum erythrocyte-binding antigen 175 triggers a biophysical change in the red blood cell that facilitates invasion

Affiliations

Plasmodium falciparum erythrocyte-binding antigen 175 triggers a biophysical change in the red blood cell that facilitates invasion

Marion Koch et al. Proc Natl Acad Sci U S A. .

Abstract

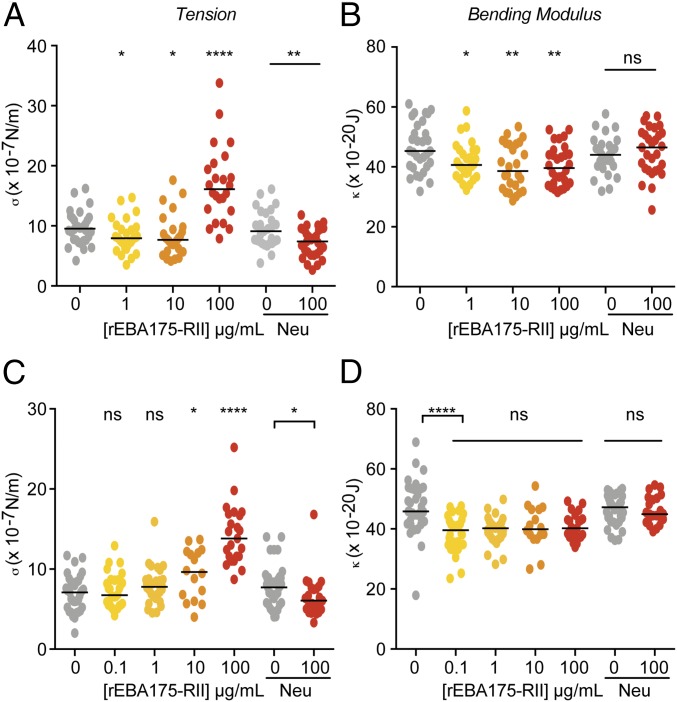
Invasion of the red blood cell (RBC) by the Plasmodium parasite defines the start of malaria disease pathogenesis. To date, experimental investigations into invasion have focused predominantly on the role of parasite adhesins or signaling pathways and the identity of binding receptors on the red cell surface. A potential role for signaling pathways within the erythrocyte, which might alter red cell biophysical properties to facilitate invasion, has largely been ignored. The parasite erythrocyte-binding antigen 175 (EBA175), a protein required for entry in most parasite strains, plays a key role by binding to glycophorin A (GPA) on the red cell surface, although the function of this binding interaction is unknown. Here, using real-time deformability cytometry and flicker spectroscopy to define biophysical properties of the erythrocyte, we show that EBA175 binding to GPA leads to an increase in the cytoskeletal tension of the red cell and a reduction in the bending modulus of the cell's membrane. We isolate the changes in the cytoskeleton and membrane and show that reduction in the bending modulus is directly correlated with parasite invasion efficiency. These data strongly imply that the malaria parasite primes the erythrocyte surface through its binding antigens, altering the biophysical nature of the target cell and thus reducing a critical energy barrier to invasion. This finding would constitute a major change in our concept of malaria parasite invasion, suggesting it is, in fact, a balance between parasite and host cell physical forces working together to facilitate entry.

Keywords: erythrocyte; flicker spectroscopy; malaria; merozoite; real-time deformability cytometry.


Conflict of interest statement

Conflict of interest statement: O.O. is a cofounder of a company commercializing real-time deformability cytometry.

Figures

Fig. 1.
Fig. 1.
rEBA175-RII–mediated RBC biophysical changes. (A) Erythrocyte-binding assay with rEBA175-RII (labeled as RII). Untreated human RBCs and Neu-treated RBCs were incubated with rEBA175-RII. Bound protein was eluted with NaCl, and the presence of rEBA175-RII was evaluated by Western blotting. (B) Scatter plot of deformation versus cross-sectional area of control RBCs. Secondary populations of “larger cells” contains cell doublets or clumps. (Scale, channel width 20 µm.) (C) rEBA175-RII–treated RBCs caused a much higher percentage of cells to clump. These cells were removed from analysis of all samples. (Scale, channel width 20 μm.) (D) RBCs from three different donors (red, blue, and black lines) were exposed to a range of rEBA175-RII concentrations and show a concentration-dependent reduction in RBC deformation. (E) Deformation of RBCs pretreated with Neu was not significantly affected by treatment with rEBA175-RII. P values comparing the treatment versus control were calculated using linear mixed models (*P < 0.05; **P < 0.01). ns, nonsignificant.
Fig. S1.
Fig. S1.
Extracting the RBC tension and bending modulus from microscopy data. (A) RBC contour (shape) is first determined in each videotape frame by radially integrating the image intensity. (Scale bar, 5 μm.) (B) Contour is then Fourier-transformed to break down the contour shape into individual fluctuation modes and their associated amplitudes (modes 2–5 are shown). (C) Fluctuation mode amplitudes are fitted to the double-parameter model to extract the tension (σ) and bending modulus (κ) (gray line). The colored lines show the effect of multiplying (darker colors) or dividing (lighter colors) the tension (yellow lines) or bending modulus (blue lines) by a factor of 1.5. The effect of changes in the cell tension is most significant in the lower modes of the fluctuation power spectrum, and the bending modulus has a larger influence on the amplitude of the higher modes. Full details are provided by Yoon et al. (27).
Fig. 2.
Fig. 2.
Chemically induced tension and bending modulus changes in RBCs measured by flicker spectroscopy. Tension (σ) and bending modulus (κ) values of RBCs treated with glutaraldehyde (A and B), diamide (C and D), DMSO (E and F), and 7-KC (G and H) are summarized. Each circle represents data from a single cell, and the solid line represents the median. The mean square amplitude [h(qx)2(m)2] of contour fluctuation modes versus the wave vector (qx) of representative RBCs is shown in Fig. S2. P values comparing the treatment versus control were calculated using the Mann–Whitney test (**P < 0.01; ***P < 0.001; ****P < 0.0001).
Fig. S2.
Fig. S2.
Chemically induced tension and bending modulus changes in RBCs measured by flicker spectroscopy. Summary of tension (σ) and bending modulus (κ) values for RBC treatments is shown in Fig. 2. Here, the mean square amplitude [h(qx)2(m)2] of contour fluctuation modes versus wave vector (qx) of representative RBCs is shown for glutaraldehyde (A), diamide (B), DMSO (C), and 7-KC (D). The solid line corresponds to the fit of the data using the equation described in Materials and Methods, and the circles represent RBC contour fluctuation amplitudes of individual modes; only modes that are analyzed (modes 5–20) are shown.
Fig. 3.
Fig. 3.
rEBA175-RII–mediated tension and bending modulus changes measured by flicker spectroscopy. (AD) Summary of tension (σ) and bending modulus (κ) values of RBCs from different blood donors treated with a range of rEBA175-RII concentrations and with Neu. Each circle represents data from a single cell, and the solid line represents the median. Mean square amplitude [h(qx)2(m)2] of contour fluctuation modes versus wave vector (qx) of representative RBCs is shown in Fig. S3. P values comparing the treatment versus control were calculated using the Mann–Whitney test (*P < 0.05; **P < 0.01; ****P < 0.0001).
Fig. S3.
Fig. S3.
rEBA175-RII–mediated tension and bending modulus changes measured by flicker spectroscopy. Summary of tension (σ) and bending modulus (κ) values of RBCs from different blood donors treated with a range of rEBA175-RII concentrations and treated with Neu is shown in Fig. 3. (A and B) Mean square amplitude [h(qx)2(m)2] of contour fluctuation modes versus wave vector (qx) of representative RBCs is shown for two different donors. The solid line corresponds to the fit of the data using the equation described in Materials and Methods, and the circles represent RBC contour fluctuation amplitudes of individual modes; modes 5–20 are shown.
Fig. 4.
Fig. 4.
rEBA175-RII mediated increase in tension is dependent on the GPA cytoplasmic tail. (A and B) Summary of tension and bending modulus changes in MiV cells following rEBA175-RII incubation. Each circle represents data from a single cell, and the solid line represents the median. Mean square amplitude [h(qx)2(m)2] of contour fluctuation modes versus wave vector (qx) of representative RBCs is shown in Fig. S4. (C) Parasite invasion into MiV cells was measured by flow cytometry. Parasites used were a P. falciparum strain that invades using GPA (W2mefΔRh4) and a strain invading independent of this receptor (W2mefΔEBA175). P values comparing the treatment versus control were calculated using the Student’s t test (*P < 0.05; **P < 0.01; ****P < 0.0001).
Fig. S4.
Fig. S4.
rEBA175-RII–mediated increase in tension is dependent on the GPA cytoplasmic tail. A summary of tension and bending modulus changes in MiV cells following rEBA175-RII incubation is shown in Fig. 4. Here, the mean square amplitude [h(qx)2(m)2] of contour fluctuation modes versus wave vector (qx) of representative RBCs is shown. Solid lines correspond to the fit of the data using the equation described in Materials and Methods, and the circles represent RBC contour fluctuation amplitudes of individual modes; modes 5–20 are shown.
Fig. 5.
Fig. 5.
RBCs treated with 7-KC to decrease bending modulus are more readily invaded than control RBCs. RBCs pretreated with Fluo-4 AM (A) were incubated with rEBA175-RII and then stained with annexin V (B). Calcium influx (A) and phosphatidylserine exposure (B) were assessed by flow cytometry. Ctrl, control. (C and D) RBCs were treated with varying concentrations of 7-KC for 30 min and then washed and resuspended in fresh media before parasite schizonts were added. Parasite invasion [Rel. Parasitemia (%)] was quantified by flow cytometry. Strains used were w2mef∆EBA175 (C) and w2mef∆Rh4 (D). Rel., relative. P values comparing the treatment versus control were calculated using the Student’s t test (*P < 0.05; **P < 0.01; ***P < 0.001).
Fig. S5.
Fig. S5.
Model of EBA-175–mediated cytoskeletal and membrane changes during P. falciparum merozoite invasion of the RBC. (A) Before attachment, a proportion of GPA molecules are associated with the spectrin cytoskeleton, whereas others are free within the membrane. (B) GPA binding causes an increase in tension due to more extensive cytoskeletal cross-linking and a decrease in the RBC bending modulus (i.e., a reduction in the force requirement to achieve membrane bending/curvature).

Similar articles

Cited by

References

    1. WHO . World Malaria Report. World Health Organization (WHO); Geneva, Switzerland: 2016.
    1. Ashley EA, et al. Tracking Resistance to Artemisinin Collaboration (TRAC) Spread of artemisinin resistance in Plasmodium falciparum malaria. N Engl J Med. 2014;371:411–423. - PMC - PubMed
    1. Cowman AF, Berry D, Baum J. The cellular and molecular basis for malaria parasite invasion of the human red blood cell. J Cell Biol. 2012;198:961–971. - PMC - PubMed
    1. Bargieri D, et al. Host cell invasion by apicomplexan parasites: The junction conundrum. PLoS Pathog. 2014;10:e1004273. - PMC - PubMed
    1. Riglar DT, et al. Super-resolution dissection of coordinated events during malaria parasite invasion of the human erythrocyte. Cell Host Microbe. 2011;9:9–20. - PubMed

Publication types

MeSH terms